The Code Matrix Browser (CMB) visualizes which codes have been assigned to which documents. The matrix provides an overview of how many document segments from each document have been assigned a specific code, and this for each existing code.
The Code Matrix Browser is constructed as follows: Documents are listed in the columns while codes are listed in the rows. The symbols at the conjunction points represent the number of coded segments that are coded with a particular code. The larger the symbol, the more coded segments are assigned to the code in question. Document groups, document sets, or focus group speakers can also be displayed in the columns of the CMB, for example, to compare individual cases or groups of cases.

The Code Matrix Browser can be opened in the following ways:
- Selecting Code Matrix Browser from the Visual Tools menu tab, or
- using the keyboard shortcut Ctrl+Alt+M (Windows) or ⌘+⌥+M (macOS)
Code Matrix Browser options
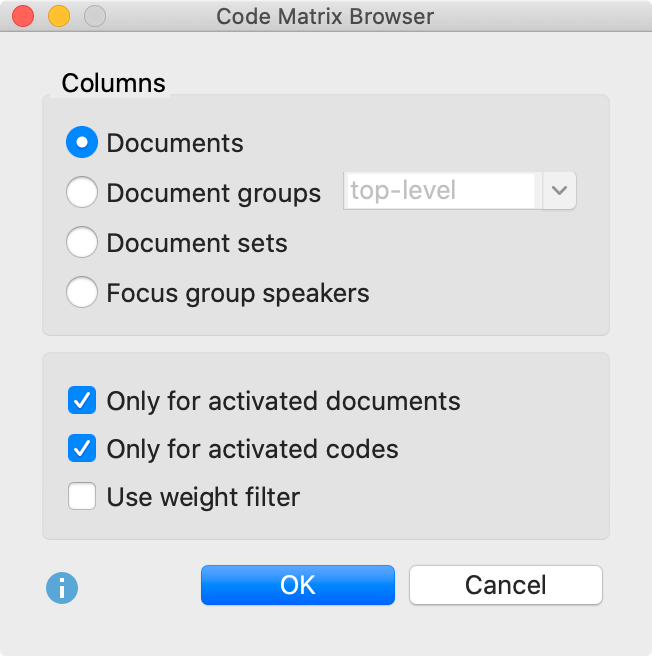
After opening the Code Matrix Browser an options window will appear, which allows you to change display options. Often, only the activated documents might be of interest, for example.

First, you have to decide whether the results should be grouped or not:
Documents – No grouping, every document has a column.
Document groups – The columns are made up of document groups. The coded segments of the documents in each group will be summed up.
Document sets – The columns are made up of document sets. The coded segments of the documents in each document set will be summed up.
Focus group speakers – Focus group participants are displayed in the columns.
Further options allow you to restrict the visualization to selected data:
Only for activated documents – Only the activated documents will be taken into account.
Only for activated focus group speakers - Only the activated speakers are displayed in the columns. This option is only visible if you selected the focus group participants to be displayed in the columns.
Only for activated codes – Only the activated codes will be displayed as rows.
Use weight filter – Only coded segments with a weight within the limits of the currently defined weight filter will be used.
Code Matrix Browser toolbar
The toolbar is the first thing you will see at the top of the Code Matrix Browser window. Here you have access to the following functions:
![]() Interactive Quote Matrix – Displays the coded segments associated with the cells in an interactive view.
Interactive Quote Matrix – Displays the coded segments associated with the cells in an interactive view.
![]() Display codes with hierarchy - If the option is activated, the codes are displayed in the tree structure of the code system. Even if the “Only activated codes” option is selected, non-activated upper codes are also included to preserve the tree structure (for these, however, all frequencies will be set to 0, even if coded segments exist; that is, no symbols or numbers will be displayed on the nodes for these rows). If the option is deactivated, all codes are displayed on one level. If the “Only activated codes” option is activated, then only the activated codes are displayed.
Display codes with hierarchy - If the option is activated, the codes are displayed in the tree structure of the code system. Even if the “Only activated codes” option is selected, non-activated upper codes are also included to preserve the tree structure (for these, however, all frequencies will be set to 0, even if coded segments exist; that is, no symbols or numbers will be displayed on the nodes for these rows). If the option is deactivated, all codes are displayed on one level. If the “Only activated codes” option is activated, then only the activated codes are displayed.
![]()
![]()
![]() Names, columns: none/short/full – There are three possible options for displaying the names of documents, document groups, document sets, and focus group participants in the column headings:
Names, columns: none/short/full – There are three possible options for displaying the names of documents, document groups, document sets, and focus group participants in the column headings:
- no names: The column headers remain empty.
- short names: Display of the first eight characters (usually recommended).
- full names: Full name will be displayed.
Place the mouse cursor on a column heading to display the full document name, including its document group.
![]() Calculation of symbol size refers to all coded segments.
Calculation of symbol size refers to all coded segments.
![]() Calculation of symbol size refers to the column.
Calculation of symbol size refers to the column.
![]() Calculation of symbol size refers to the row.
Calculation of symbol size refers to the row.
![]() Display nodes as squares.
Display nodes as squares.
![]() Display nodes as circles.
Display nodes as circles.
![]() Display nodes as values.
Display nodes as values.
![]() Display heatmap with values.
Display heatmap with values.

![]() Count hits per document only once – Representation in the CMB does not refer to the number of segments, but to the documents, i.e., it is only considered whether the relevant code is present in a document or not. With collapsed subcodes, the code frequencies of the subcodes are summed up.
Count hits per document only once – Representation in the CMB does not refer to the number of segments, but to the documents, i.e., it is only considered whether the relevant code is present in a document or not. With collapsed subcodes, the code frequencies of the subcodes are summed up.
![]() Binarize view – Regardless of how many coded segments are presented in a cell, this function displays only whether a coding is present or not; the symbol size is therefore unified. Even when a collapsed subcode with multiple codings is present, only one will be counted.
Binarize view – Regardless of how many coded segments are presented in a cell, this function displays only whether a coding is present or not; the symbol size is therefore unified. Even when a collapsed subcode with multiple codings is present, only one will be counted.
![]() Sum – Displays the sum of rows and columns.
Sum – Displays the sum of rows and columns.
![]() Sort columns by similarity of code pattern and sum of frequencies – By default, the order of columns is based on the “Document System”. Clicking this icon, sorts the current display, so that columns with many codes are placed on the left and columns with few codes on the right. Columns with identical code patterns and frequencies are placed next to each other. This feature is helpful to identify patterns and regularities and to find similarities between cases or groups.
Sort columns by similarity of code pattern and sum of frequencies – By default, the order of columns is based on the “Document System”. Clicking this icon, sorts the current display, so that columns with many codes are placed on the left and columns with few codes on the right. Columns with identical code patterns and frequencies are placed next to each other. This feature is helpful to identify patterns and regularities and to find similarities between cases or groups.
![]() Refresh – Updates display by recalling the function.
Refresh – Updates display by recalling the function.
Information window for a node
The size and color of the symbols in the matrix show how many segments of a code have been assigned to each document, document group, document set, or focus group speaker. The larger the symbol, the more segments were assigned for this code.
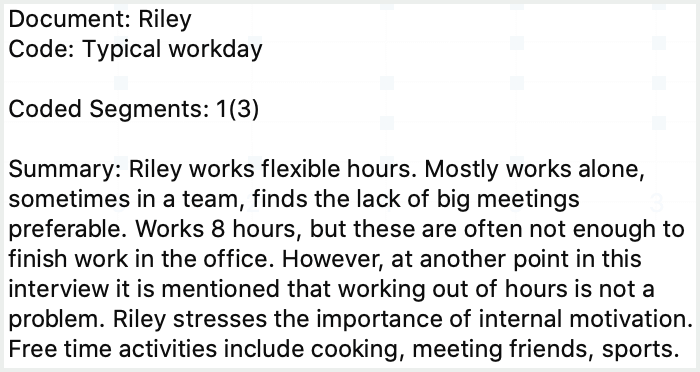
When you move the mouse cursor on a node, a small info window appears:

If documents are displayed in the columns, the name of the document, the code or subcode, and the number of coded segments assigned to the code are shown in the box. If the option Count hits only once per document is selected, the actual number of codes for the node is additionally displayed in brackets behind the number used for the visualization. In the example, “1(3)” means that 1 coded segment for “Typical workday” is displayed in the column with the document "Riley", but actually, there are 3 coded segments with this code in the document.
What happens when collapsing codes?
By default, the codes are displayed in the CMB in the same way as in the “Code System”, that is, in a hierarchical “tree” structure. Subcodes can be collapsed in the usual way, by clicking the > symbol. When the subcodes are collapsed, the number of coded segments is summed up on the parent code level. For example, if a parent code (that hasn’t been applied in a document) has three subcodes with 10 coded segments each, when you collapse the subcodes, the parent code will show 30 coded segments.
Compiling the coded segment for a node
The coded segments “behind” a node, can be called up immediately by double-clicking on the node. The relevant document and code are then activated and the coded segments appear in the “Retrieved Segments” window. It is possible to keep the CMB open, allowing one to easily view the contents of different nodes.
How is the symbol size determined?
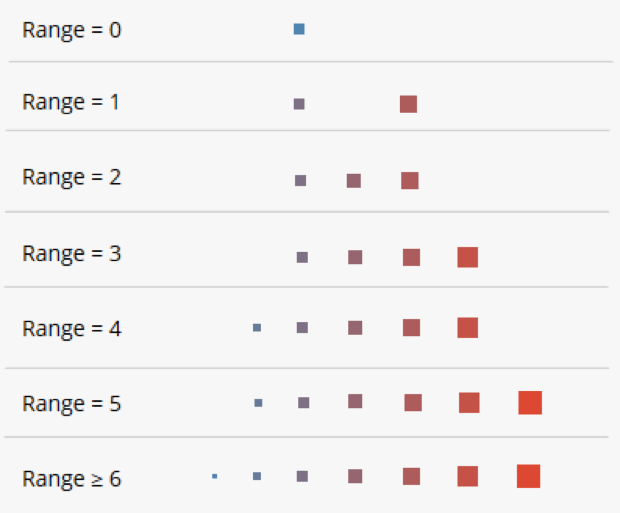
MAXQDA determines the smallest and largest code frequency of all displayed nodes and then divides the distance between these two values into seven equally-sized value ranges. For the smallest value range, the smallest symbol is used and for the largest value range the largest. In addition, the maximum distance between the displayed code frequencies is taken into account. For example, if codes occur only once or twice in the displayed documents, this distance is very small, and neither the smallest nor the largest squares will be used, but two medium-sized ones, to not over-emphasize the difference. The following graphic shows which square sizes are used at which distance between the smallest and largest values (the range). If the smallest displayed value is e.g. 5, and the highest is 8, then the range is 8-5 = 3. The cells with value 5 are then assigned the smallest square from row “Range = 3”, the cells with value 8, the largest from this row. If all the visualized numbers are identical (“Range = 0”), a medium-sized square will be displayed for all values.

Collapsing or expanding codes can change the overall view because this may change the smallest and/or the greatest value in the display.
If the Calculation of symbol size refers to the column/row option is selected, the described mechanism is applied individually to each column or row.
Store view in Questions – Themes – Theories
In the Questions – Themes – Theories window, you can collect and comment on all the important results of your project. Click the ![]() Send to QTT Worksheet icon in the upper right corner to save the current view in a new or existing worksheet.
Send to QTT Worksheet icon in the upper right corner to save the current view in a new or existing worksheet.
Exporting the Code Matrix Browser
In the CMB toolbar, there are three icons on the right that can be used to export the display:
![]() Copy current display as an image to clipboard - Copies the visible area to the clipboard so that you can easily paste the results into reports or presentations by, for example, using Ctrl + V (Windows) or ⌘+V (macOS).
Copy current display as an image to clipboard - Copies the visible area to the clipboard so that you can easily paste the results into reports or presentations by, for example, using Ctrl + V (Windows) or ⌘+V (macOS).
![]() Open as Excel table – Exports the complete matrix with the frequencies as an Excel file and opens it. The columns and rows are swapped to allow easy import into SPSS and other statistical software.
Open as Excel table – Exports the complete matrix with the frequencies as an Excel file and opens it. The columns and rows are swapped to allow easy import into SPSS and other statistical software.
![]() Export – Exports the complete matrix with the frequencies in Excel or HTML format. The columns and rows are swapped to allow easy import into SPSS and other statistical software. Exporting as a graphics file is also possible.
Export – Exports the complete matrix with the frequencies in Excel or HTML format. The columns and rows are swapped to allow easy import into SPSS and other statistical software. Exporting as a graphics file is also possible.
