Using the Code Frequencies feature, you can create a table or chart that shows how many segments and how many documents have been coded with selected codes. Since the documents often correspond to specific cases (e.g. interviews or organizations), the following function can be used to quickly analyze for how many cases a particular topic has been coded.
Follow these steps:
- Activate the documents you want to include in your analysis. If you want to include all the documents, you don’t need to activate anything.
- Start your analysis via Analysis > Code frequencies.
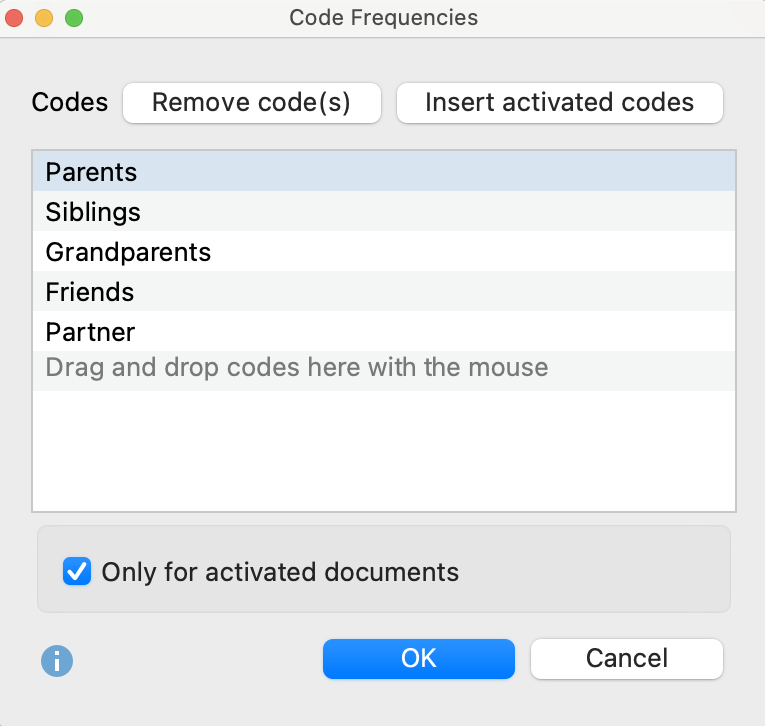
- The following dialog window will appear, to which you can drag the codes to be analyzed from the "Code System" using the mouse. To insert more than one code, you can activate it at any time and then use the Add activated codes button. The Only for activated documents option is automatically selected if documents were activated when the function was opened. Deselect this option to analyze all documents

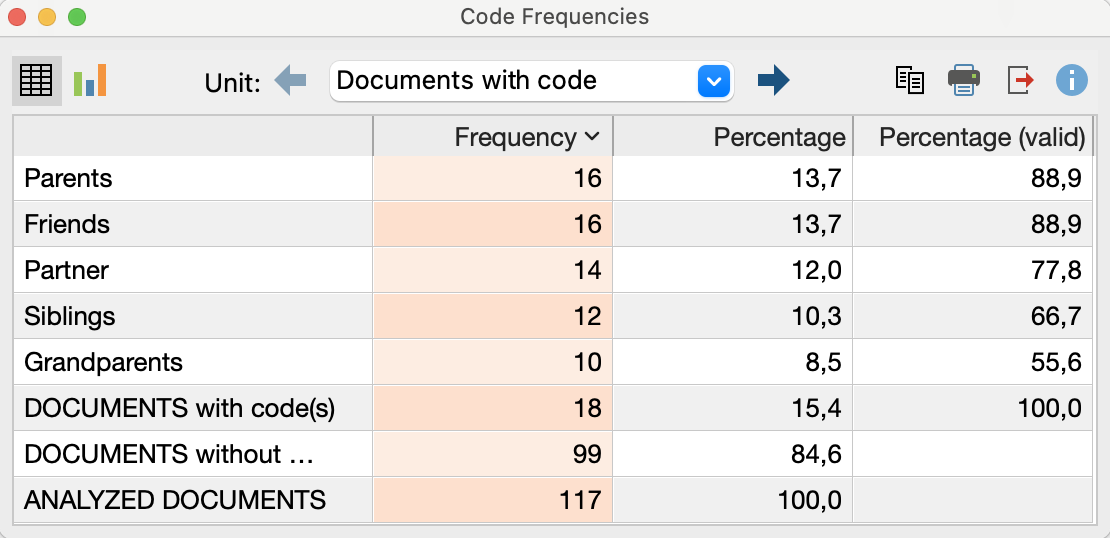
After clicking OK the following frequency table will appear, which shows in how many documents the code occurs.
Documents per code

The bottom three rows contain the following information:
DOCUMENTS with code(s) – refers to the number of documents in which at least one of the analyzed codes occurs.
DOCUMENTS without codes – refers to the number of documents in which none of the analyzed codes occur.
ANALYZED DOCUMENTS – refers to the sum of the two numbers directly above and gives the number of all analyzed documents.
Segments per code
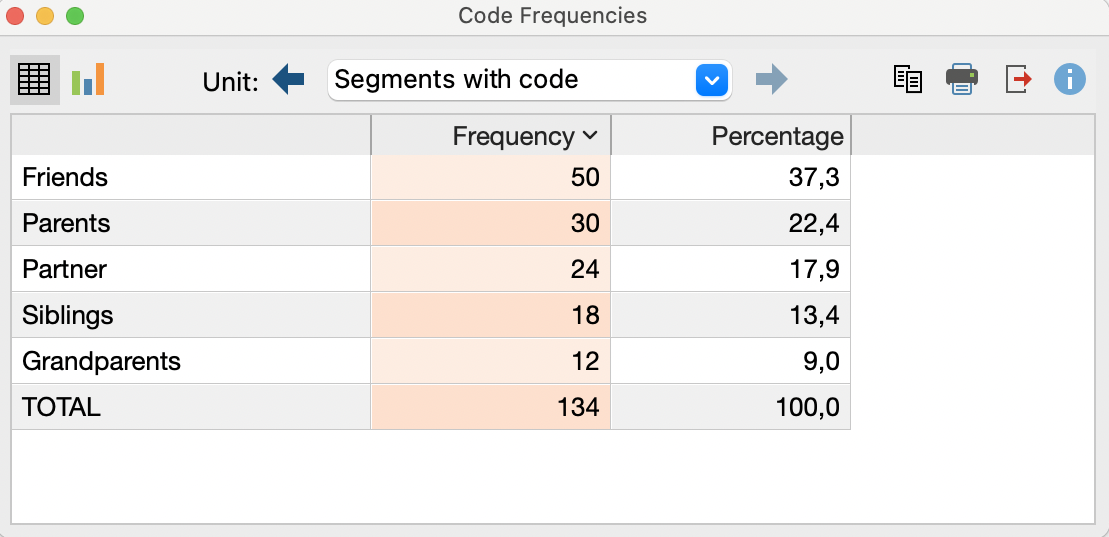
If you click on the blue arrow in the toolbar, MAXQDA switches the display to "segments with code". Segments are then counted rather than documents. The results table shows how many segments the listed codes have been assigned to in the selected documents.

In the second line of the table, you can see that the "Parents" code has been assigned to 30 segments within the analyzed data. This corresponds to 22,4% of the analyzed coded segments.
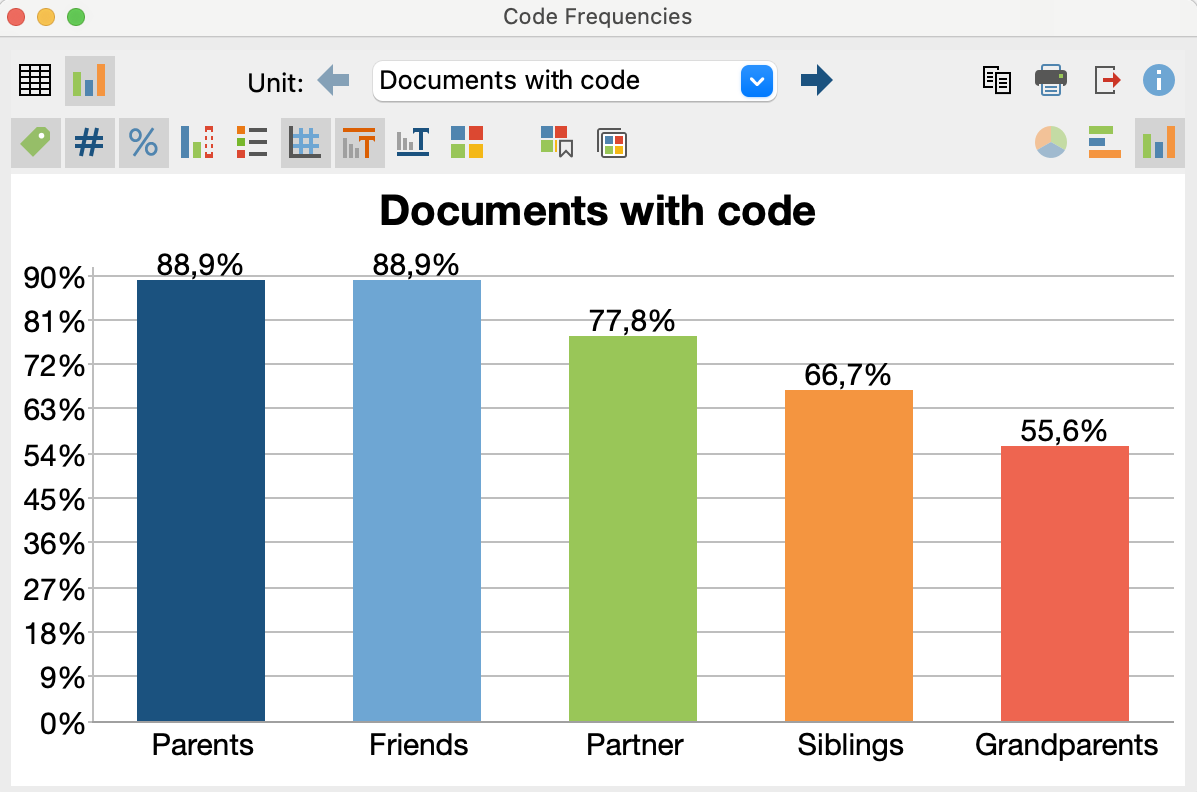
Code frequencies displayed as a chart
By clicking on the chart symbol in the upper left corner, the currently displayed frequency table can be displayed as a bar, column, or circle chart. Refer to the Frequency Tables and Subcodes section for further information on charts.

Export and print code frequencies
The current display (table or chart) can be printed and exported via the usual symbols on the top right corner of the window.
![]() Copy - copies the current view to the clipboard to allow you to then paste it into a report, presentation or graphics software.
Copy - copies the current view to the clipboard to allow you to then paste it into a report, presentation or graphics software.
![]() Print – prints the currently displayed window.
Print – prints the currently displayed window.
![]() Export – exports frequency tables as Excel files or as web pages in HTML format. Exports charts as image files in PNG or SVG format or in EMF format (Windows only).
Export – exports frequency tables as Excel files or as web pages in HTML format. Exports charts as image files in PNG or SVG format or in EMF format (Windows only).
