Questionnaire analysis – made simple
Questionnaires are frequently used by researchers from various fields to gather opinions, attitudes, and behaviors, and to identify trends or correlations. The biggest advantage of a questionnaire analysis is that questionnaires provide a structured and efficient way to collect data from a large number of individuals. Researchers use questionnaire analysis methods to interpret the collected responses. It involves extracting valuable insights and patterns from the data gathered, enabling researchers or analysts to draw conclusions and make informed decisions based on the results. With MAXQDA as your all-in-one questionnaire analysis software you can easily import and analyze standardized and open-ended questions and use a variety of analysis methods to gain insights from your questionnaire data such as content analysis, sentiment analysis, statistical methods, mixed methods approaches, and much more.
How to conduct a questionnaires analysis with MAXQDA
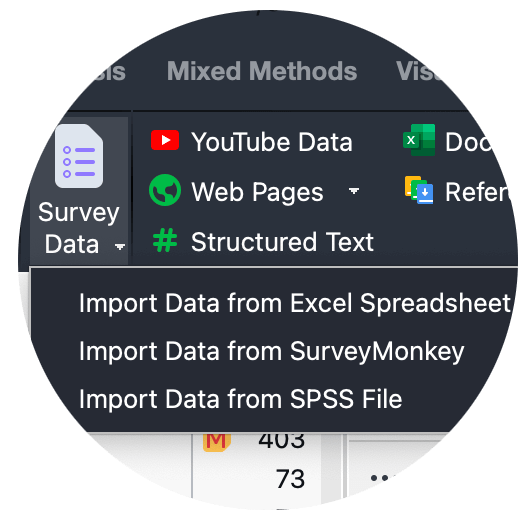
With MAXQDA, conducting a questionnaire analysis is easy because you can easily import standardized as well as open-ended questions directly from SPSS or Survey Monkey or as an Excel spreadsheet. You can freely define whether responses to a question should be treated as a variable, a code, or both. In addition, MAXQDA can handle a variety of data types ranging from dichotomous response to free-form text responses with specialized analysis tools for each data type. But there is more – as an all-in-one questionnaire analysis software, MAXQDA provides tools for presenting your results and archiving your data.
Step one: Plan your questionnaire analysis
Before analyzing your data in MAXQDA, you should carefully plan your analysis. Planning a questionnaire analysis is a crucial step in conducting a successful survey. Proper planning ensures that you collect relevant data, use appropriate analysis methods, and draw meaningful insights from the responses. To do so, clearly articulate the research objectives and determine the target audience. Based on that, either select already established questionnaires or develop your own questionnaires. Try to develop questionnaire items that are clear and concise and unbiased from leading language. As missing data, incomplete responses, and careless responding might occur, decide how to handle these occurrences prior to collecting data.
Step two: Import survey responses
When you have enough questionnaire responses or your time window for data collection is over, you can easily export your responses in most Online Survey tools in various data formats. When using SurveyMonkey for data collection, you can import survey data directly from SurveyMonkey into an open MAXQDA project in order to analyze the questionnaire responses with all MAXQDA tools. Alternatively, you can import data sets from a survey that are available in an SPSS file into a MAXQDA project. For an smooth import of your Excel file, organize your data as follows: each row representing a respondent and each column representing a survey question or variable. To easily identify the variables or questions, make sure to use clear and concise headers as this will be the variable’s/code’s name. No matter the option you chose for importing the questionnaire responses – while importing the data, every case of the online survey becomes a MAXQDA document.
Step three: Set options for import
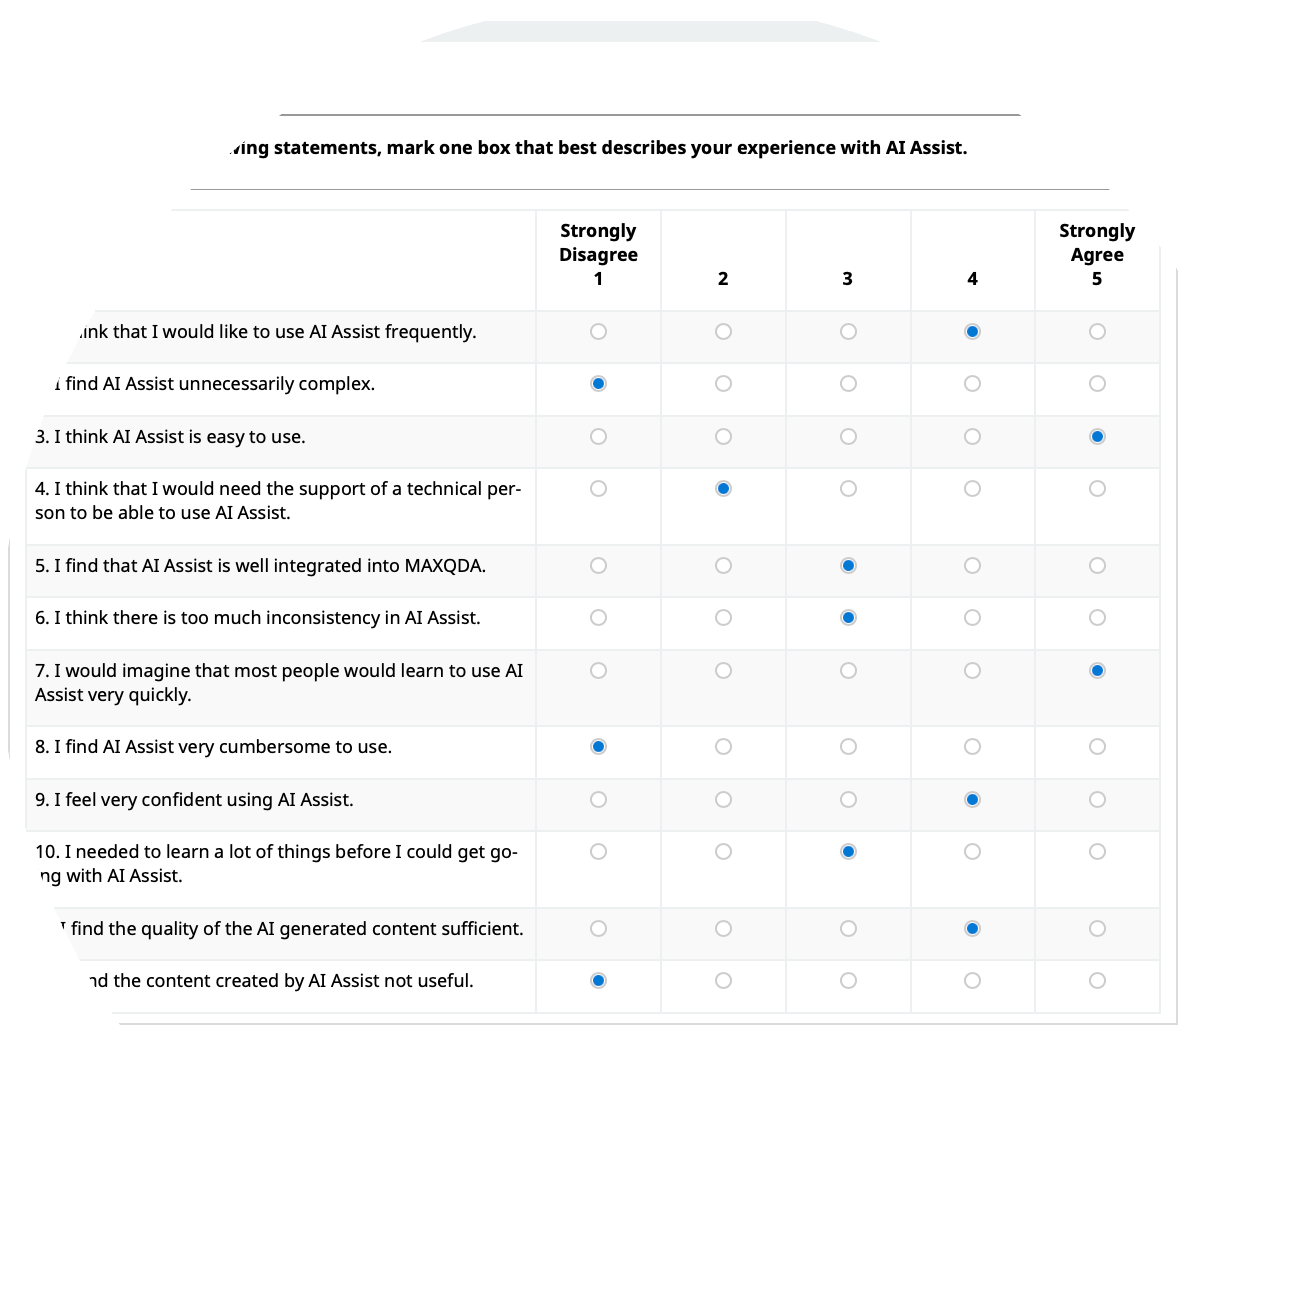
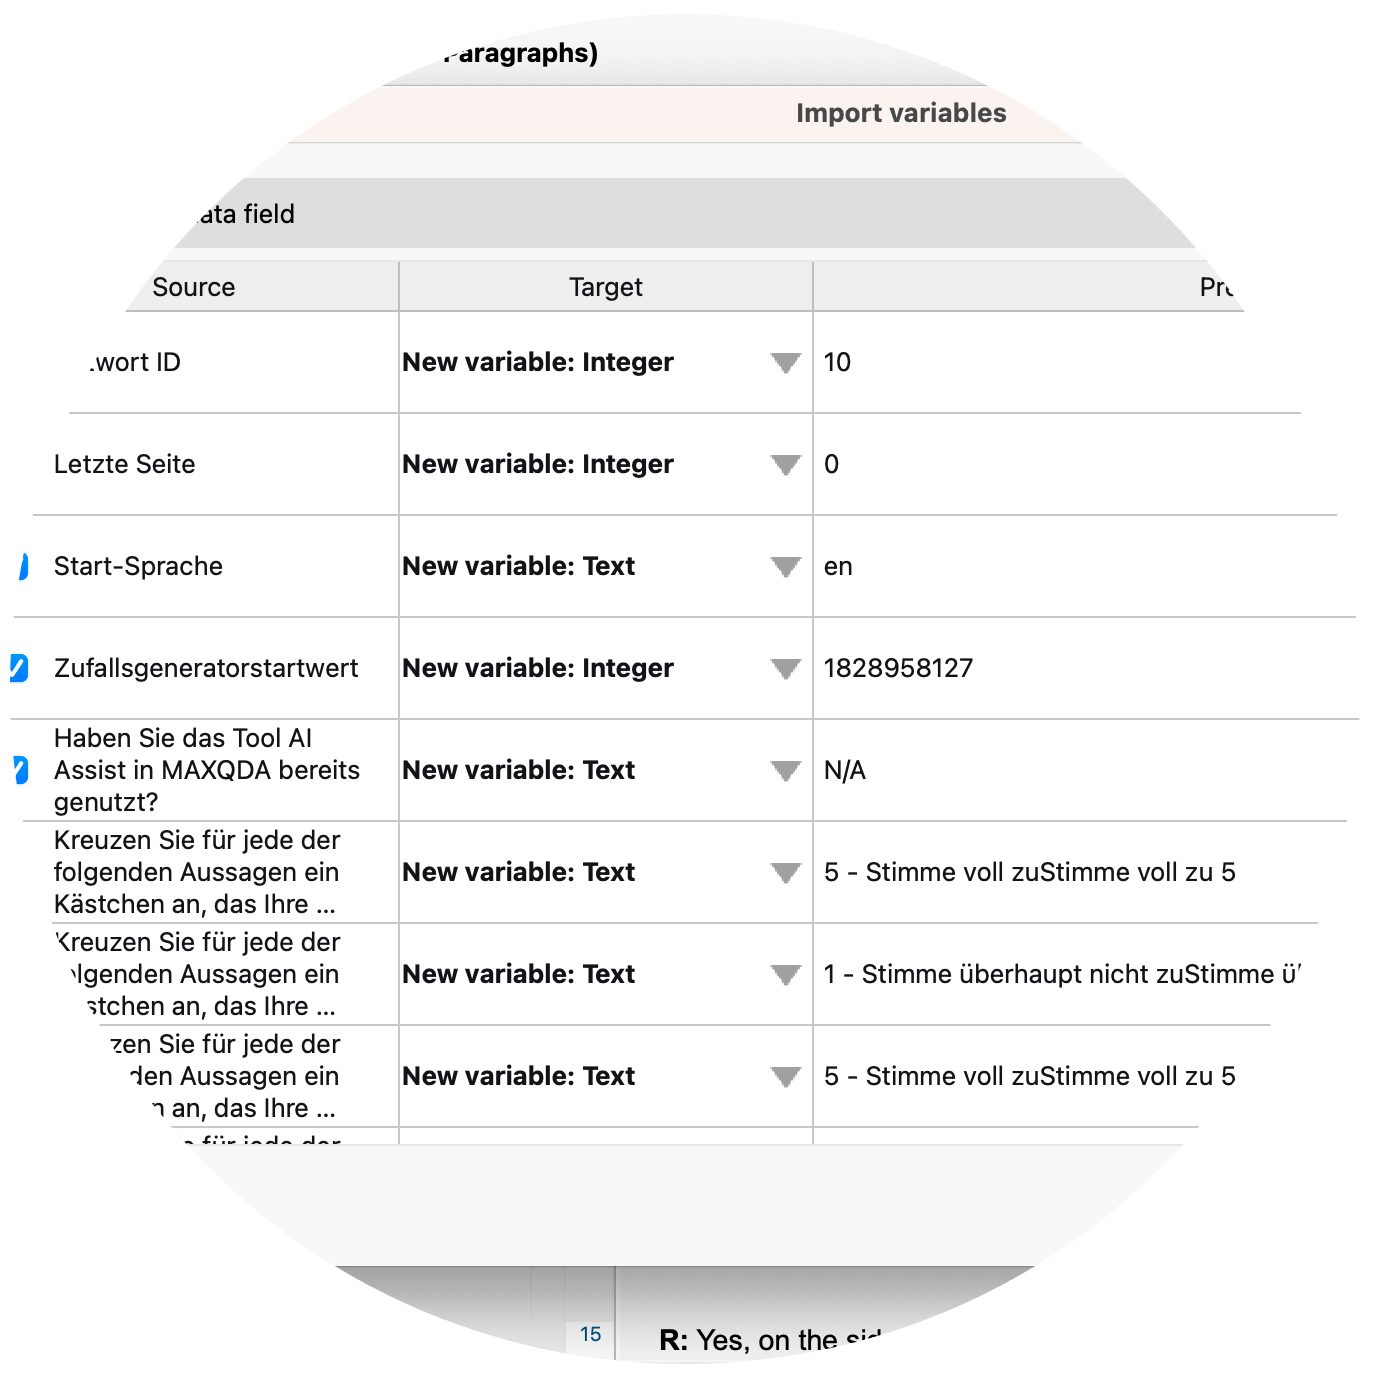
In all cases, upon import of the survey responses a window will open in which you can specify settings for the import. You can freely define which column contains the Document Names and if wanted which column contains the document groups’ names. You can import the responses as coded text as variables, or chose both. Depending on a column’s content, MAXQDA automatically suggests whether to import the responses to a question as a variable or as coded text. Of course, you can adjust these suggestions. When selecting “code”, MAXQDA will automatically create a new code with the column’s name. When selecting “variable”, MAXQDA will automatically create a Document variable in the corresponding variable format. Last but not least – MAXQDA presents a table where you can select a target variable and specify the variable type.
Questionnaire analysis with MAXQDA
Once you have imported your questionnaire responses, you can explore your material. With MAXQDA as your questionnaire analysis software, you have numerous possibilities for analyzing your data and writing your final report – impossible to mention all. Thus, we can present only a subset of tools here. Make sure to check out our literature about questionnaire analyses with MAXQDA to discover even more possibilities.
Categorize responses to open-ended questions
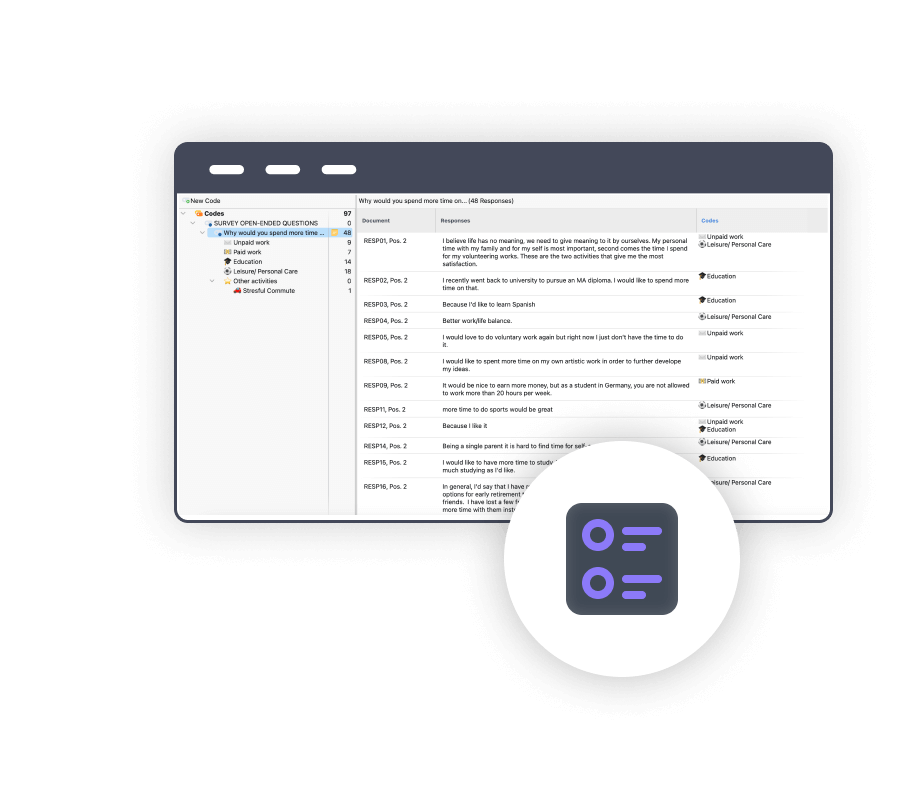
While conducting a questionnaire analysis, many researchers code the textual responses to open-ended questions. Coding refers to the process of assigning a category to a segment of your material. Because MAXQDA is a questionnaire analysis software designed by researchers for researchers, it supports a variety of coding approaches with specialized tools such as in-vivo coding, coding with emoticodes, and much more. With MAXQDA, you can easily create codes and organize them hierarchically. Simply go to the “Codes” window and click on new code. Highlight a text segment and apply the code via drag-and-drop.
Alternatively, you can use MAXQDA’s Categorize Survey Data tool. A tool specifically designed to help you analyzing responses to open questions in surveys efficiently and effectively with its interactive table window. The responses are listed in a table and can be categorized with existing or newly developed codes. In addition, you can write a comment regarding each response and display variable values.
More advantages of the categorize survey data tool
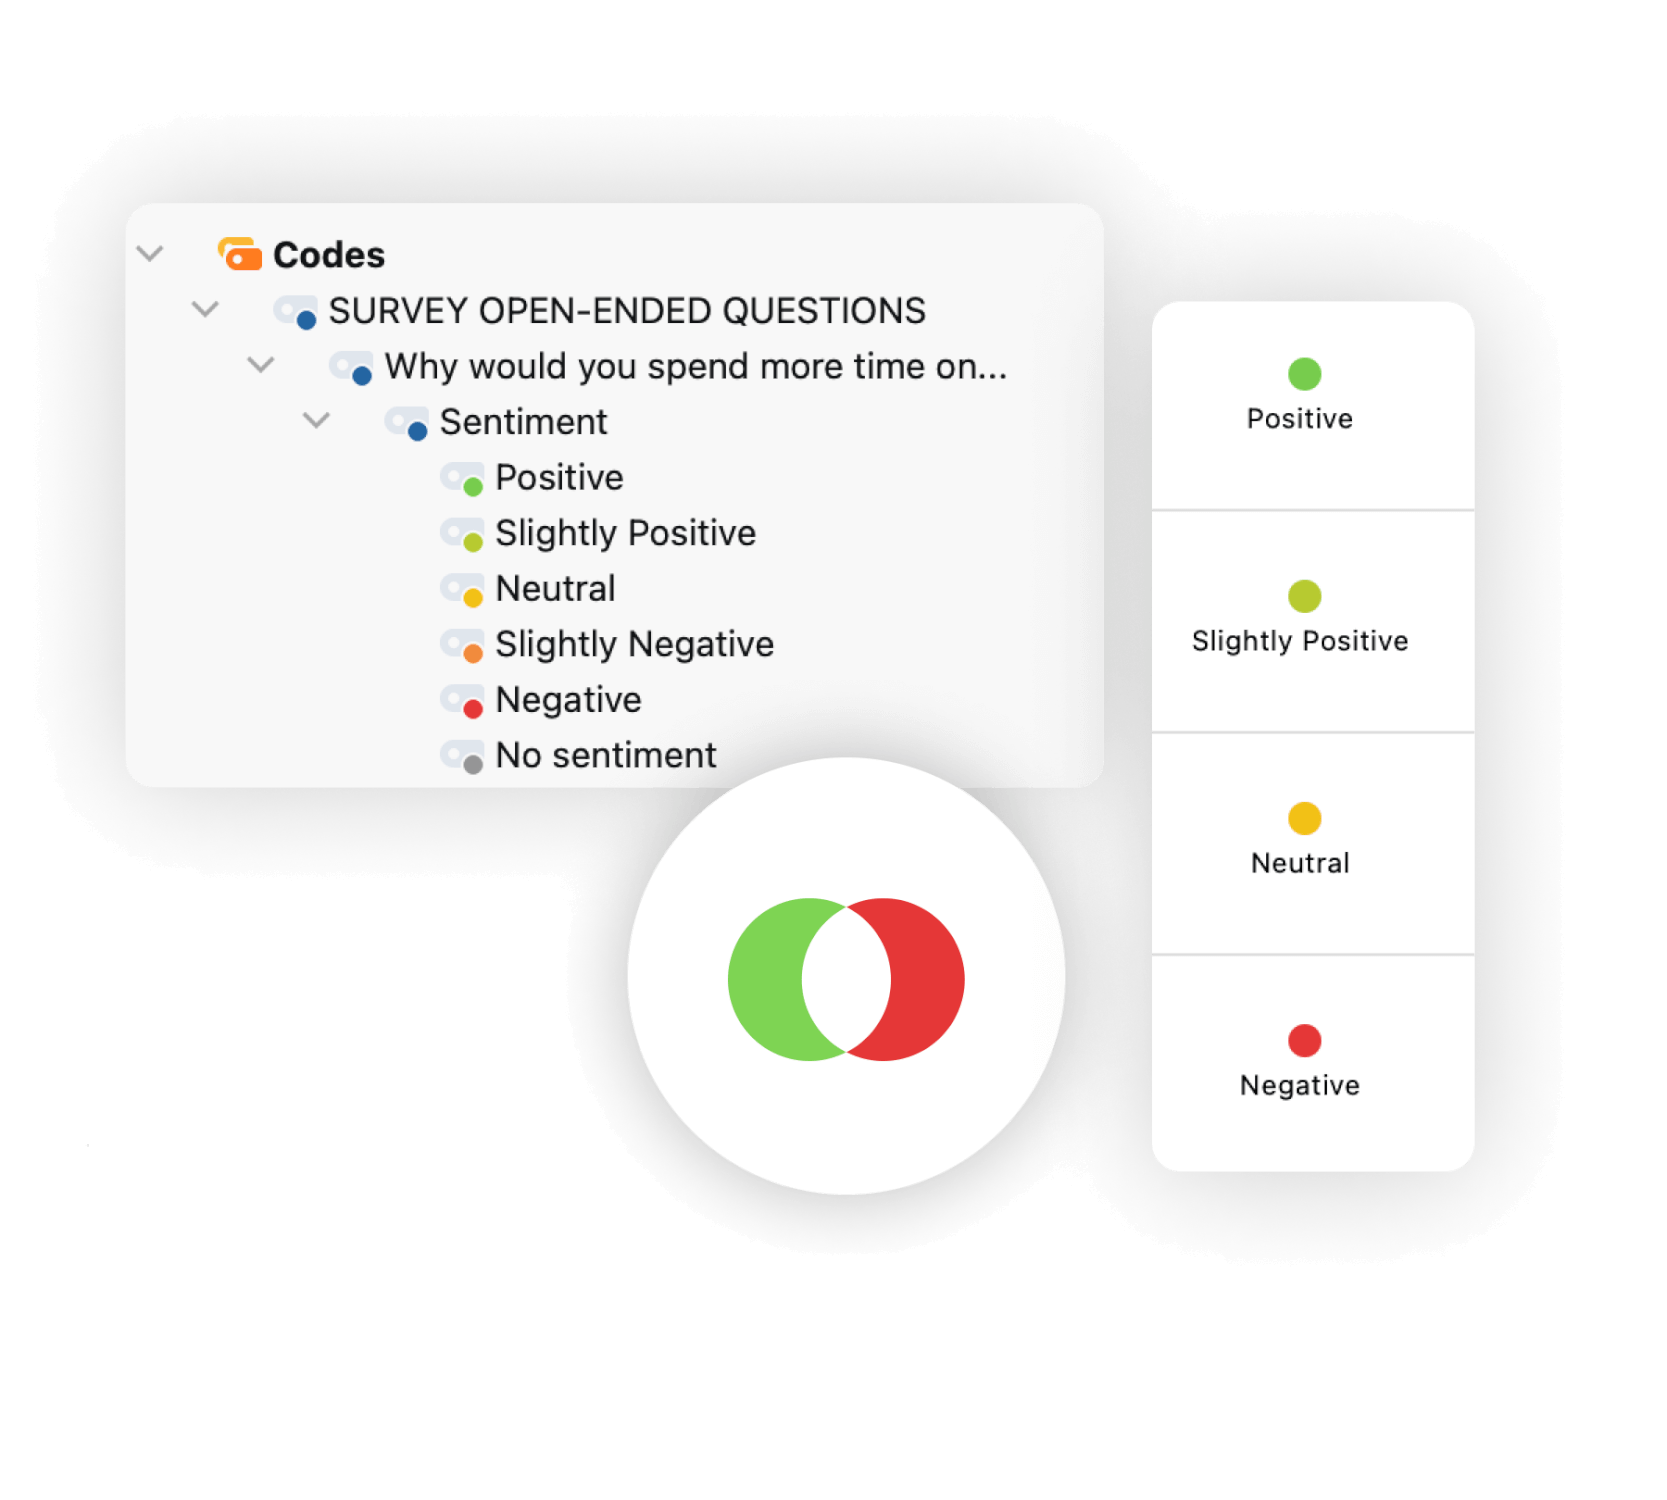
The categorize survey responses tool has even more to offer. For example, with AI Assist you can summarize open-ended survey responses. Especially well-suited for large amounts of text are MAXQDA’s Text Search & Autocode tool and Autocode with dictionary tool. These tools allow you to explore large amounts of text without reading or coding them first. Search for keywords (or dictionaries of keywords) and automatically code them with just a few clicks. In addition, you can perform a sentiment analysis of the survey responses that automatically evaluates whether the textual response is negative, neutral, or positive. The questionnaire responses can be sorted and filtered according to their sentiments. For further analysis you can automatically code the responses with their respective sentiment. Tools and functions like this facilitate your questionnaire analysis.
Managing and analyzing variables
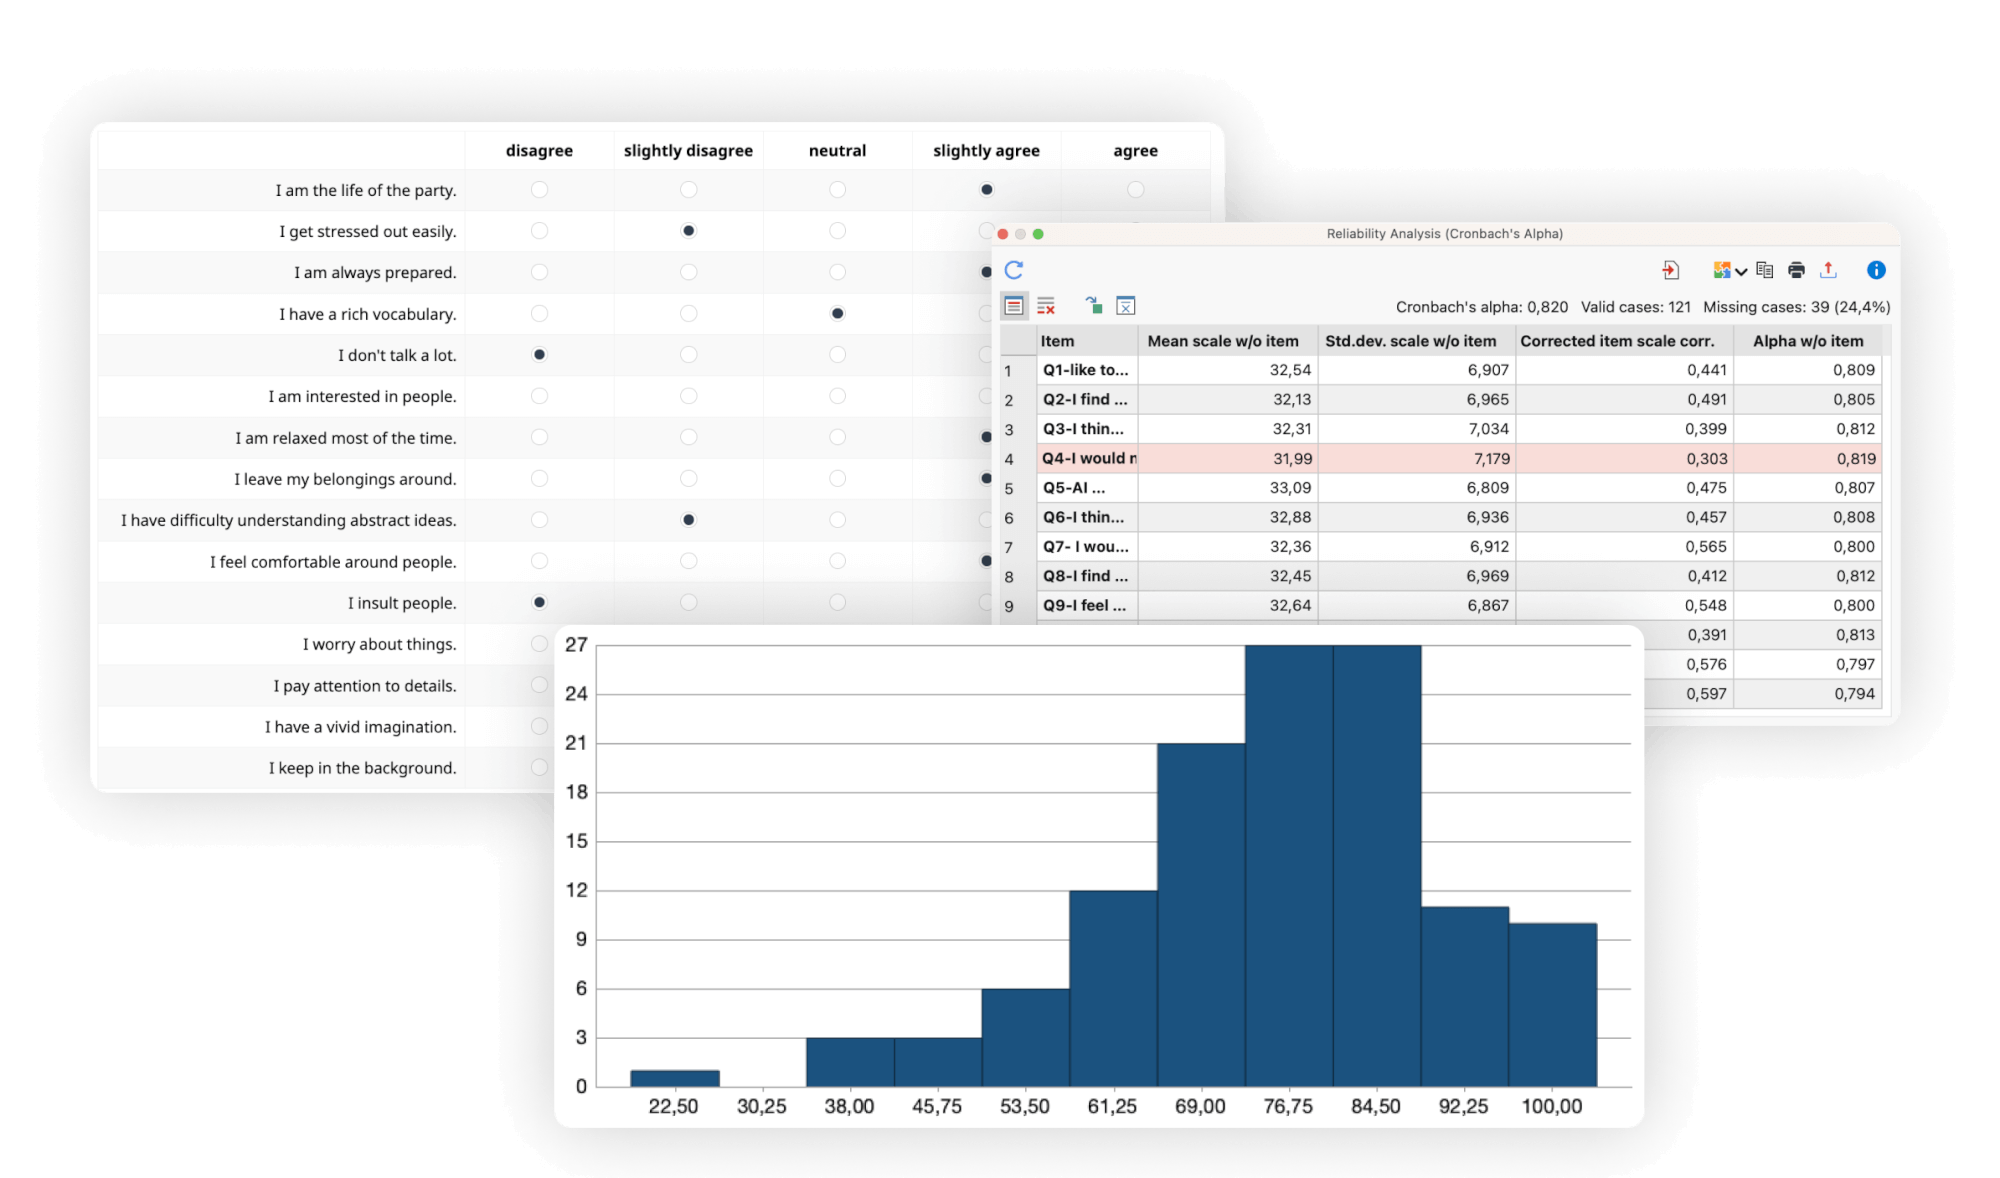
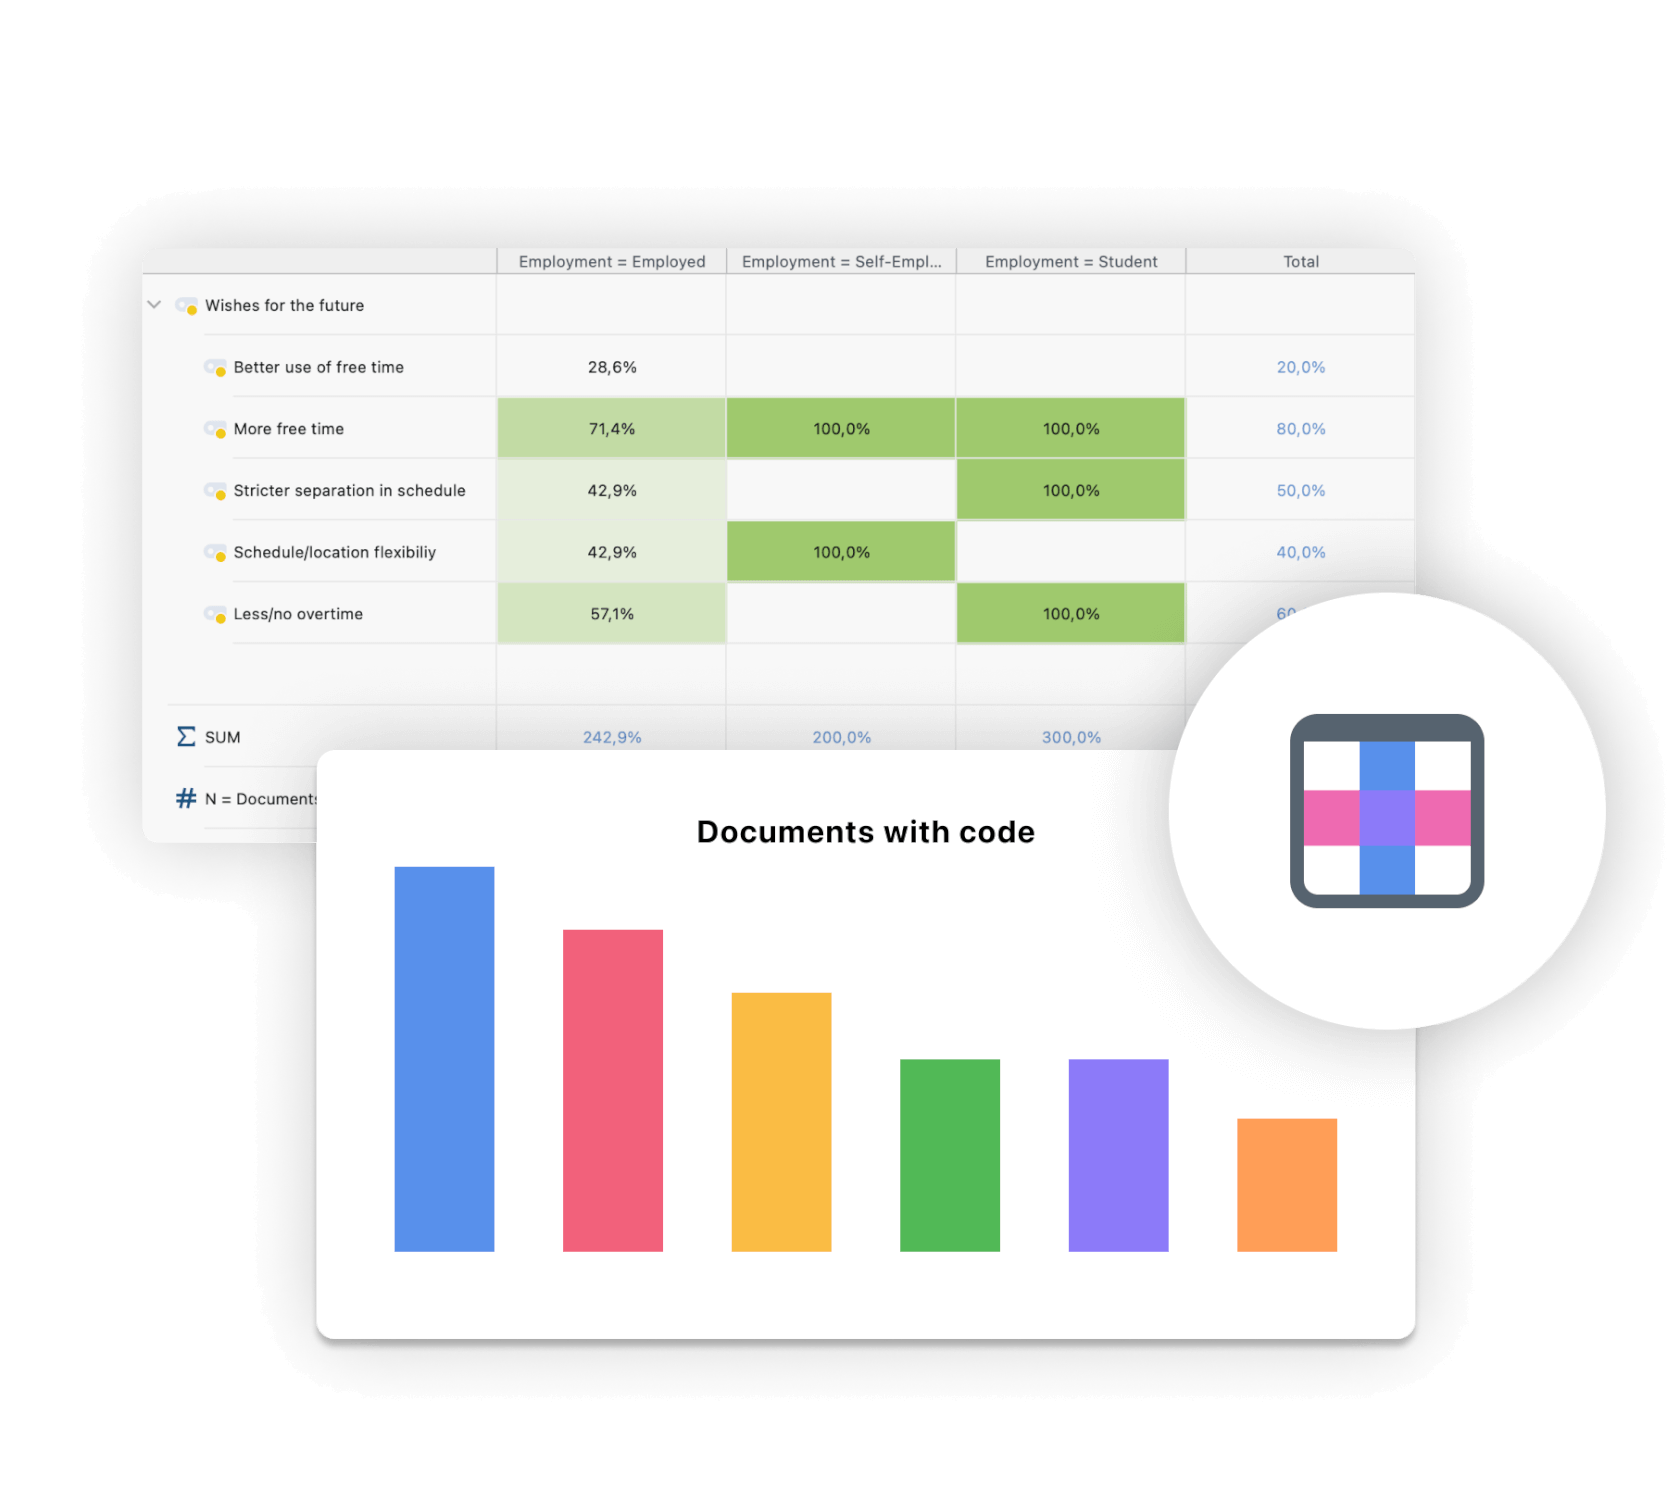
To find the questions you imported as document variables go to the Variables tab and click on List of Document variables. Here, you can freely define values that will be treated as missing values, whether a variable is categorical, and select favorite variables. In addition, you can change the variable type, for example transform a numerical variable into a text variable. You can analyze these variables statistically or use them to define groups for comparing the textual responses between them. Besides document variables, MAXQDA includes Code variables such as the number of coded segments or the percentage of text segments coded with the respective code. Like document variables, you can use code variables for statistical comparisons.
With MAXQDA’s Document variable statistics and Code variable statistics tool, you can easily create frequency tables and charts for variables with just a few clicks. Customize the chart to your needs by adjusting colors, the header, and the labels, and choose whether absolute values and/or percentages should be displayed in the chart.
Statistical analysis
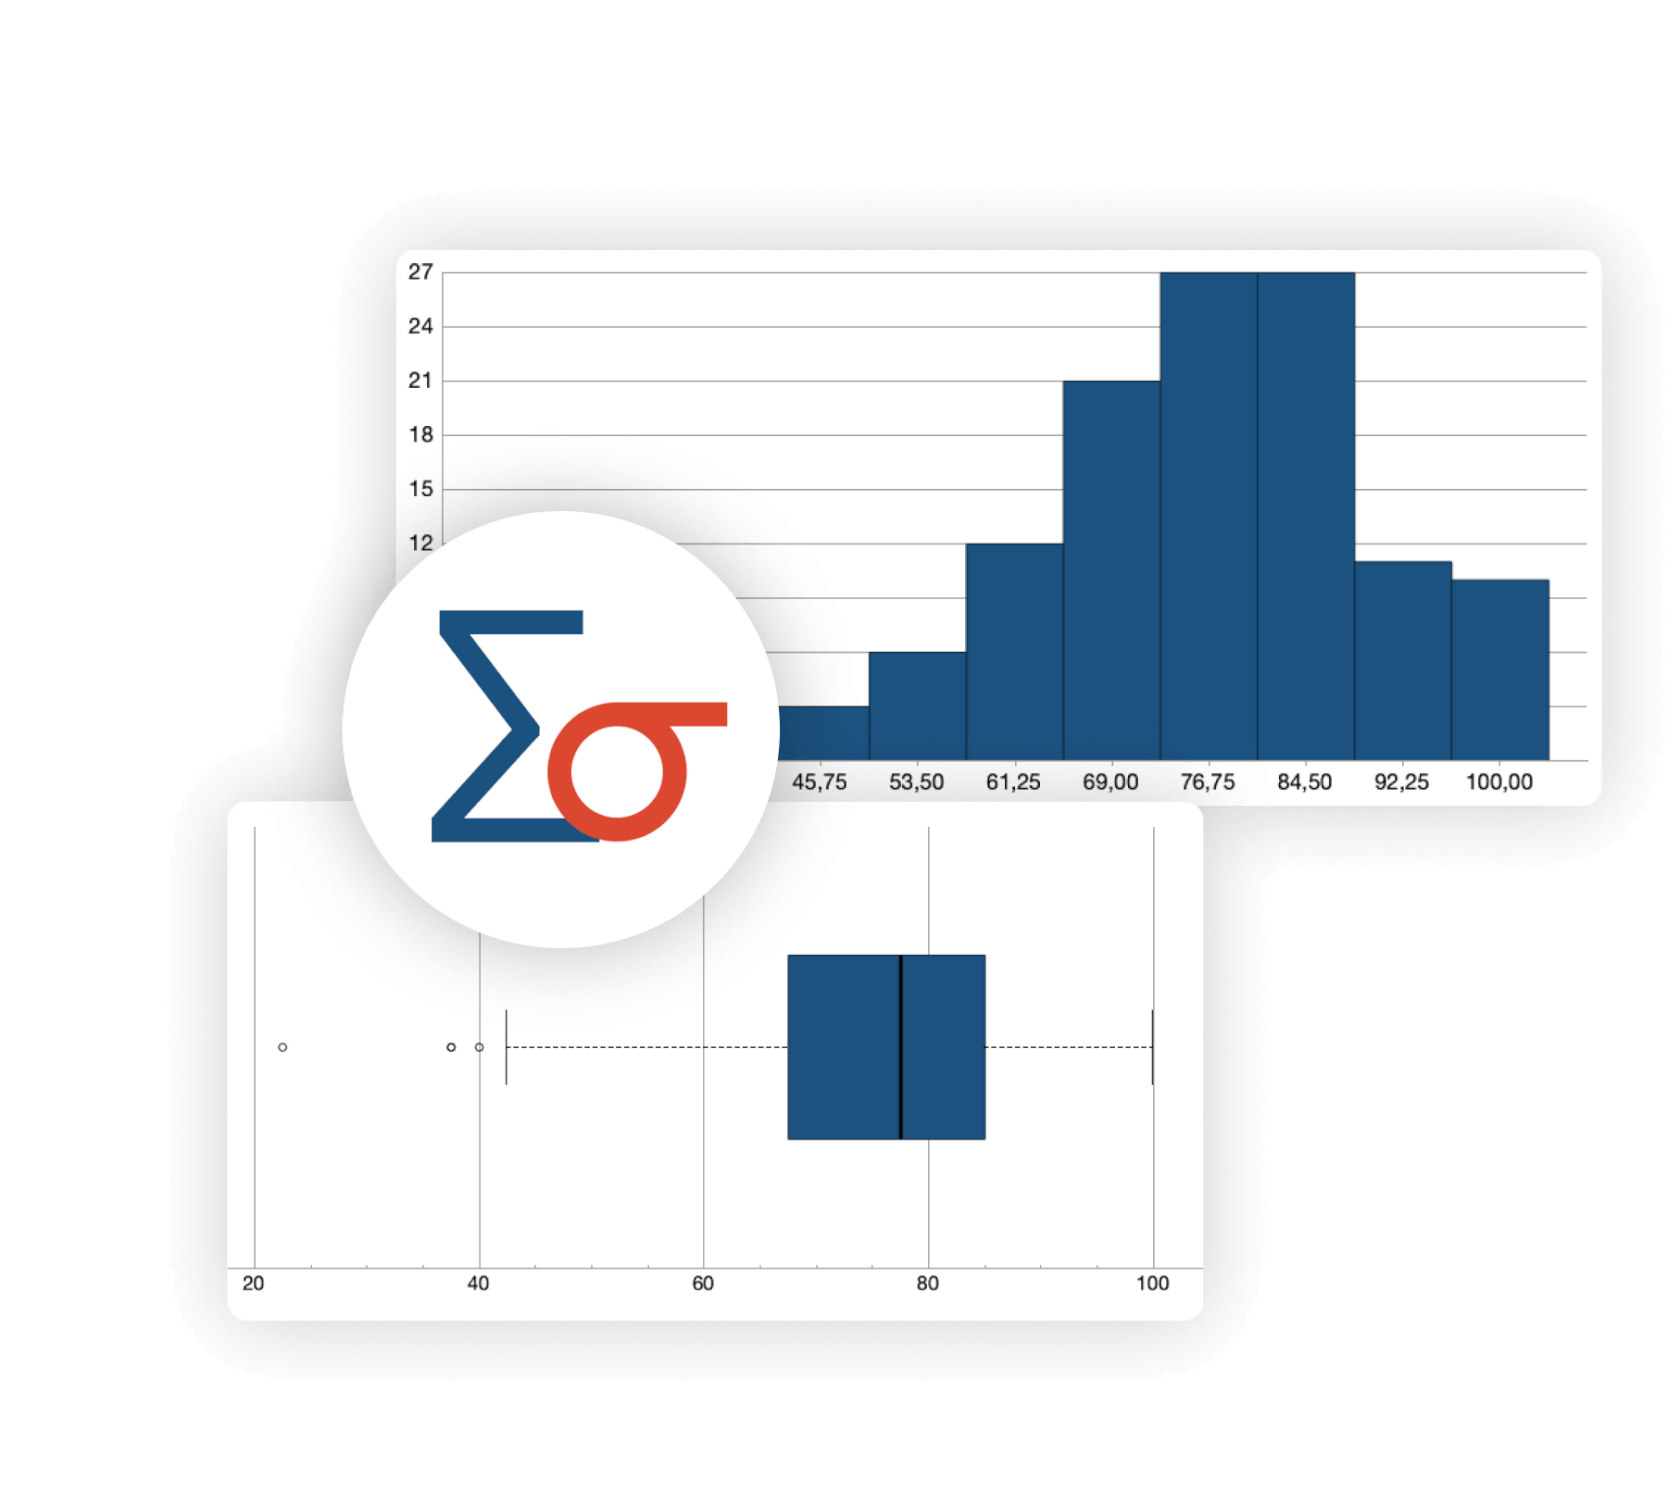
MAXQDA Analytics Pro adds the Stats module with which you can perform statistical analyses of your questionnaire responses. Seamlessly quantify your qualitative data and enrich your analysis with evidence and plausibility. Among other statistical procedures, you can calculate descriptive statistics of your variables or codes, compare groups via inferential statistics such as t-test, ANOVA, or discover correlations. In addition, the stats module includes tools for analyzing multiple responses and matrix questions. This feature enables you to compare results across subgroups using crosstabs and grouped bar charts. You can also perform cluster analyses. Test different numbers of clusters, view results in updated Typology Tables, and visualize cluster distances in a line chart.

Visualize your results
The proverb “a picture is worth a thousand words” also applies to questionnaire analyses. That is why MAXQDA offers a variety of Visual Tools that allow you to get a quick overview of the data, and help you to identify patterns. Of course, you can export your visualizations in various formats to enrich your final report. Particularly useful for questionnaire analysis are the Code Relations Browser which pairs of categories often appear together and the Code Map. The Code Map shows the relationships between codes in a map-like display. The more frequently two codes have been assigned together, the closer they will be on the map, forming a cluster. These clusters can be stores as variables.

QTT: Synthesize your results and write up the review
MAXQDA has an innovative workspace to gather important visualization, notes, segments, and other analytics results. The perfect tool to organize your thoughts and data. Create a separate worksheet for your topics and research questions, fill it with associated analysis elements from MAXQDA, and add your conclusions, theories, and insights as you go. For example, you can add Word Clouds, important coded segments, and your literature summaries and write down your insights. Subsequently, you can view all analysis elements and insights to write your final conclusion. The Questions-Themes-Theories tool is perfectly suited to help you finalize your literature review reports. With just one click you can export your worksheet and use it as a starting point for your literature review report.
Literature about Questionnaire Analysis with MAXQDA
We offer a variety of free learning materials to help you get started with your questionnaire analysis. Check out our Getting Started Guide to get a quick overview of MAXQDA and step-by-step instructions on setting up your software and creating your first project with your brand new QDA software. In addition, the free guide Analyzing Open-Ended Survey Questions with MAXQDA describes a procedure for analyzing responses to open survey questions and shows how to interlink this qualitative data with the standardized, quantitative data in the sense of a mixed methods approach.

Getting Started with MAXQDA
Get the guide
Analyzing Open-Ended Survey Questions with MAXQDA
Get the guide