A Summary Table is an overview table of summaries and document variables for selected documents and codes. It serves as a compilation of the summaries for selected topics. Summary Tables are a useful tool for case-based and cross-case analyses, as well for presentations and publications.
To create Summary Tables and to view those that you have already created, click the ![]() Summary Table icon on either
Summary Table icon on either
- the Analysis menu tab of MAXQDA or
- the Start menu tab of the Summary Grid window.
This will open the Summary Tables window:
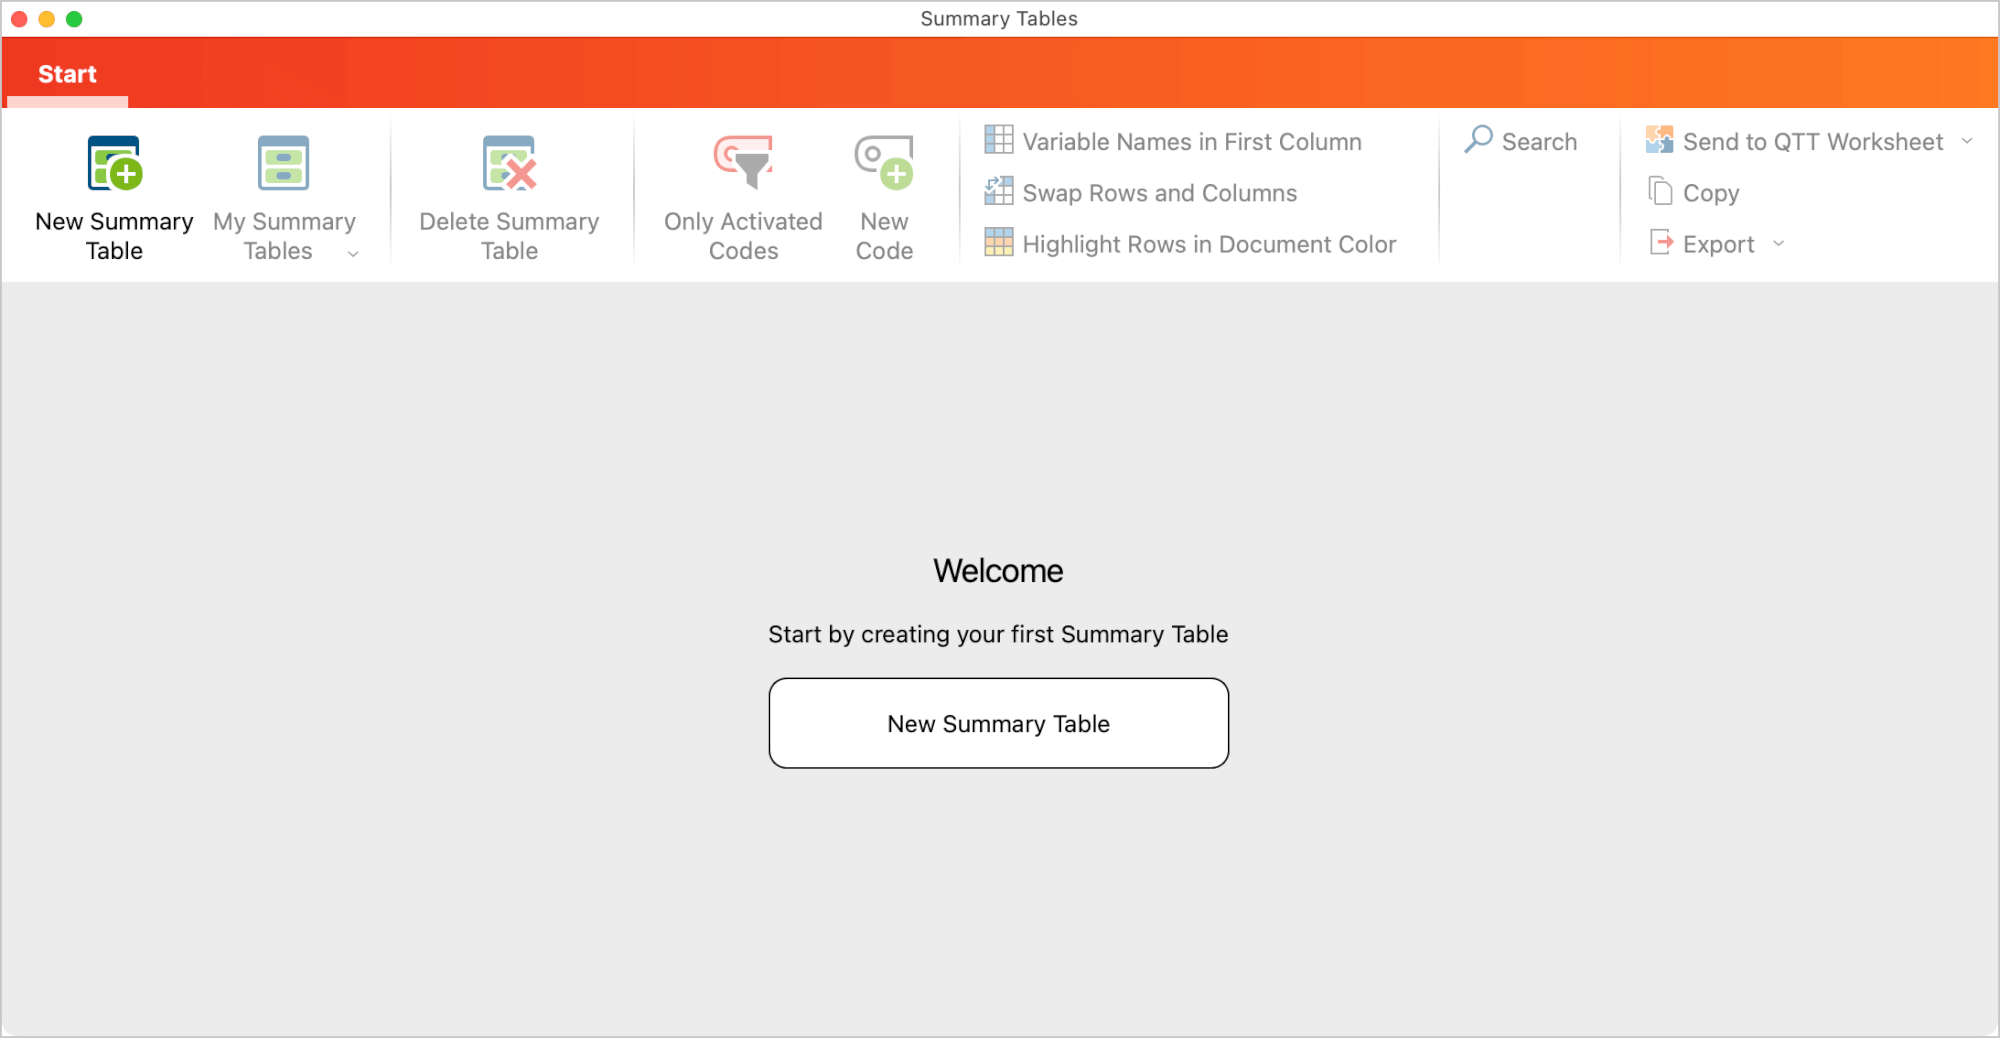
To create your first Summary Table, click the button in the middle of the window. If you already have created a Summary Table, you can click the button ![]() in the toolbar. A dialog window will appear:
in the toolbar. A dialog window will appear:
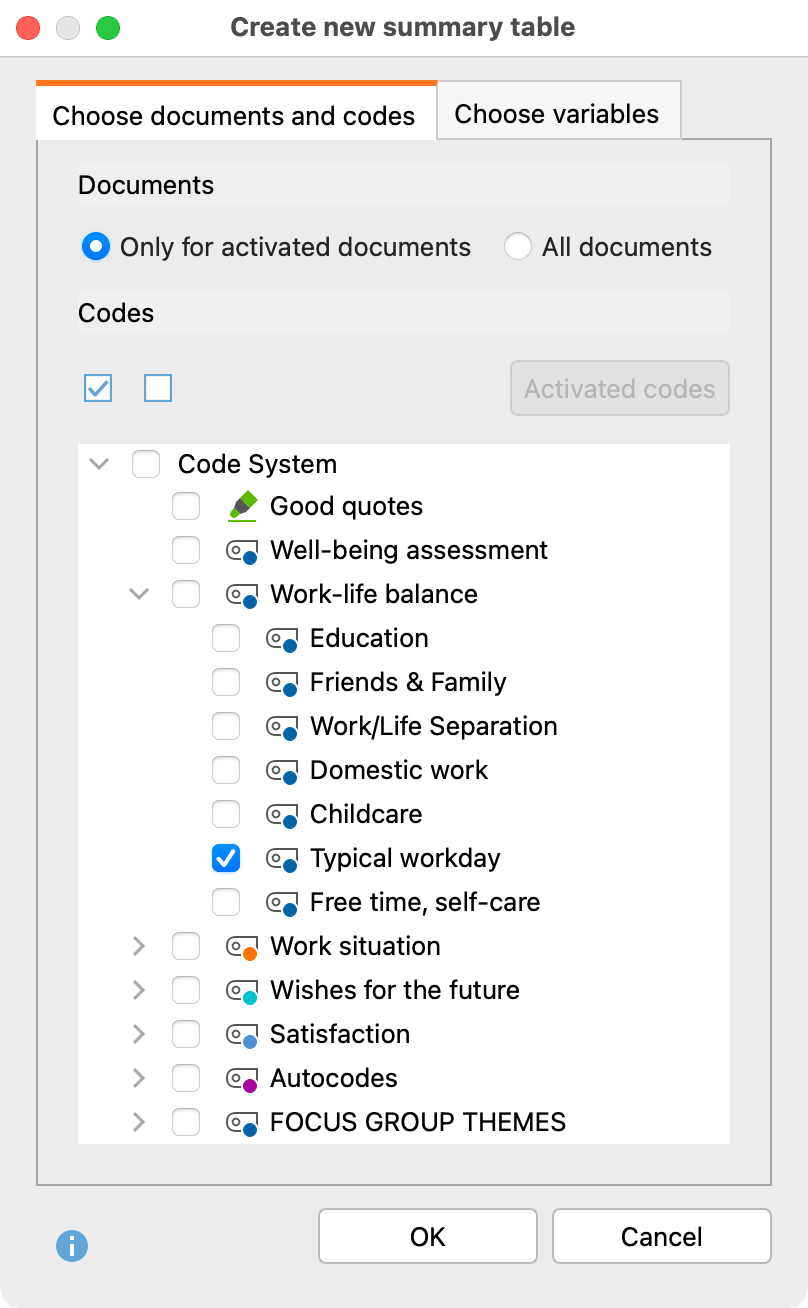
- Using the tab “Choose documents and codes”, you must decide whether to include all documents or only activated documents. Usually, before creating a new table, you will activate the documents for which you have written summaries.
- On the same tab, you must codes to be included in the Summary Table. Usually, you will only select codes for which you have written summaries.
- Using the tab “Choose variables”, you can optionally choose which document variables should be output as supplementary information. All variables that are placed in the “Variables for first column” pane will appear in the first column with the document name. All variables that are placed in the “Variables in own column” pane will appear in additional columns next to the codes.
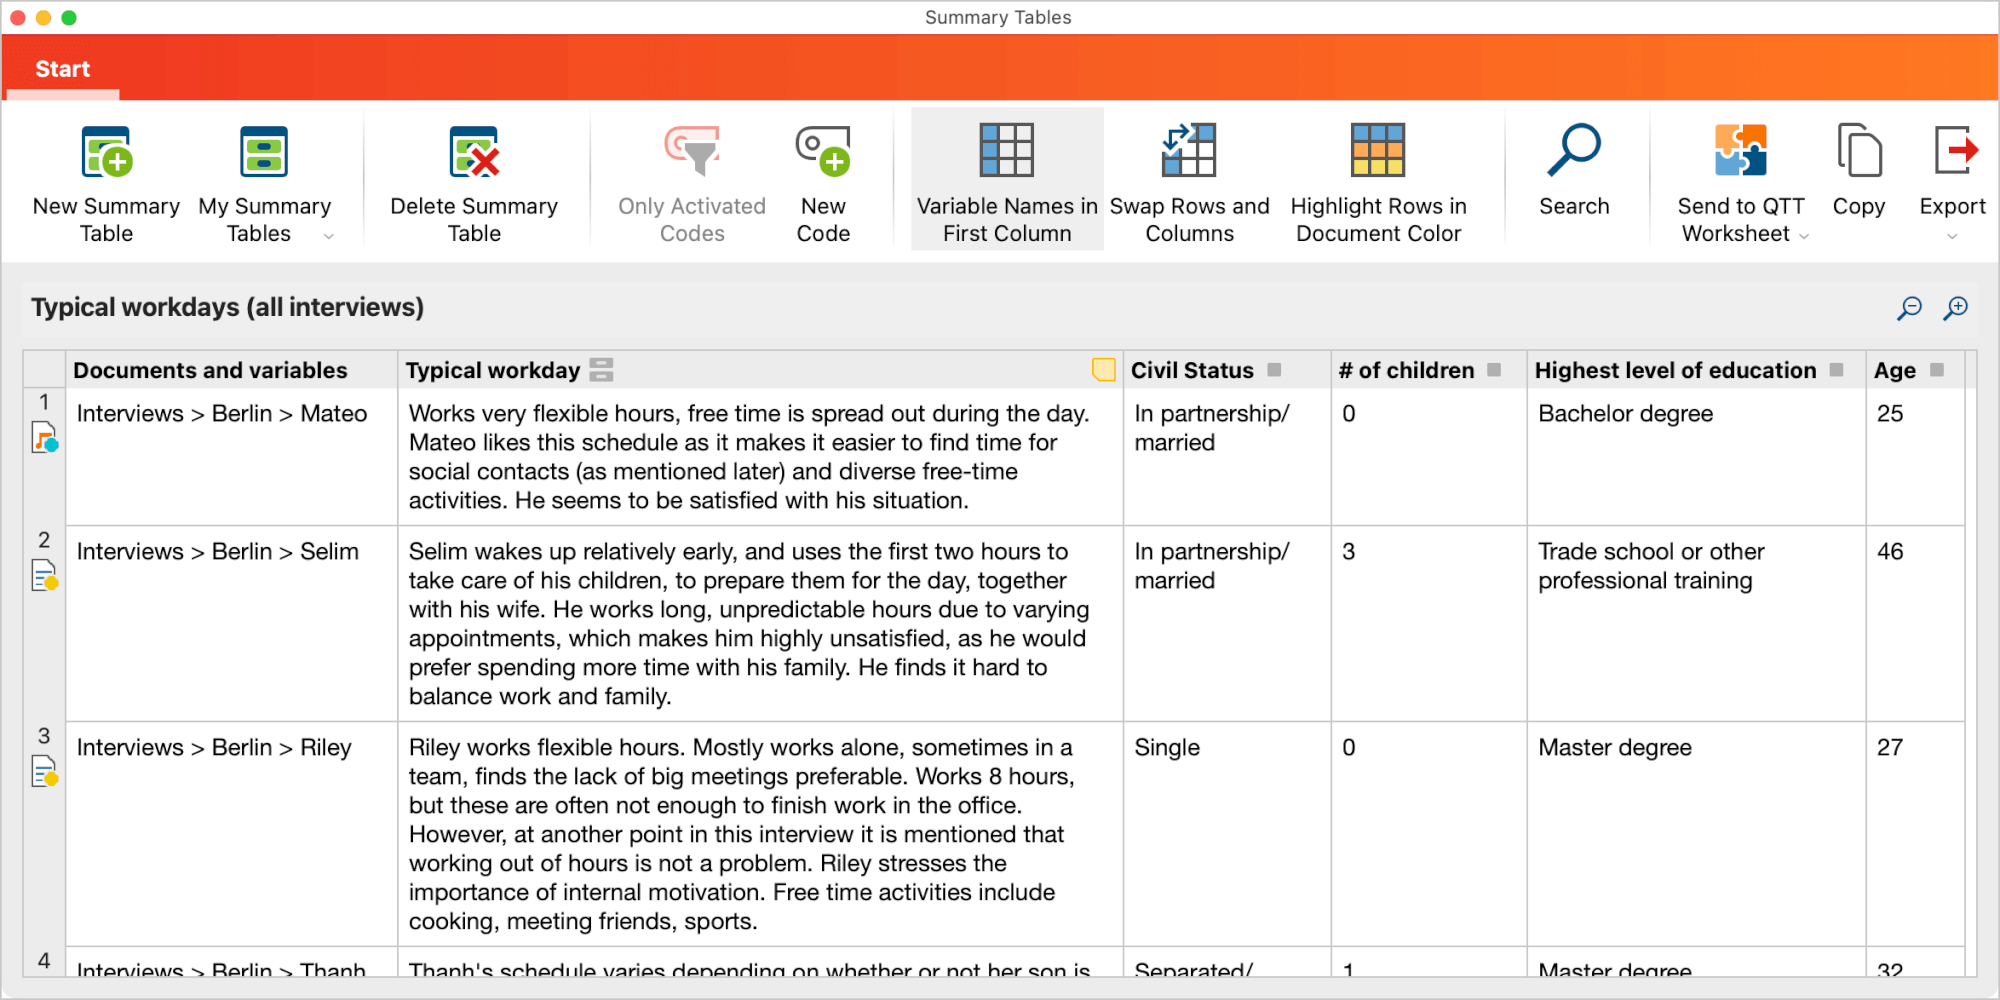
By clicking OK, the table with the selected documents, codes, and variables will be created:

The selected documents form the rows of the Summary Table and the selected codes form the columns. In the code columns, the summaries for the selected codes are listed for each document. The first column indicates the respective document by presenting its document group and document name.
If you have selected document variables for the first column, their variable values are displayed underneath each document name. If you have selected variables to be displayed in own columns, additional columns will be added to the table using the variable name as the column header. You can click on such a column head to easily sort the table by the variable values.
Additionally to sorting the table by clicking on a column header, you can use the following functions to adjust the view of the table:
- You can change the order of columns by clicking and dragging with the mouse.
- You can hide or display columns (right-click on the column header and choose Select columns).
- You can order columns alphabetically by clicking on a column header.
The table is in plain text format, so the entire table is formatted with the same font.
Retrieving the Coded Segments Associated with a Summary
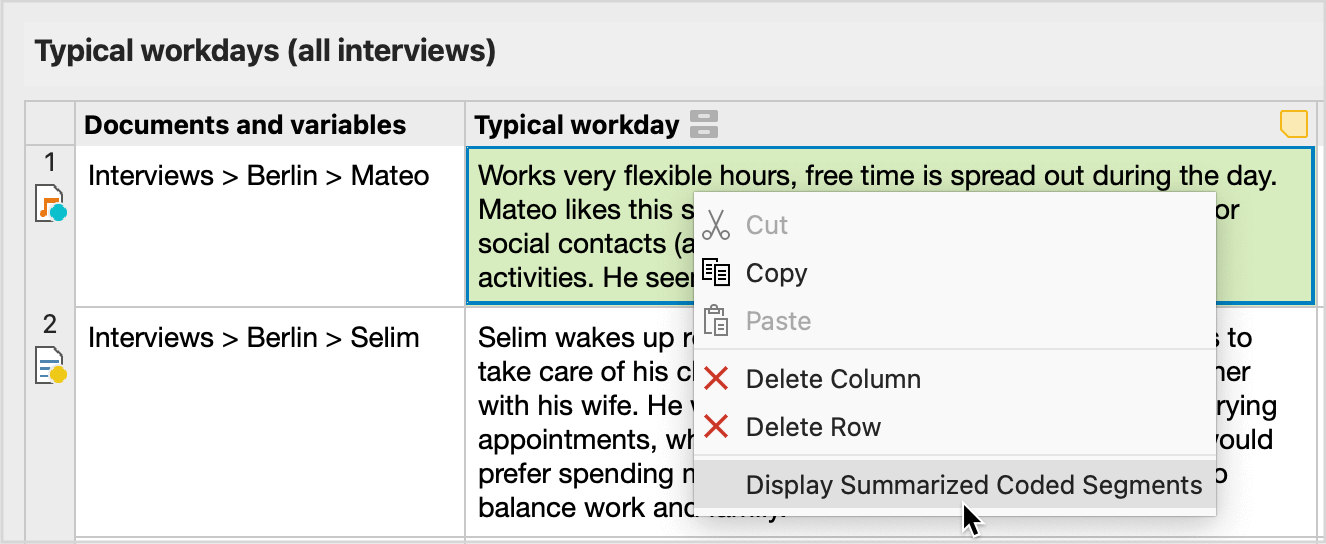
Each cell of the Summary Table is connected to the summarized coded segments. These can be retrieved as a list by right-clicking in the cell of the Summary Table and choosing Display Summarized Coded Segments.
Display coded segments instead of summaries
You can display the underlying summarized coded segments for a code instead of the self-written summaries, for example, because the coded segments are very short and they should be integrated in the table directly. To do this, right-click on the column header and select the Display Coded Segments option. Please note that it is not necessary that you have written summaries for a code to use this option. That is, when creating the table, you can also select codes for which no summaries exist and then switch the corresponding column in the Summary table to show the coded segment instead of empty cells.
You can switch back to view the summaries at any time by clicking the column header again and this time selecting Display Summaries.
The next time you open the MAXQDA project, the summaries (not the coded segments) will be displayed for all code columns.
Highlight documents according to their color
If you select the Highlight Rows in Document Color option in the Start menu tab, the rows will be highlighted according to the assigned document color. This function is very useful for grouping cases, for example, in the context of creating typologies: you read the content of each row, compare it with the other rows, and give the row a corresponding color to assign it to a newly formed or existing group. The colored background then makes it easy to recognize cases that belong together. In the simplest case, two colors are used, for example, red for ‘negative’ or ‘low’ and green for ‘positive’ or ‘high’.
To change the color of a document, that is, the background color of a row, right-click in the first column on the respective document icon:
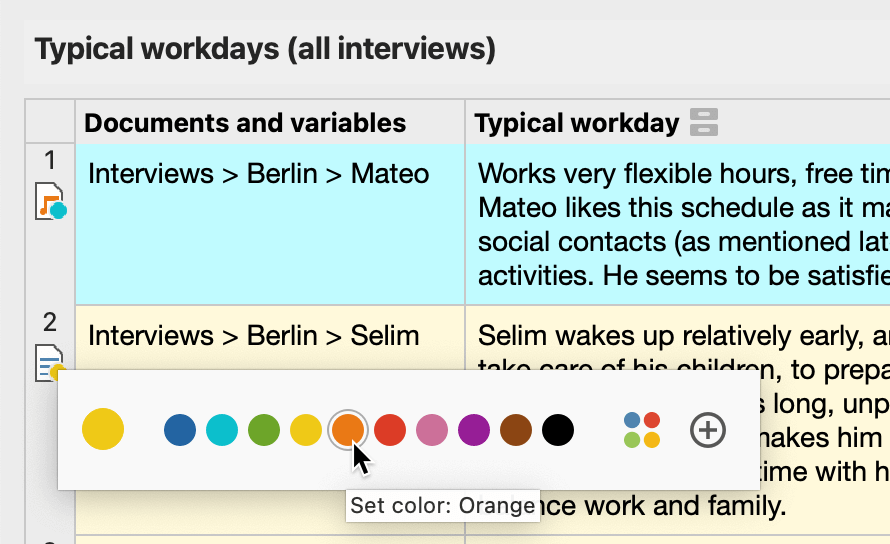
If you change the color of a document in a Summary Table, the document color in the "Document System" will also be changed – and vice versa.
Saving the Summaries in a Column as a New Document Variable
Let’s say one column of your Summary Table contains short and similar summaries for a topic in an interview study. This analytic work can be used as a document variable in MAXQDA, for example, to activate interviewees for whom you have written the same summary: right-click on the column heading and choose Transform into Document Variable. MAXQDA will create a new document variable that contains the summaries as values and that will be named as the column. If the variable already exists, MAXQDA will add a number to the name. Please note that the values will be shortened to 63 characters. The column in the Summary Table remains.
Adding an Empty Column for Additional Summaries
Let’s assume when working with an existing Summary Table you would like to add a new column in which you would like to write integrative summaries (as described, for example, in Kuckartz & Rädiker, 2019, pp. 147). For this purpose, it is necessary to add another code to the "Code System", which will then serve as a "container" for the integrating summaries. Click on New Code in the Start menu tab to create a new code and add it directly to the currently displayed summary table as a new column for additional summaries.
Swap Rows and Columns of a Summary Table
You can use the icon Swap Rows and Column in the menu tab of the Summary Table to rotate the view by 90°, which means you swap the rows and the columns for display. The documents will be displayed in the columns then and the codes (and the variables with their own column) in the rows.
Open a Summary Table
To open an existing Summary Table, click on My Summary Tables on the menu tab and select a table.
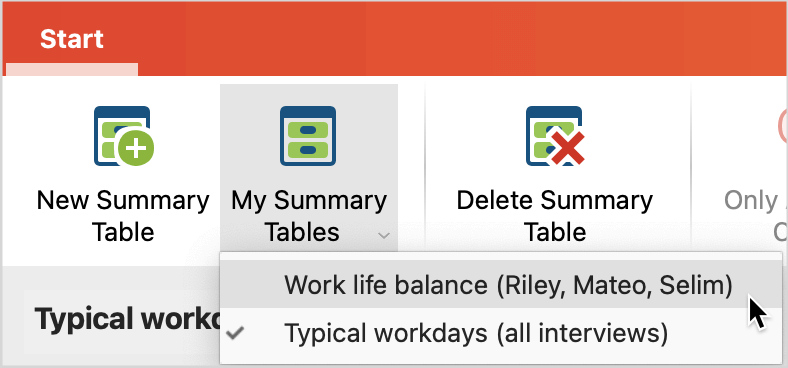
Rename a Summary Table
To rename the displayed Summary Table, click on the name displayed above the table on the left:
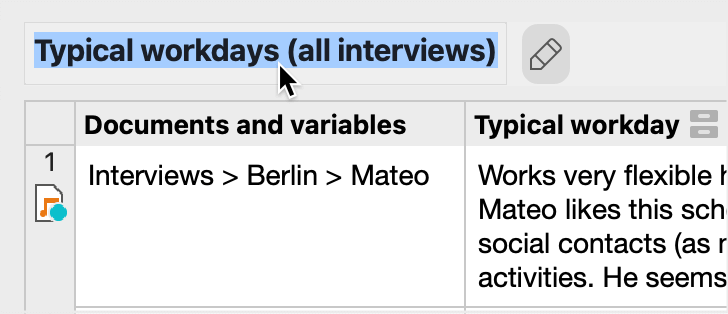
Delete a Summary Table
To delete the displayed summary table, click Delete Summary in the menu tab. This operation cannot be undone. Deleting a table does not affect its contents, that is, the summaries and variable values are still present in the project and the table can be recreated if required.
Store Summary Table in a QTT Worksheet
To delete the displayed summary table, click Delete Summary in the menu tab. This operation cannot be undone. Deleting a table does not affect its contents, that is, the summaries and variable values are still present in the project and the table can be recreated if required.
Insert Summary Table as a Table Document in the “Document System”
The displayed Summary Table can be stored as a table document so that you can then analyze its contents with all the available MAXQDA functions. To do this, click on Export in the menu tab at the top right and select the option ![]() Insert Summary Table as Table Document into Document System.
Insert Summary Table as Table Document into Document System.
Export Summary Table
The displayed summary table can be exported as a Word document or Excel table. To do this, click on Export in the menu tab at the top right and then select the corresponding entry.
