Guide: Analyzing Open-Ended Survey Questions with MAXQDA
This guide describes a procedure for analyzing responses to open survey questions with MAXQDA. The procedure does not consider the open-ended questions in isolation from the other data collected, but rather interlinks this qualitative data with the standardized, quantitative data in the sense of a mixed methods approach.
How does MAXQDA help you categorize survey responses?
MAXQDA helps you analyze responses to open questions in surveys efficiently and effectively with its interactive table window. The responses are listed in a table and can be categorized with existing or newly developed codes
A prerequisite for using this function is that all the responses to a question have been coded with one code. This should be the case if you used the Survey Data Import function to import your survey responses. The name of the code will normally correspond to the text or a shortened version of the survey question.
Starting the Function
MAXQDA’s interactive interface lets you analyze each of your survey questions, one after the other:
- In case you want to analyze only a selection of responses of individual interviewees, activate these documents.
- Click on the following function in the ribbon menu bar: Analysis > Categorize Survey Data
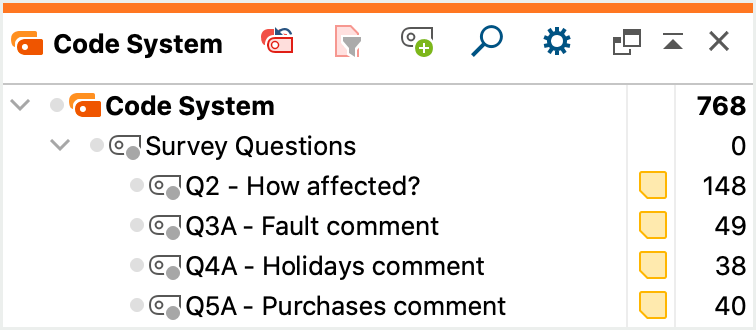
- Drag the code that contains the responses to your survey question from the “Code System” window to the following dialog box that appears:
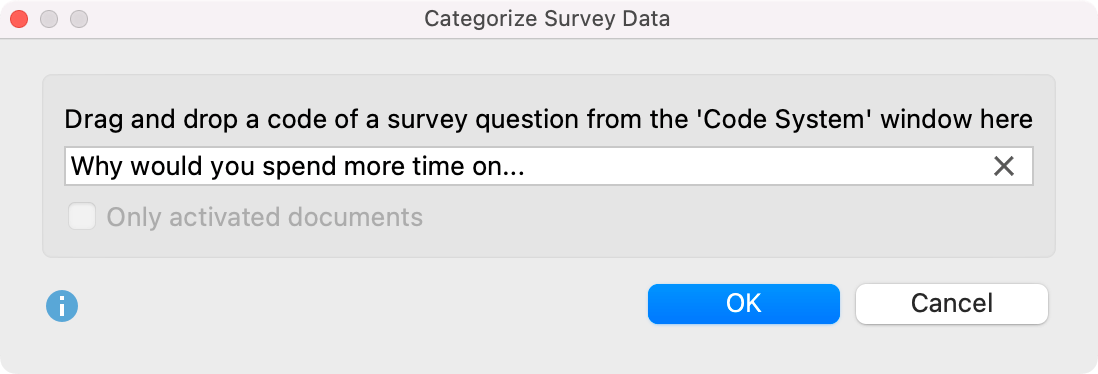
- If you activated a selection of documents, you can use the Only activated documents option to restrict the analysis view to these documents (you can turn the filter of activated documents on or off at any time later).
Click on OK and the interactive table window will appear, divided into two sections:
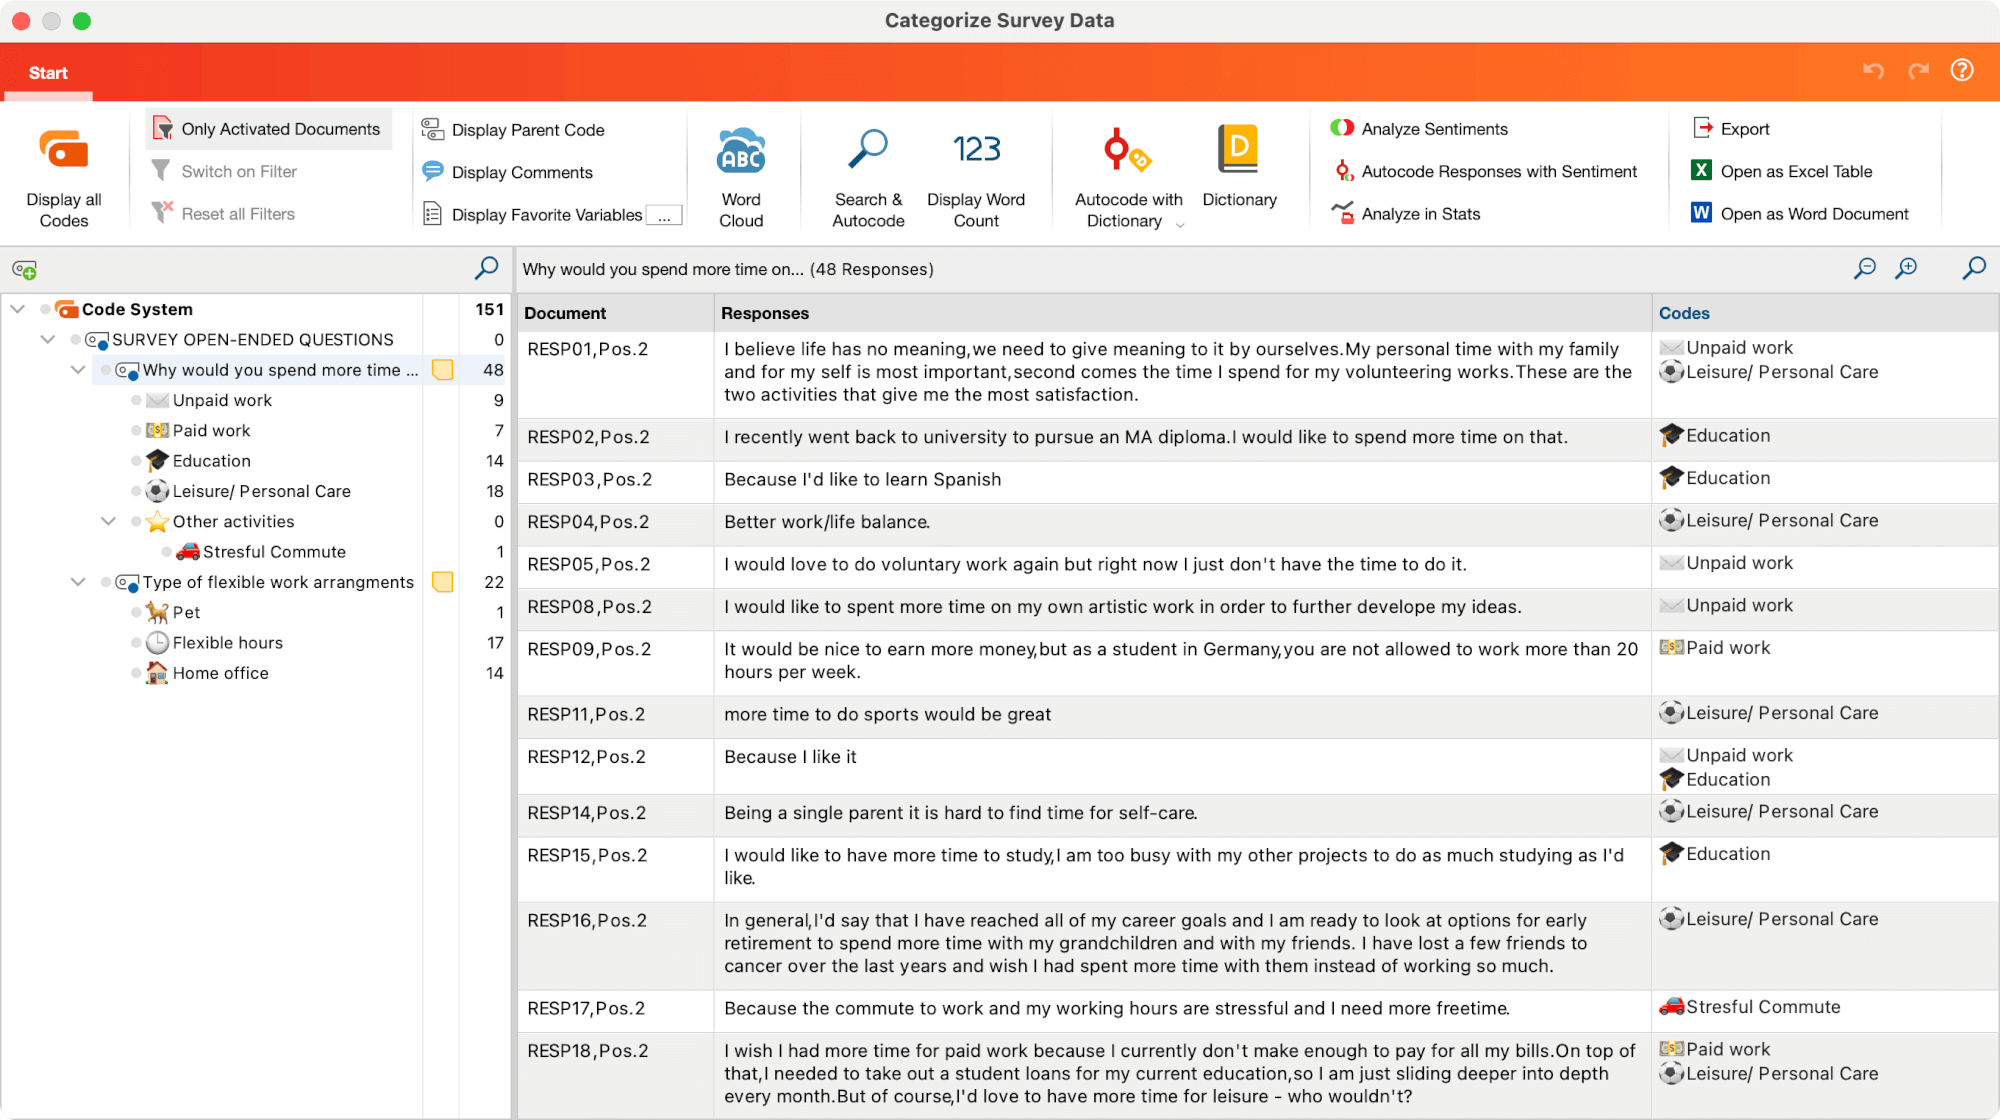
In the leftmost field of the window, you will see a reduced code system that displays the selected question code. New categories can be inserted here as subcodes and then assigned to the individual answers. The number at the end of the code line tells you how often the code was assigned to the documents you are currently analyzing.
In the table to the right, you see a list of the responses – each in a separate line. The number of currently displayed lines, i.e. the responses to be categorized, is indicated in the header above the table.
The individual columns contain the following information:
Document – The source of the response.
Responses – The texts of responses of people who answered your survey.
Codes – A list of the codes assigned to the response or part of the response; only the codes that are currently visible in the code system on the far left are listed here. The question codes, whose answers are currently being analyzed, are never shown here.
Comments (initially hidden) – Freely editable text field (up to 255 characters) for notes: useful for the developing suitable categories.
Like all MAXQDA table widows, the individual fields can be adjusted: The columns can be adjusted in width and position with the mouse or hidden with a right-click on a column heading. A click on the heading sorts the column in ascending order, another click in descending order.
Functions in the Ribbon Menu
At the top, you will see a ribbon menu with the following functions:
![]() Display all Codes – displays all your project’s codes. When turned off, only the selected codes and subcodes are displayed.
Display all Codes – displays all your project’s codes. When turned off, only the selected codes and subcodes are displayed.
![]() Only Activated Documents– Only the answers of the currently activated documents are displayed. The frequencies displayed in the code tree are adjusted accordingly.
Only Activated Documents– Only the answers of the currently activated documents are displayed. The frequencies displayed in the code tree are adjusted accordingly.
![]() Filter – applies filters, which are defined by right-clicking on a column heading and selecting the Set Filter, to all columns.
Filter – applies filters, which are defined by right-clicking on a column heading and selecting the Set Filter, to all columns.
![]() Reset all Filters – removes all filters from all columns.
Reset all Filters – removes all filters from all columns.
![]() Display Parent Code – in addition to the code, the "Codes" column also displays its parent code.
Display Parent Code – in addition to the code, the "Codes" column also displays its parent code.
![]() Display Comments – displays comments field.
Display Comments – displays comments field.
![]() Display Favorite Variables – shows another column for each favorite variable. For example, you can display the age of a person or other background information about a case. You can set favorite variables via selecting Variables > List of Document Variables in the ribbon of MAXQDA’s main window.
Display Favorite Variables – shows another column for each favorite variable. For example, you can display the age of a person or other background information about a case. You can set favorite variables via selecting Variables > List of Document Variables in the ribbon of MAXQDA’s main window.
![]() Word Cloud – opens the word cloud for the survey responses.
Word Cloud – opens the word cloud for the survey responses.
![]() Search and Autocode – opens the text search.
Search and Autocode – opens the text search.
![]() Display Word Count – creates a new column that contains the length of the answer.
Display Word Count – creates a new column that contains the length of the answer.
![]() Autocode with Dictionary – opens a menu for choosing the autocoding context.
Autocode with Dictionary – opens a menu for choosing the autocoding context.
![]() Dictionary – opens the window to create and edit dictionaries.
Dictionary – opens the window to create and edit dictionaries.
![]() Analyze Sentiments – starts the sentiment analysis for survey responses.
Analyze Sentiments – starts the sentiment analysis for survey responses.
![]() Autocode Responses with Sentiment – allows to autocode the responses with the calculated sentiment.
Autocode Responses with Sentiment – allows to autocode the responses with the calculated sentiment.
At the top right of the window there are two icons for the local undo function:
![]() Undo – undoes the last action in the window.
Undo – undoes the last action in the window.
![]() Redo – redoes the last action in the window.
Redo – redoes the last action in the window.
Creating New Categories
In order to categorize individual responses, you first need some categories, of course! If you have already defined some or all of these categories before you begin your analysis, you can define them as new subcodes of your question code.
- Click on the green plus symbol that appears while hovering over an existing code.

- In the dialog window that appears, enter the code name. To better distinguish between different sub-codes, you can use different colors. You can also enter the description of the new code (i.e., which responses they are applied to) into the “Code memo” field..
- Click Additional code to create a second and third code, and so on. Click OK to finish creating new codes.
If at the beginning of the analysis, you haven’t defined any categories and you would rather develop these from the data, you can start by reading some of the responses and then create suitable subcodes.
Assigning Categories
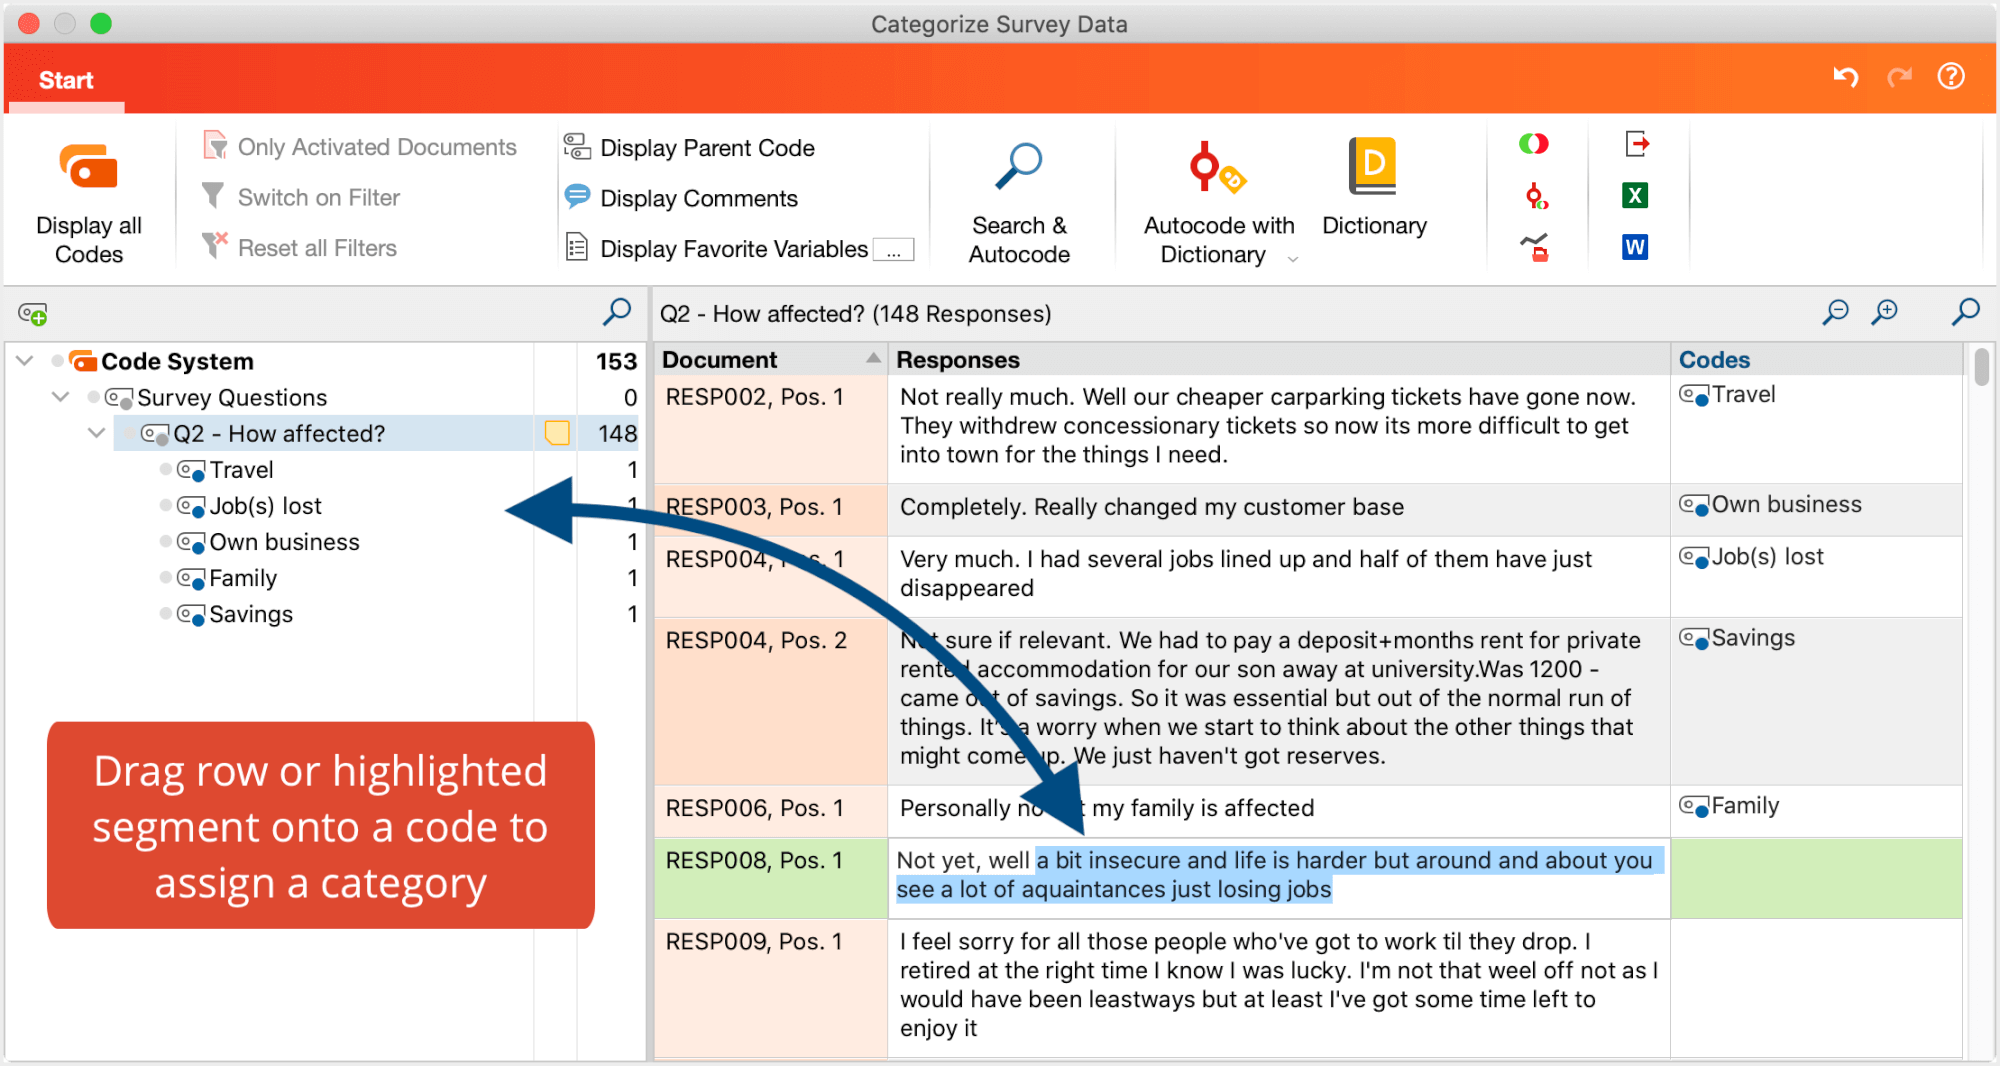
To assign a response to a code, click and drag the row with that response to one of the displayed codes in the hierarchical code tree. This allocation is immediately displayed in the “Codes” column. To assign a code to only part of a response, double-click on the text of the response, select the desired portion of text, and drag it to one of the codes in the code system. Even if you add the same code to multiple sections of a response, the code name is listed only once in the “Codes” column.
Removing assigned categories
To remove a code assigned to a response, click the cross that appears when you move the mouse over a code in the “Codes” column. All assignments of the code will then be removed from the response.

Customizing Your Category System
You can adapt your category system throughout the entire analysis process. You can change the order of codes with the mouse as well as add subcodes. By right-clicking on a code, all the features from your “Code System” are available to customize your code system in this window:
- Delete code
- Sort subcodes (alphabetically or by category frequency)
- Change code color
- Create or edit code-memo
- Copy, move, paste coded segments
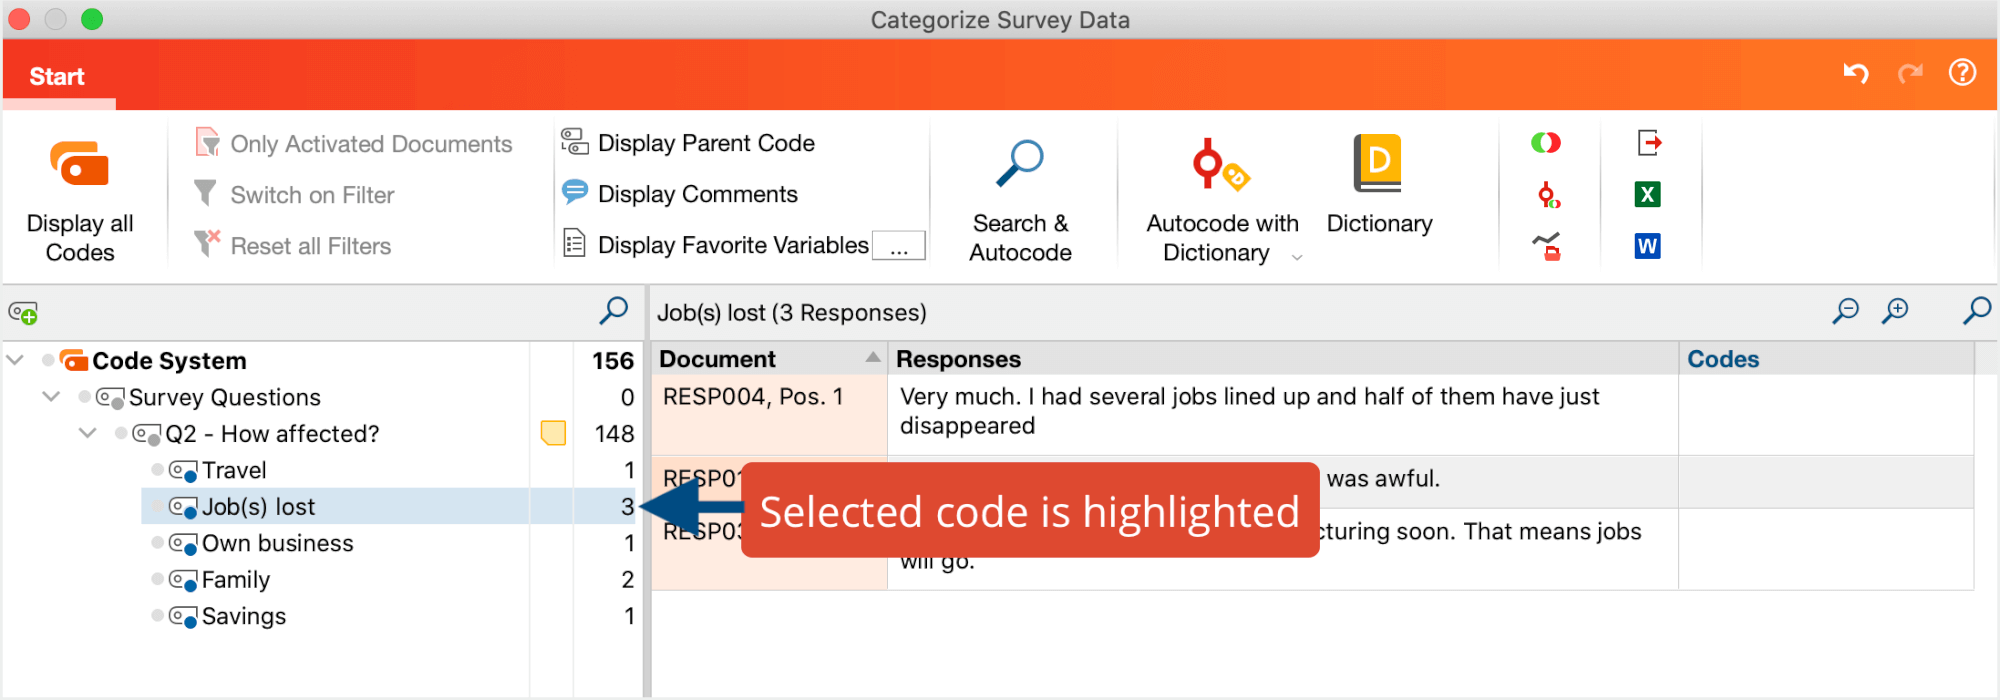
Click on a code in the code tree to list all your coded segments under this category (the categorized answers to the survey question or parts of it). This way, you have an overview of the contents of individual categories. The highlighted row in the left code system indicates which code is currently selected. The name of the selected code is also displayed in the heading of the listed responses.
Working with Comments
In the comments column, you can write a comment regarding each response. During the process of category development, comments can be used to summarize long responses and to record ideas for new categories for appropriate categories for a specific response. They are also suitable for notes such as “still unclear” or “come back to this later” for responses that are hard to categorize.
Double-click a cell in the "Comments" column to enter a new comment or edit an existing one.
Comments are stored for the code selected in the “Code System”.

Pausing and Restarting the Categorization Process
You can pause your current categorization at any time by clicking on the button Quit or by closing the window. All your categorizations will be stored as codes in your MAXQDA project.
To pick up where you left off, restart the function via Analysis > Categorize Survey Responses and select the code that contains the responses to your survey question.
Exporting Responses
The current view can be exported using the typical icons in the ribbon menu. All responses of the right pane will be exported.
![]() Export – Creates a table as an Excel file (XLSX format), as a web page (HTML format), or as a text document (Word or RTF format).
Export – Creates a table as an Excel file (XLSX format), as a web page (HTML format), or as a text document (Word or RTF format).
![]() Open as Word document – Creates a Word document and opens it.
Open as Word document – Creates a Word document and opens it.
![]() Open as Excel spreadsheet – Creates an Excel document and opens it.
Open as Excel spreadsheet – Creates an Excel document and opens it.

