Are you about to embark on an Action Research journey? Are you looking for ways to harness the power of qualitative data analysis with MAXQDA to drive meaningful change? If so, look no further! In this guide, we explore key MAXQDA features tailored for Action Research, paving the way for your research success.
What to expect in this guide
In this comprehensive guide, we provide practical insights into how MAXQDA can support your Action Research journey. We focus on four essential pillars of effective practice: Data Management, Analysis, Reflection, and Reporting, and show you the possible ways you can leverage MAXQDA's powerful features to strengthen each one.
The four pillars: A framework for success
- Pillar 1: Data management
Effectively organize and store your data. - Pillar 2: Analysis
Uncover patterns, themes, and insights in your data. - Pillar 3: Reflection
Systematically reflect on your practice and findings. - Pillar 4: Reporting
Effectively share your findings.
Let us start!
What is Action Research?
Action Research stands as a beacon of transformative inquiry, bridging research and real-world action. Rooted in collaboration, Action Research offers a dynamic and adaptable framework for addressing problems necessitating practical solutions while generating valuable insights and knowledge. These qualities make it a versatile method used in academia and business.
Conducting Action Research
Action Research is conducted continuously through observation, reflection, and action cycles. Researchers work closely with stakeholders to gather data, analyze it, and implement changes.
Although there is a variety of models researchers can choose from, with most of them being iterative, Action Research can be loosely broken down into five cyclical stages, making up one complete cycle.
The five cyclical stages of Action Research
- Stage 1: Diagnosing
To begin, researchers identify the problem or issue that needs to be addressed by gathering initial information, understanding the context, and setting research goals. - Stage 2: Studying and Planning
Then, investigators gather more in-depth data to understand the problem, pinpoint potential solutions, and develop a plan of action. - Stage 3: Collecting and Acting
With a solid plan in place, stakeholders along with researchers implement the plan, collect data on its effectiveness, and take corrective actions as needed to ensure successful outcomes. - Stage 4: Reflecting and Evaluating
Throughout the process, researchers analyze the data collected during the implementation phase, reflect on what worked well and what did not, and identify areas for improvement to inform future cycles of Action Research. - Stage 5: Sharing
Finally, researchers disseminate the findings, results, and lessons learned from the Action Research process to relevant parties, which can inform future initiatives and improve practice.
Action Research with MAXQDA
Action Research's iterative process requires careful planning, data collection, and analysis to ensure that your interventions are effective and sustainable. Therefore, QDA software such as MAXQDA come in particularly handy.
You can think of MAXQDA as your digital toolkit and reliable companion in your Action Research journey. MAXQDA is packed with features that provide the support you need to organize, analyze, and visualize your data effectively. For that reason, whether you are analyzing interview transcripts, focus group discussions, survey responses, or even your field notes, MAXQDA helps you turn raw data into actionable solutions.
This guide unravels how MAXQDA can streamline your research process, from data organization and coding to generating insightful reports and visualizations. We aim to introduce you to a selection of MAXQDA’s powerful functions to complement your Action Research endeavors.
Pillar 1: Data Management in Action Research
As an Action Researcher, you likely work with diverse data types, from literature review articles to collected data, in various formats. Proper data management is the cornerstore of effective practice as it sets the stage for future steps.
MAXQDA offers multiple ways to import files, making starting easy. However, in this section, we assume a basic knowledge of importing files and focus our discussion on organizing imported files with document groups to help you build a strong foundation for your analysis. We also show you how to use watched folders to combine importing and organizing files in groups for additional efficiency. Finally, we show you how to add variables to your documents and codes to enhance your data analysis.
Organizing your files with document groups
Once you have imported your files, organizing them into manageable sections is essential. MAXQDA's document groups are great for this. You can think of them as folders or categories that help you group your data for easier management and, later, units of analysis.
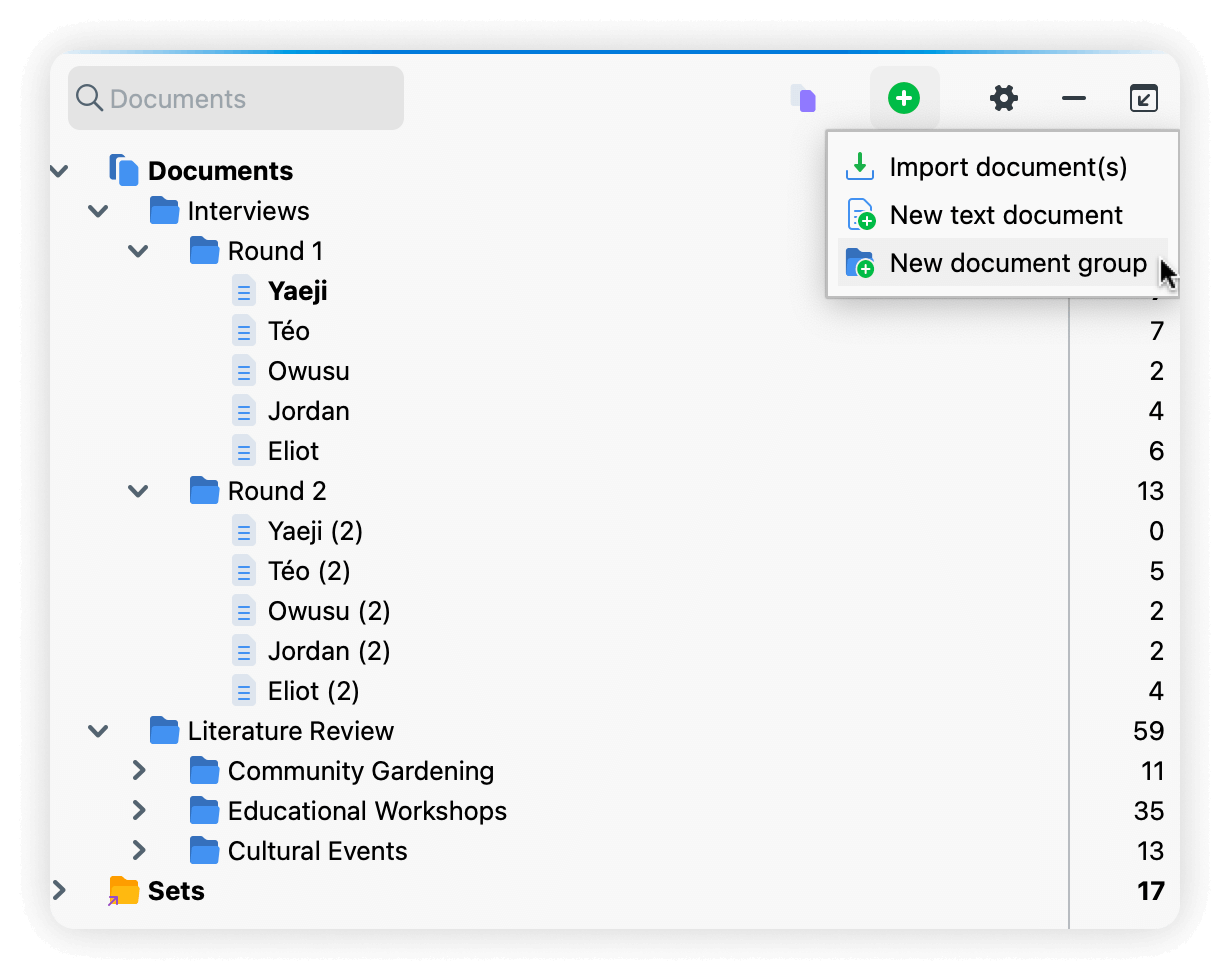
To create document groups, nagivate to the add icon ![]() in the "Document System" window and select New document group, as shown in the image below.
in the "Document System" window and select New document group, as shown in the image below.
Document groups for literature reviews
Consider a thematic or conceptual approach when organizing your literature, especially when dealing with many documents. For example, suppose your Action Research project focuses on utilizing green spaces effectively for improved community engagement. In that case, you might categorize previous research by type of solution (e.g., community gardening, educational workshops, and cultural events). This way, you can easily navigate and find the information you need.
Document groups for collected data
Document groups are also useful for managing your collected data. Since Action Research often involves multiple rounds of data collection, you can distinguish between them by grouping them in groups. For instance, if you conducted interviews, you could create a parent folder called "Interviews" and then sub-folders for each round (e.g., "Round 1" and "Round 2").
Streamlining importation with Watched Folders
MAXQDA's Watched Folders is a lesser-known functionality that is about to become your new best friend. Think of a watched folder as a literary assistant that automatically imports and categorizes your documents within MAXQDA. Drop your documents into a watched folder, and MAXQDA swiftly imports them into your project in the respective document group.
Unlike document groups, which are folders within the MAXQDA "Document System" window, watched folders are stored on your computer in a location of your choice. This feature turns the cumbersome process of literature import into a seamless, automated task.
Setting up watched folders
To set up a watched folder, navigate to MAXQDA's Preferences > Automatic Import > Select Folders. Then, a dialog from your computer's operating system will pop up where you can create a folder in a desired location. Then, select Open folder (MacOS) or (Windows). When naming your folders, remember that the document group created within MAXQDA will use that name. Be sure to hit Save for the changes to take effect.
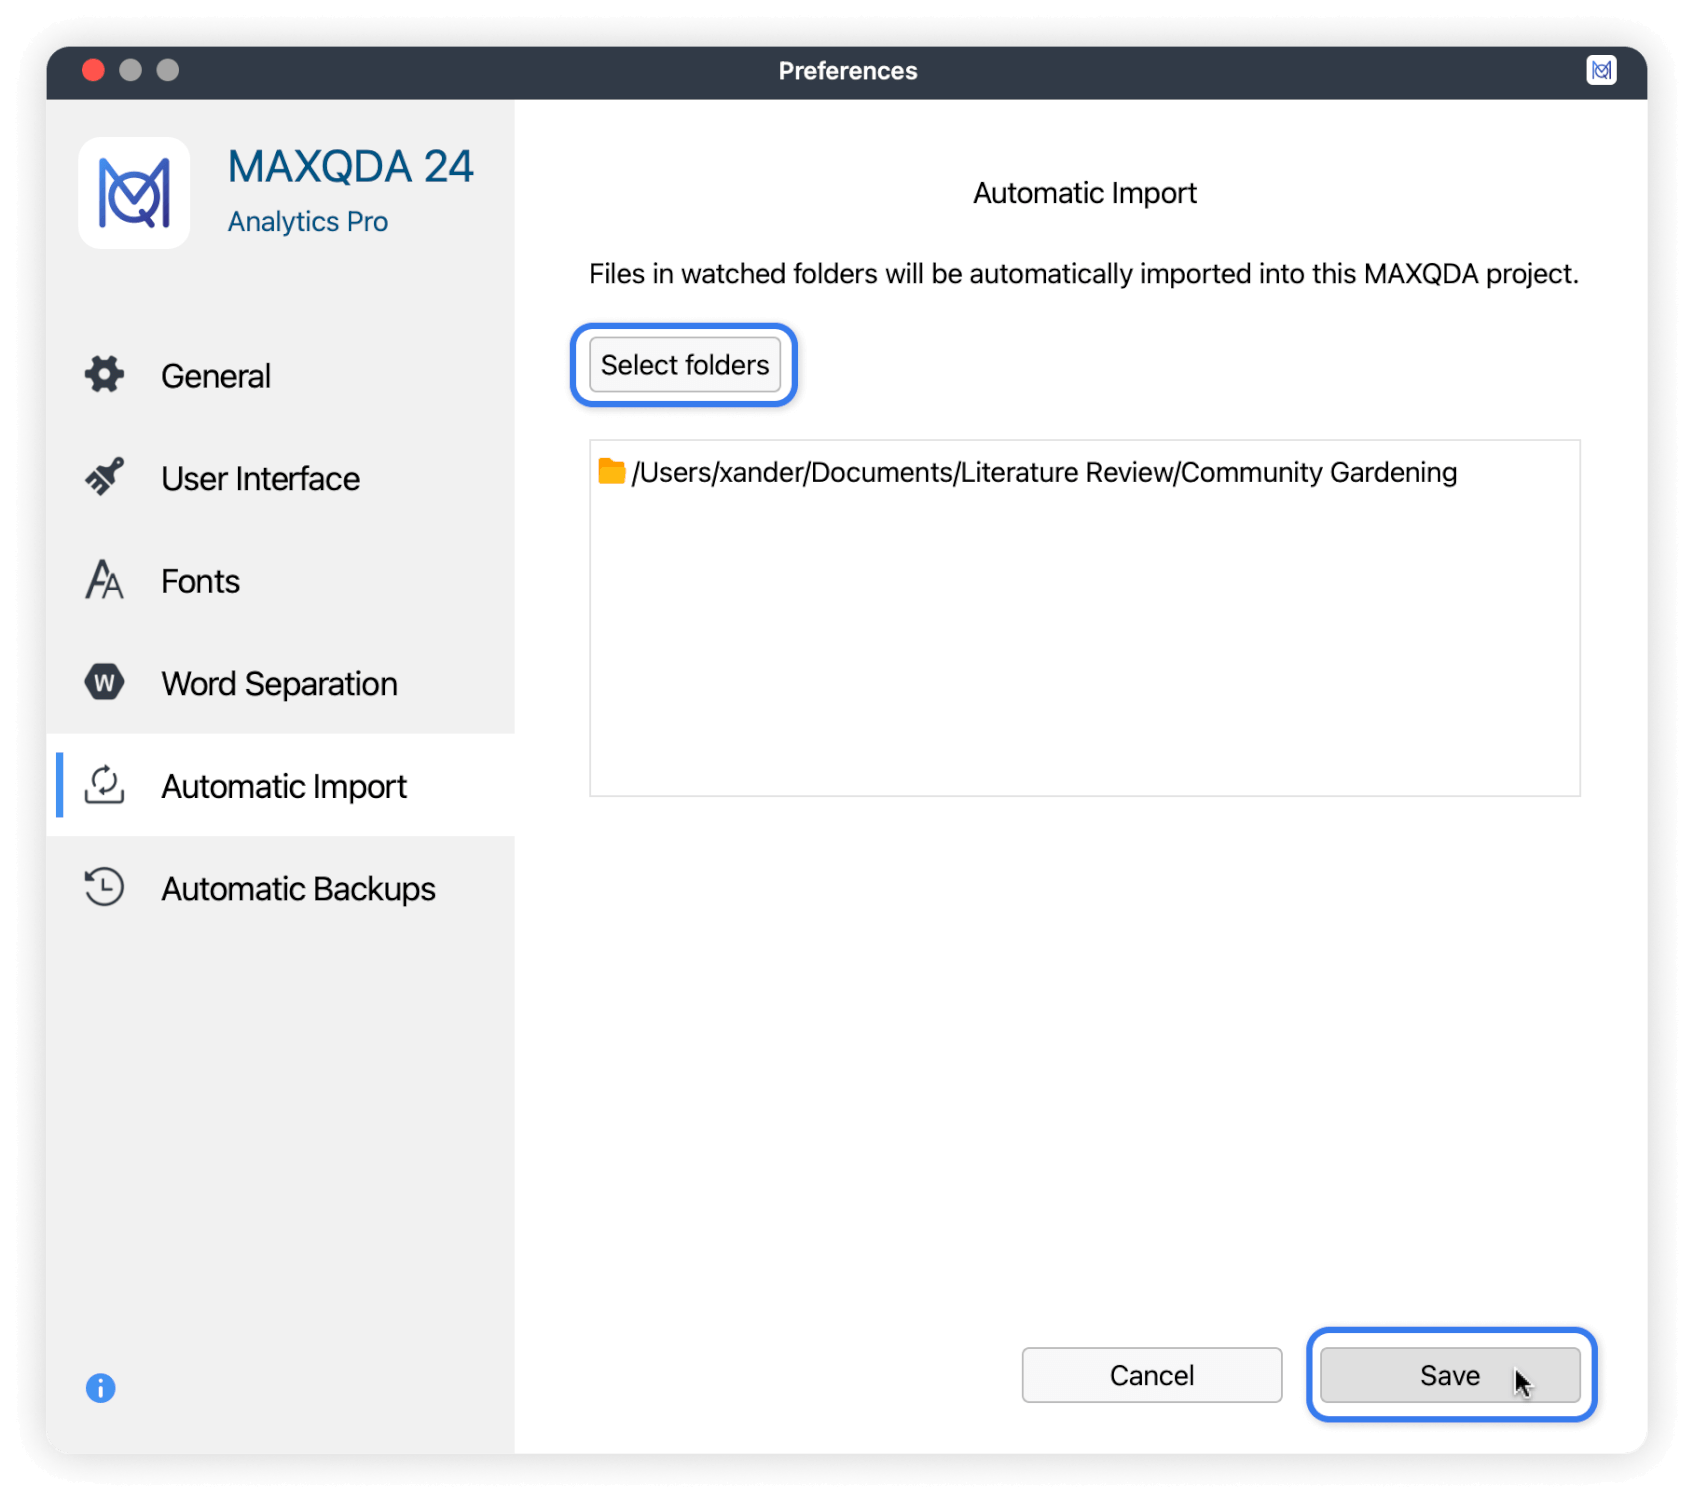
Whenever a file is added to the watched folder on your computer, MAXQDA will automatically detect and import it and then notify you of the successful importation.
Adding Context to your research with MAXQDA variables
Document variables are attributes that describe a document as a whole. These variables can capture metadata about the document itself, such as its author or date created. However, when a document corresponds to an interview transcript, for instance, document variables can take on a different significance by storing information about the interviewee.
MAXQDA easily allows you to access and analyze data about both the document and the individual it represents.
How document variables can inform your Action Research study
Suppose you are conducting an Action Research study on how to improve a community center's outdoor green spaces to improve community engagement. You have interviewed five stakeholders, each with their circumstances, including some who have do not children and others who do.
To truly understand the nuances of your findings, it is crucial to capture participants' sociodemographic information, such as age, gender, education level and occupation, civil status, whether they are parents, and more. By incorporating document variables into your analysis, you can weave this contextual data together with your interview transcripts, gaining a richer understanding of how different factors intersect and influence employee productivity. The next section will discuss how to use variables to analyze your data.
This approach allows you to tease out meaningful patterns and insights that might otherwise remain hidden. In turn, this enables you to develop targeted interventions that address the specific needs of different employee groups.
Adding variables to your documents:
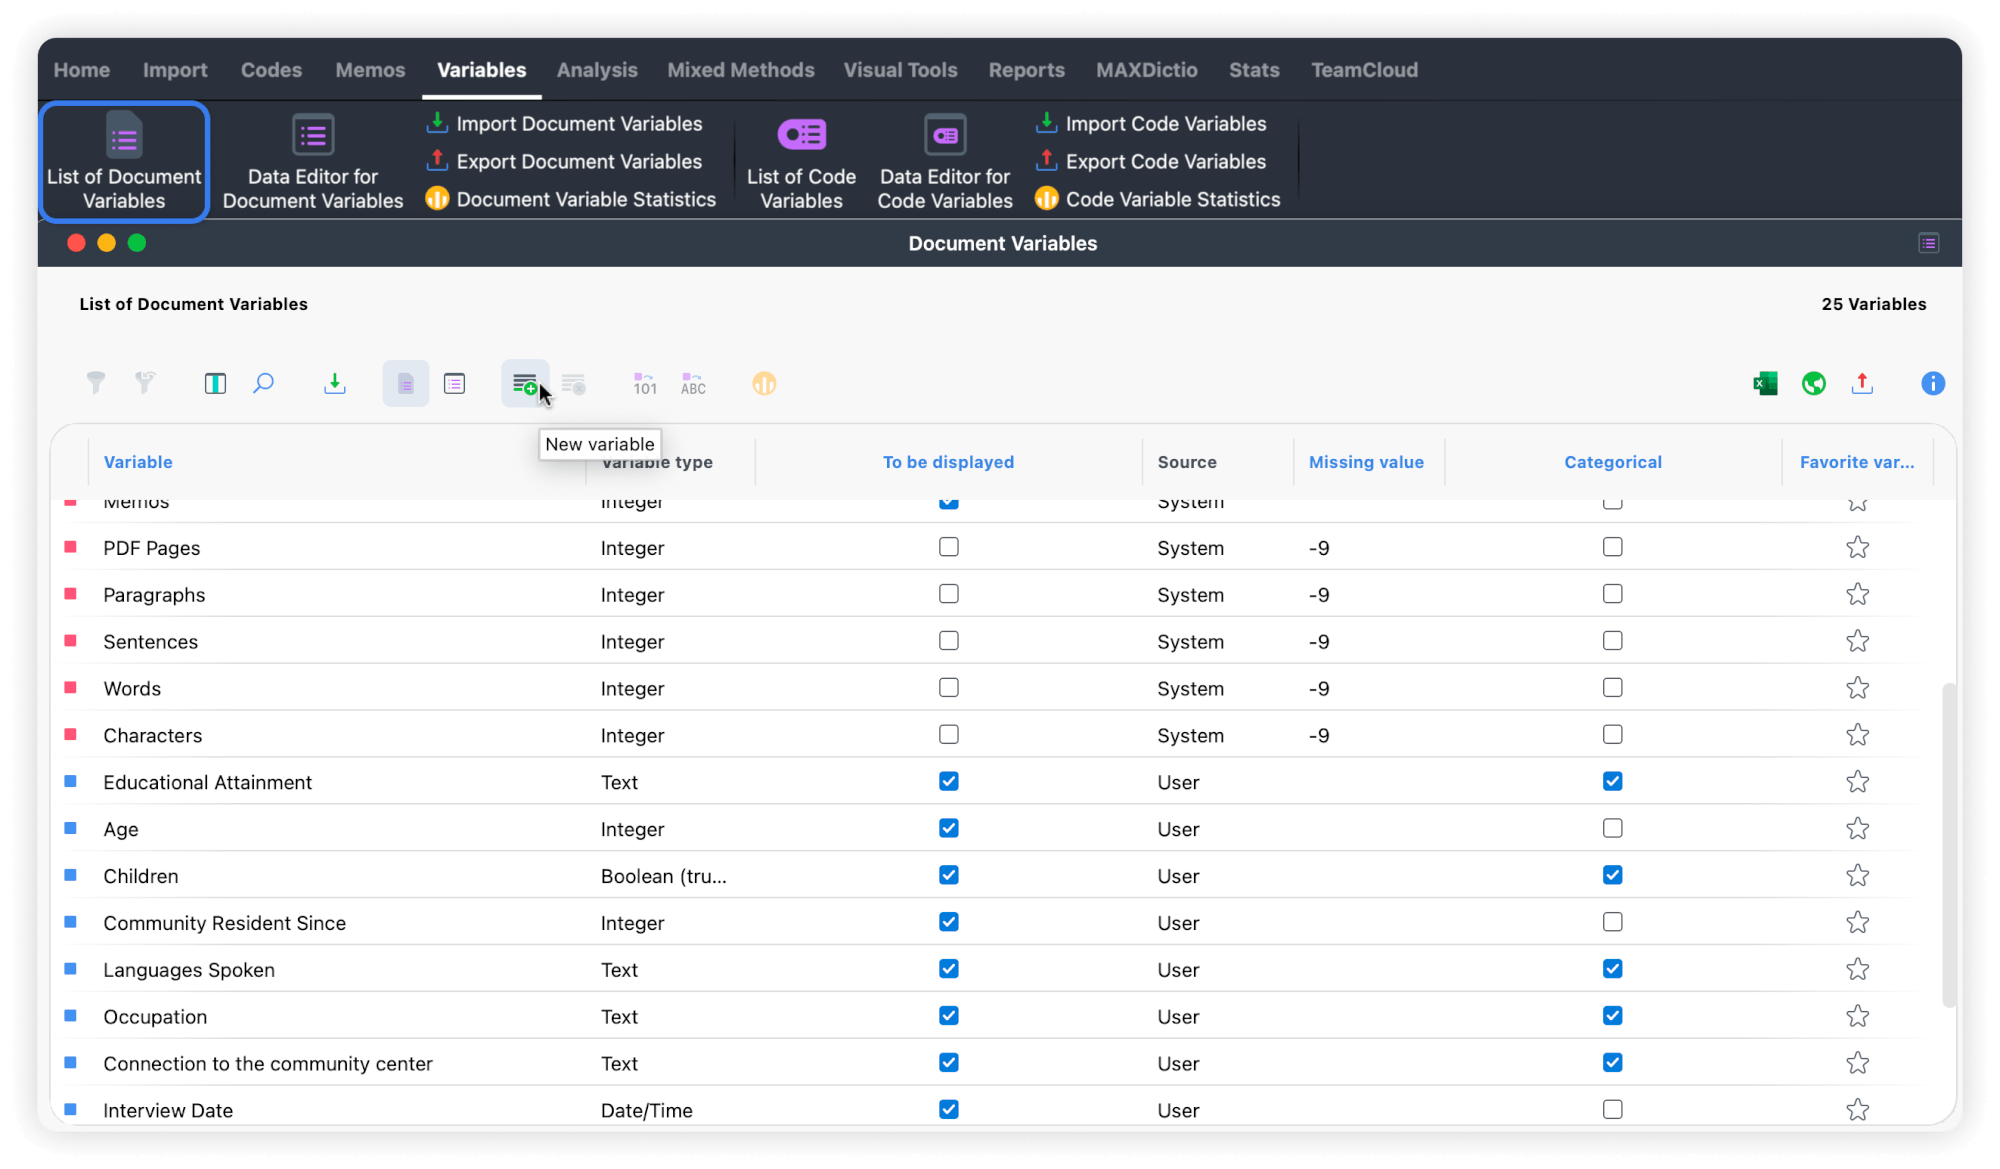
- Navigate to the Variables tab and select List of Document Variables to get a list of all existing variables. System-created variables are displayed in red, whereas user-created ones are blue.
- Click the new variable icon
 in the 'Document Variables' window that opens.
 - Specify the type (text, integer, decimal, date/time, or boolean) and, if applicable, define missing values.
- Create all your variables at once for maximum efficiency.
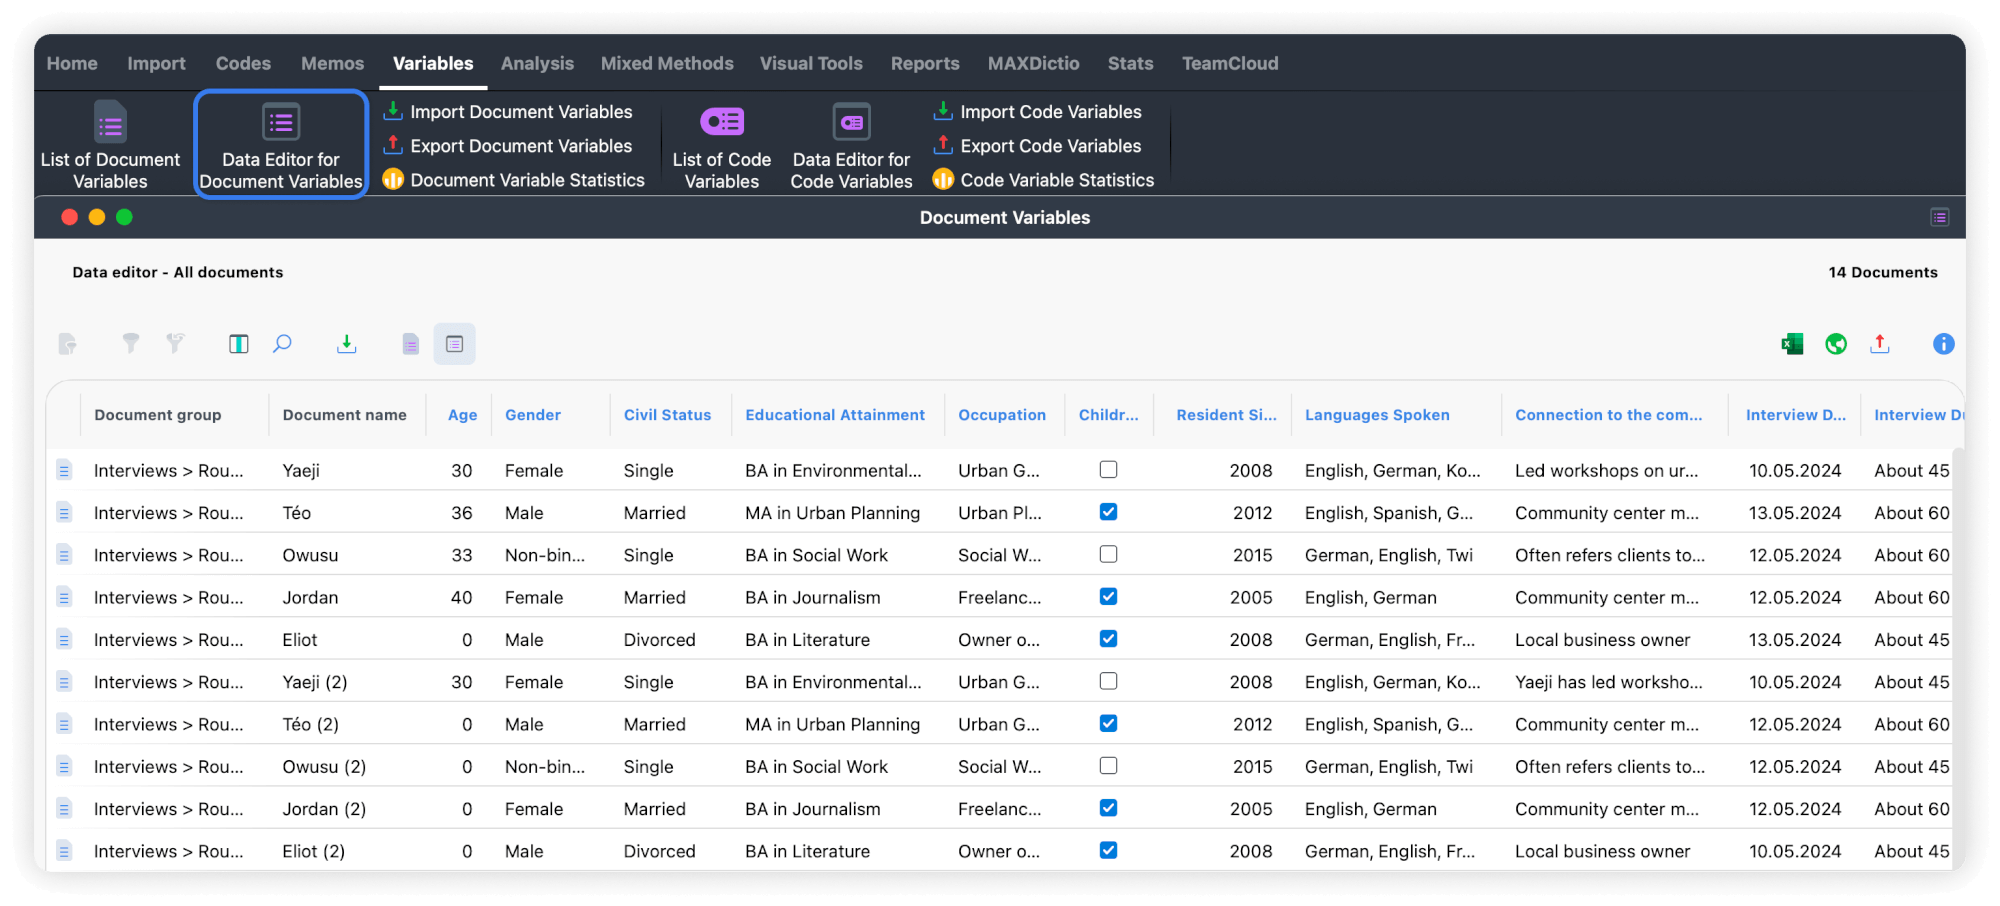
- Switch to the "Data Editor for Document Variables" mode. You can do that either by navigating to the Variables tab and selecting Data Editor for Document Variables or clicking the respective icon
 found in the "List of Document Variables" window's toolbar.
 - In the data editor mode, you can manually input all the values for each variable in all existing documents.
Pillar 2: Analysis in Action Research
In Action Research, analysis is an ongoing process that involves making sense of the data collected during each cycle. MAXQDA offers a range of features to support this process, helping you to uncover patterns, themes, and insights in your data.
While coding data is a fundamental aspect of qualitative data analysis, this guide does not cover the basics of coding. Instead, we focus on more advanced functionalities to help you in your Action Research journey. Specifically, we explore how to use document variables to describe the composition of your participant sample and compare statements between participants or groups using the Segment Matrix. We also explain how to retrieve coded segments using the Complex Coding Query function.
Bringing context to your Action Research data analysis
Document variables are more than just a way to organize your data—they can be a powerful tool for analysis in Action Research. By capturing metadata related to your participants or the context in which data was collected, these variables allow you to uncover deeper insights and patterns within your research. Let us explore two ways you can leverage document variables in MAXQDA to strengthen your Action Research analysis: first, to describe your sample, and second, to compare coded segments.
Describe your participant sample
If you have conducted interviews, surveys, or other forms of participant-based data collection, gaining a clear overview of your sample characteristics is essential. This enables you to contextualize your findings and identify demographic patterns that may influence your results.
With MAXQDA, you can easily create a frequency table to summarize participant attributes such as age, civil status, or education level. To do this:
- Navigate to the Variables menu
In the main toolbar, click on Variables, then select Document Variable Statistics. - Select your variable values
In the dialog that pops up, choose the variable values you want to include in the frequency table. You also have the option to limit your analysis to currently activated documents, allowing you to focus on specific participants or interview rounds. - View Your results
The frequency table shows how many documents (e.g., transcripts) contain each variable value. It displays the variables, categories, absolute frequency, and corresponding percentages, giving you a clear picture of your sample's composition.
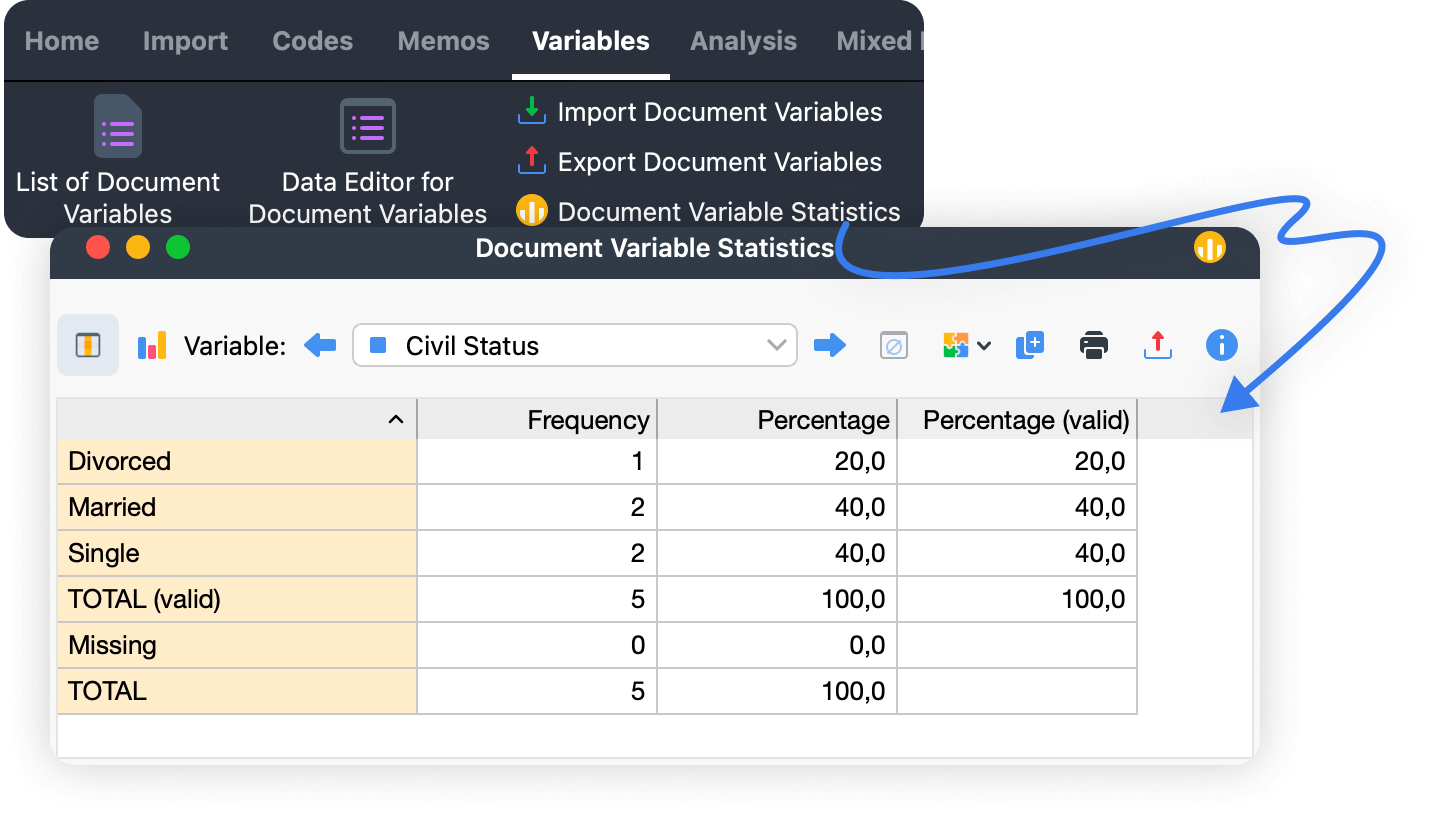
This output provides an invaluable overview of your participants' diversity and how this diversity might affect your research outcomes.
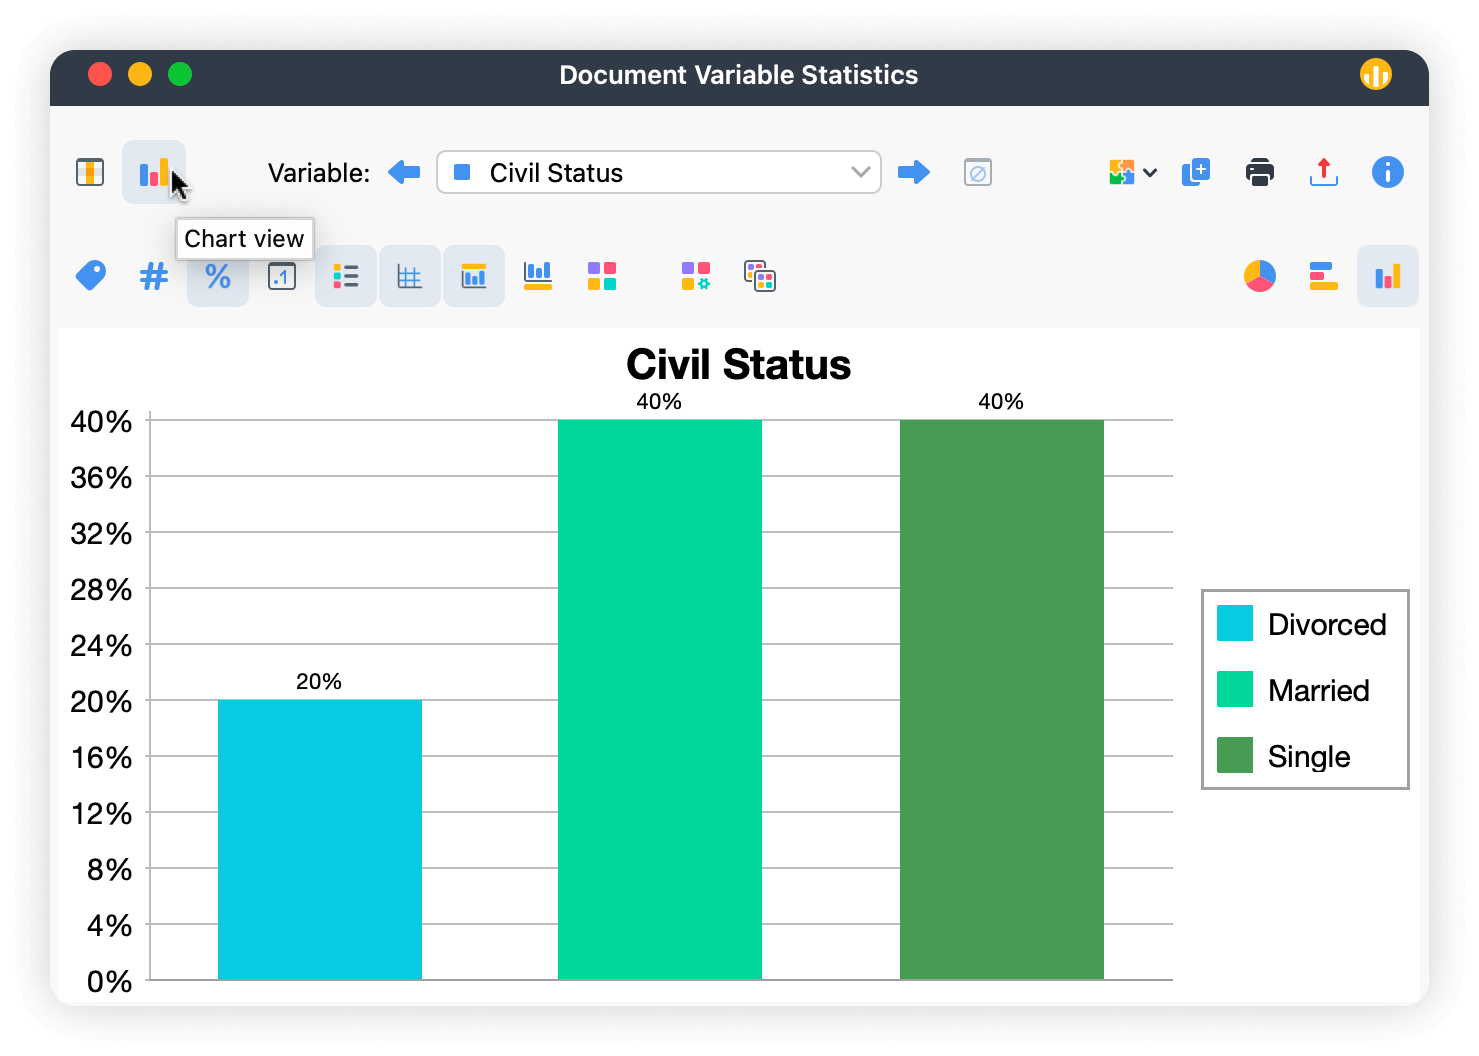
To visually access the data more effectively, click the chart icon ![]() in the toolbar to switch to the chart view. This will convert your table into a bar chart, making the information easier to understand.
in the toolbar to switch to the chart view. This will convert your table into a bar chart, making the information easier to understand.
Compare coded segments
Once your data is coded, MAXQDA’s Segment Matrix offers an interactive workspace to compare coded segments across different cases or groups. This tool allows you to gain deeper insights into how participants or groups differ in their responses based on contextual information, in the form of variables.
For example, if you are exploring how participants' green space wishes differ by whether they are parents or not, the Segment Matrix will allow you to analyze this efficiently.
You can generate a Segment Matrix following these steps:
- Activate the relevant documents and codes:
Before generating the matrix, decide if you want to include all documents and codes or only specific ones. Activate the relevant ones as needed. - Open the Segment Matrix:
Navigate to Mixed Methods > Segment Matrix in the main menu. - Select your Variables values:
Choose which document variable values you wish to compare. Each variable condition will generate a separate column in the matrix. - Fine-tune with activated documents and codes:
If you are only analyzing a subset of documents or codes, make sure to check Only for activated documents and Only for activated codes to filter your matrix accordingly.
Once generated, the matrix displays cases or groups in the columns, while codes are listed in the rows. For instance:
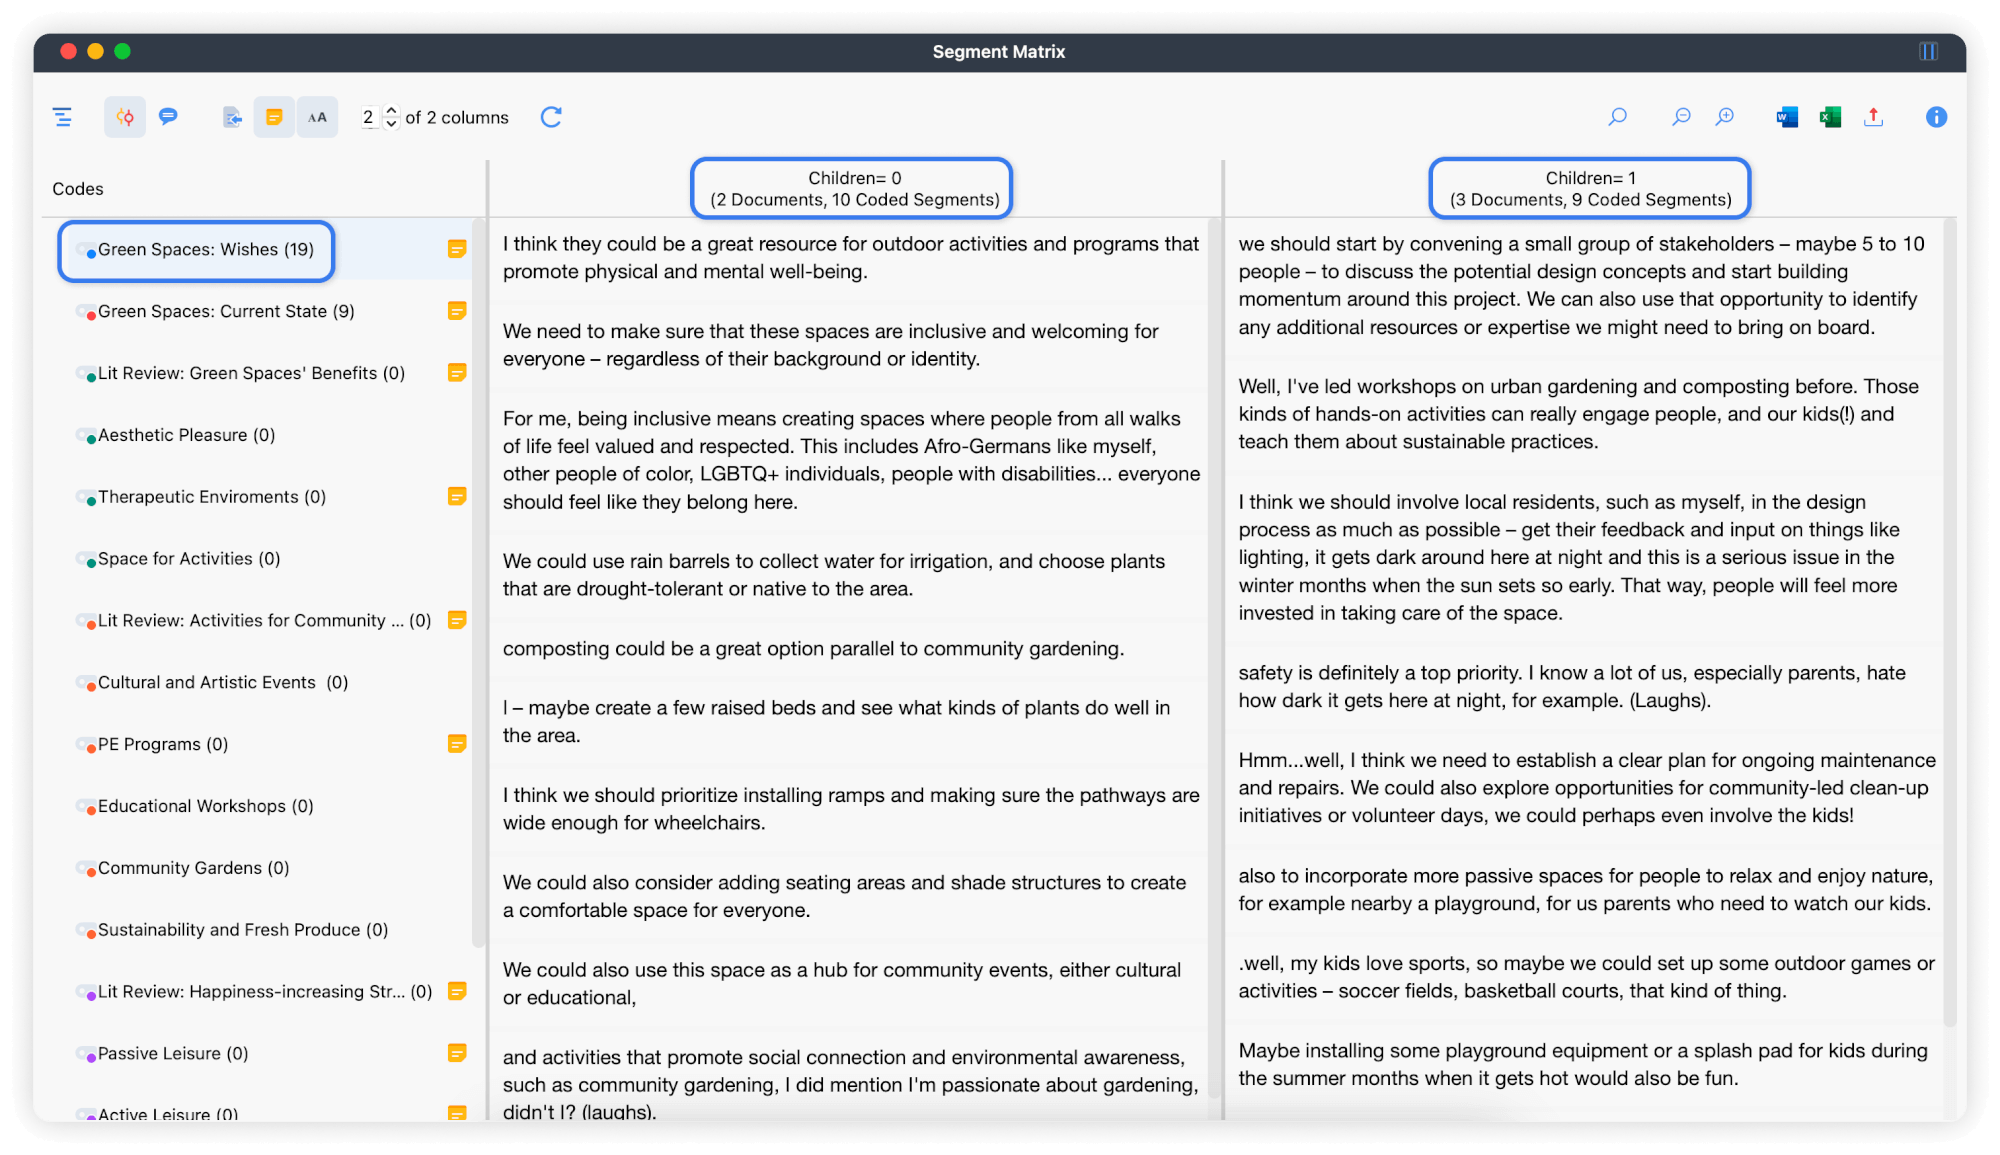
In this example, the variable 'Children' is a binary indicator that takes on two values: 0 (indicating that an individual has no children) and 1 (indicating that they have one or more children). The example output above, gives you a clear overview of patterns or divergences based on variables, in this case, whether they are a parent or not.
Essentially, the Segment Matrix, lets you discern how contextual information impacts participants' perspectives. This allows you to tailor your programs to meet the specific needs of different community groups, increasing their effectiveness and impact.
The Complex Coding Query in Action Research
In Action Research, iterative and reflective methodologies require a deep dive into qualitative data. The Complex Coding Query is a powerful tool in MAXQDA that enables researchers to search for and analyze coded segments by combining codes and defining their relationships.
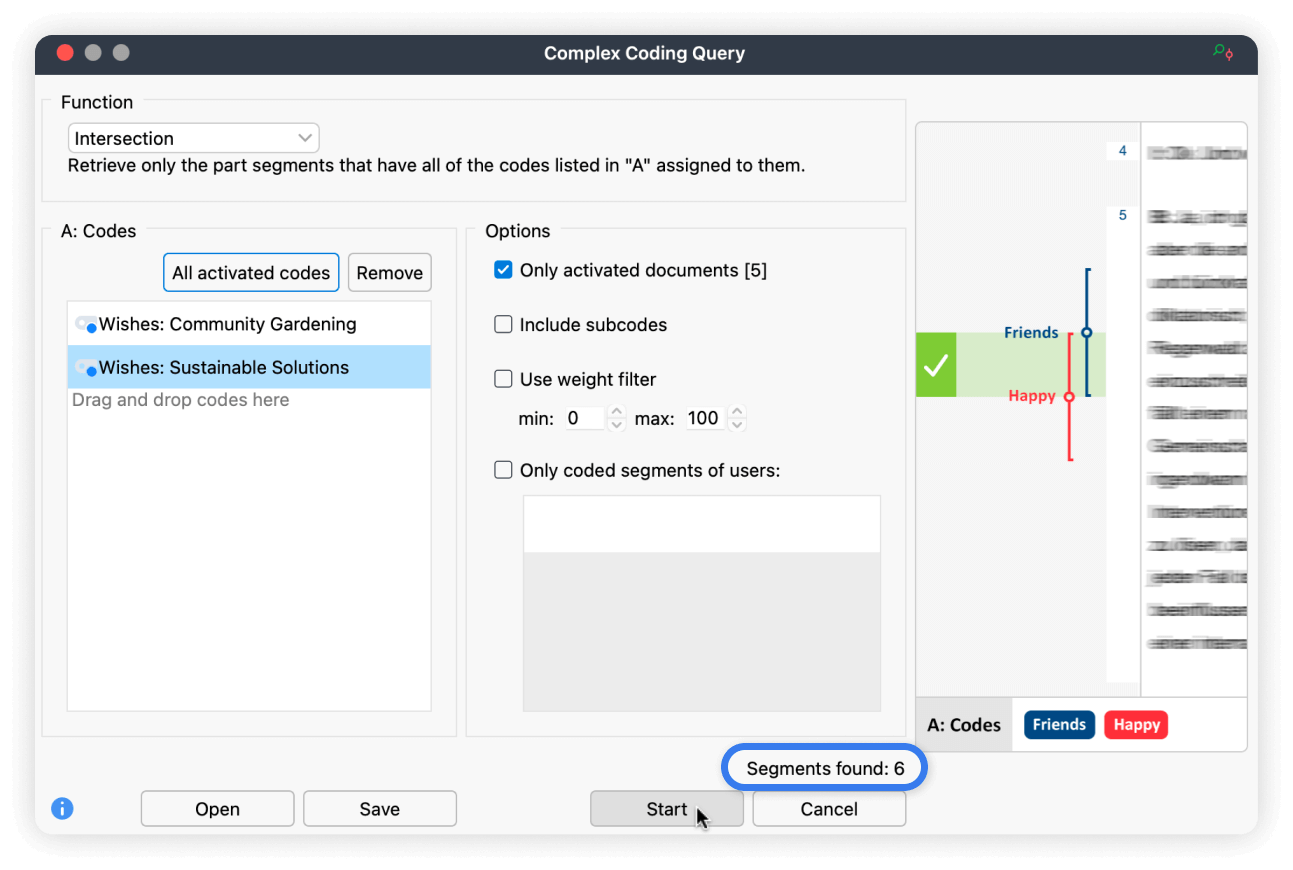
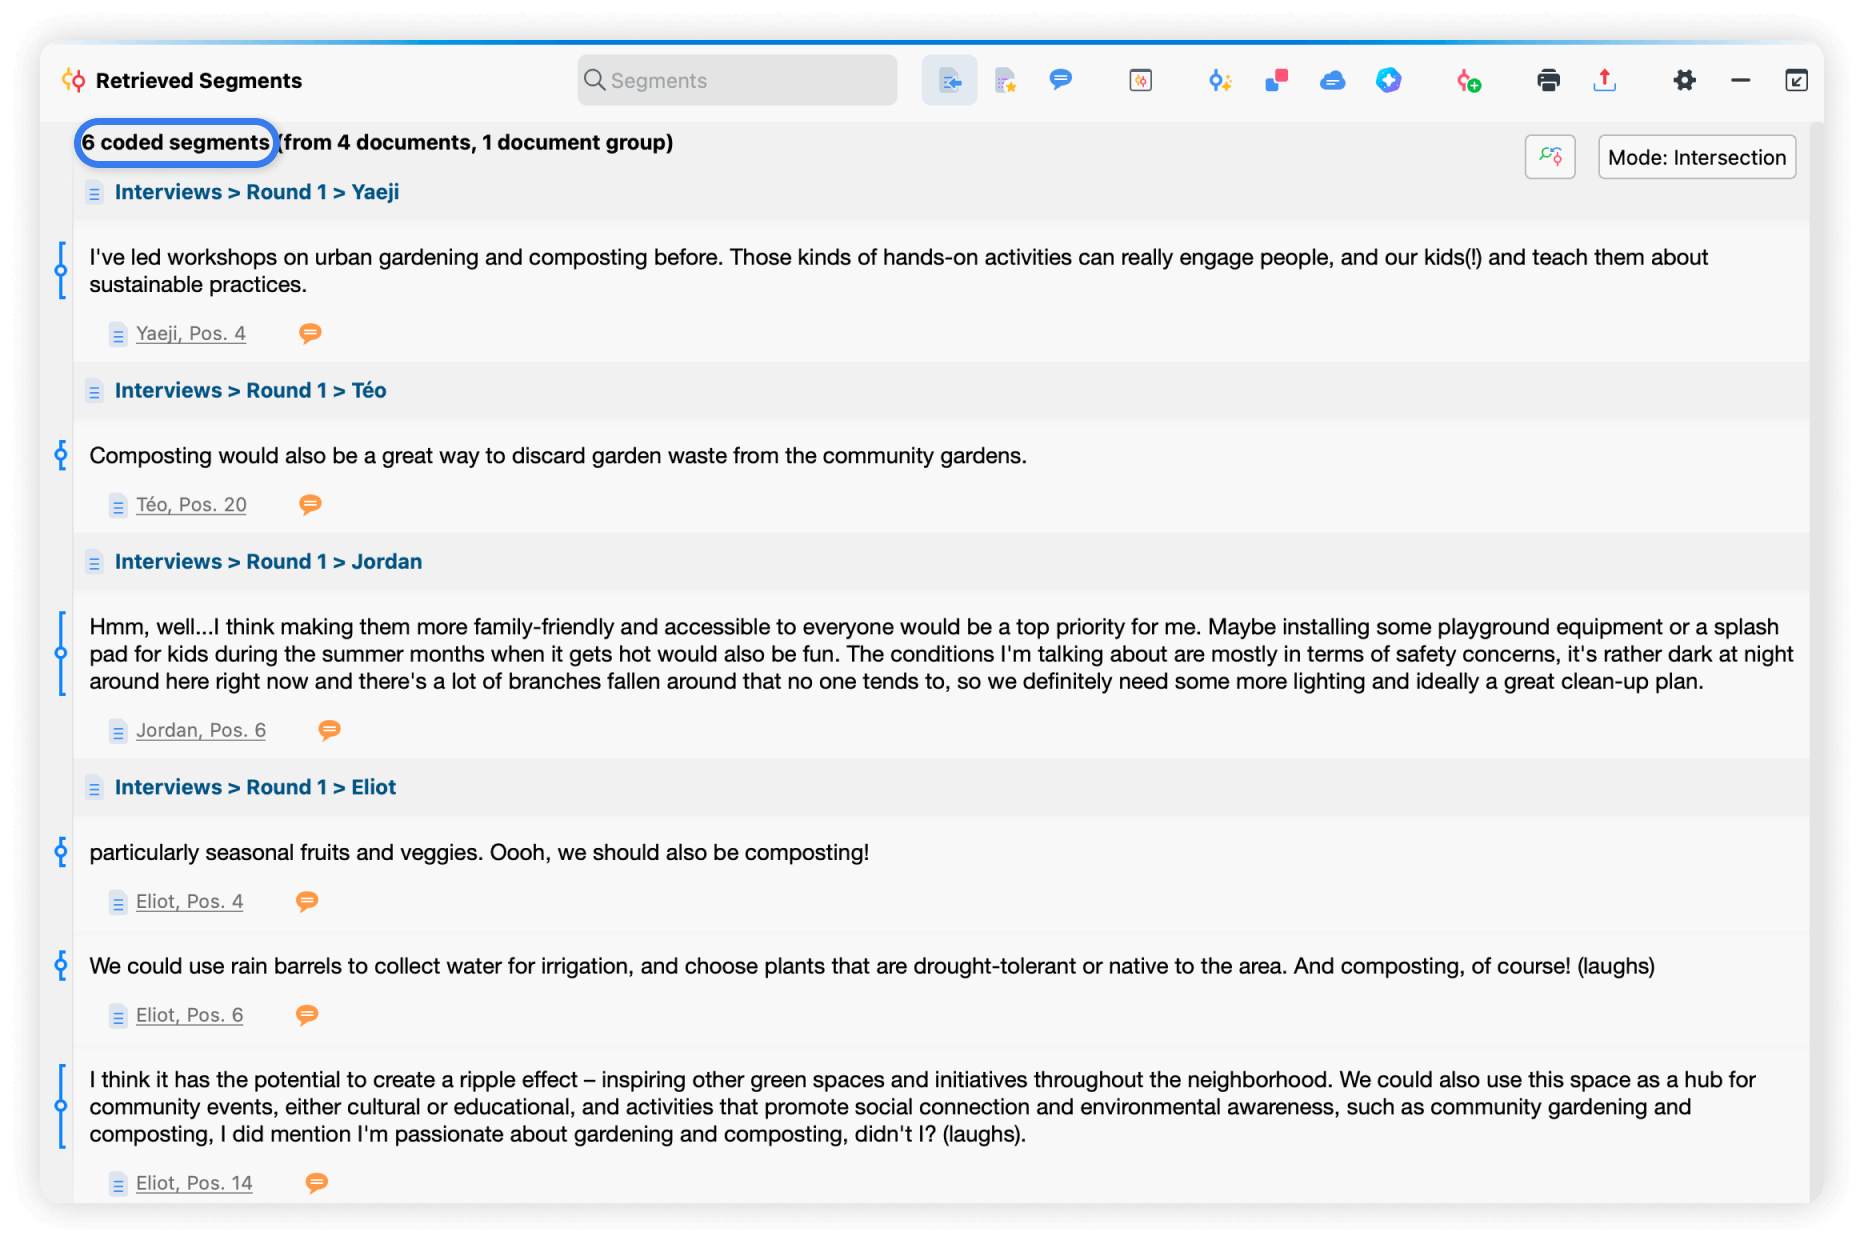
The Complex Coding Query enables researchers to dissect qualitative data into meaningful segments, revealing subtle patterns and relationships. For instance, returning to our previous example about revitilizing the green spaces around a community center, with this tool you can isolate the intersections between specific wishes (e.g., community gardening and sustainable solutions).
Doing so allows you to uncover nuanced insights into how certain wishes interact, ultimately informing data-driven recommendations for targeted programming.
Running a Complex Coding Query in MAXQDA
- Ensure the "Retrieved Segments" window is open.
- To open the dialog box to set up your query preference, navigate to Analysis > Complex Coding Query in the menu ribbon.
- In the dialog box that opens (see picture above), define the function. Each function refers to the relationship between your selected codes and is accompanied by a visual guide displayed on the right-hand side of the dialog, which helps clarify how each operation works.
- Select the codes by dragging and dropping them in the respective fields on the dialog box.
- Click Start to execute the query. The results will appear in the "Retrieved Segments" window (see picture below), allowing you to analyze them further.
Pillar 3: Action Research reflection
Action Research involves iterative processes that require regular reflection and documentation. This section explains how to use MAXQDA's Logbook and memos to support your Action Research project.
Using the MAXQDA Logbook as your Action Research journal
Action Research often involves iterative processes, prompting researchers to maintain journals as a chronological record of their research journeys. If you choose to keep such a journal, look no further than MAXQDA’s intuitive Logbook.
We recommend starting your Logbook journal at the outset of your project so that you ccan document your initial thoughts and assumptions, establish a record of your decision-making processes, and set the stage for ongoing reflection and iteration.
You can effortlessly access the Logbook from the Home tab menu, as seen here:

To date your new entries click on the calendar icon ![]() in the Logbook’s toolbar upper left corner to ensure you never lose track of entries.
in the Logbook’s toolbar upper left corner to ensure you never lose track of entries.
Benefits of using the Logbook instead of a paper notebook:
- Searchability: With just a few clicks, you can swiftly search within your Logbook. This feature empowers you to track your progress and identify patterns with efficiency and control.
- Flexibility: The Logbook offers a range of text formatting options, empowering you to record your thoughts, insights, and reflections in a format that aligns with your unique needs.
- Accessibility: The Logbook’s direct access from within your MAXQDA project boosts your productivity and saves time, ensuring you never misplace your journal again.
- Connected thinking: Connect the dots between data and your reflections by linking relevant text segments to specific Logbook entries, facilitating a deeper understanding of your research.
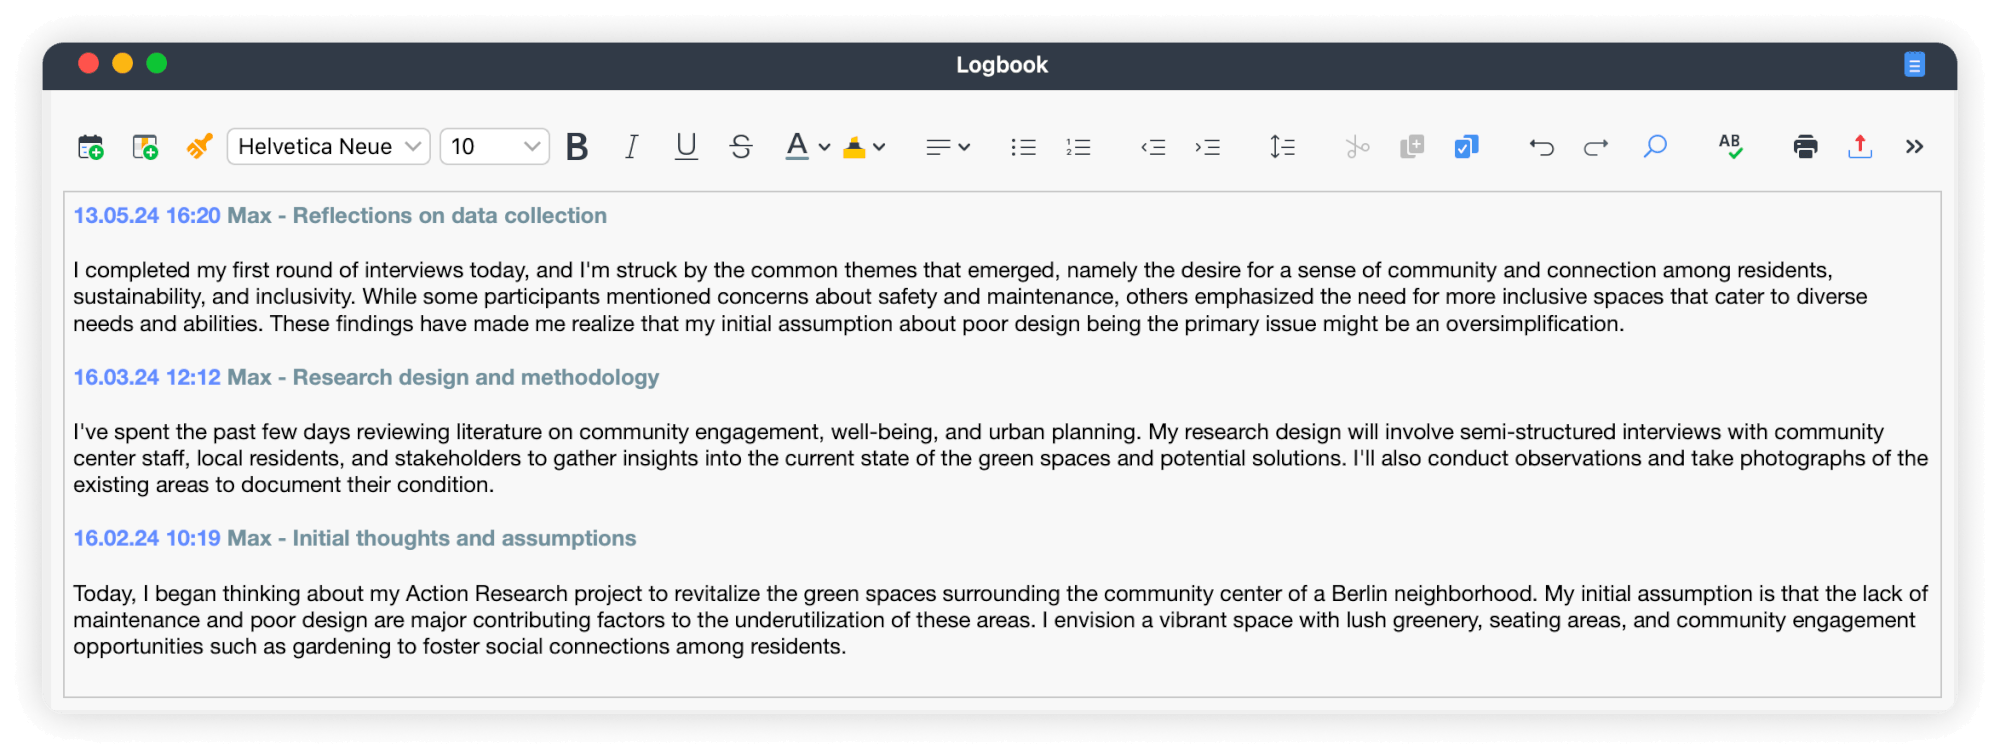
Let us consider an Action Research journaling example
Once again, let us return to the Action Research project to revitalize the green spaces around a community center to promote residents' well-being and community engagement. Here is an example of how your Logbook entries might look like:
Document, reflect, and gain insights with MAXQDA memos
In qualitative research, memos are brief notes used to record thoughts, ideas, decisions, and insights throughout the research process. MAXQDA memos allow you to organize your thoughts in the way that best works for you. For this reason, they are an ideal tool for supporting the iterative cycles of Action Research.
MAXQDA memos provide a flexible way to document your reflections, observations, and analysis, helping you to clarify your thinking, identify patterns and themes, and develop your research approach. You can attach memos to everything from individual documents and data segments to your entire project or just leave them as free-floating notes.

This section deep dives into how you can use project memos and provides general tips on efficient memo use to help you succeed in your Action Research endeavors.
The power of project memos
A project memo can make a world of difference to your Action Research journey. Unlike the Logbook, which can function as a comprehensive and more structured way of reflection, the project memo offers a more targeted approach to periodically documenting methodological decisions.
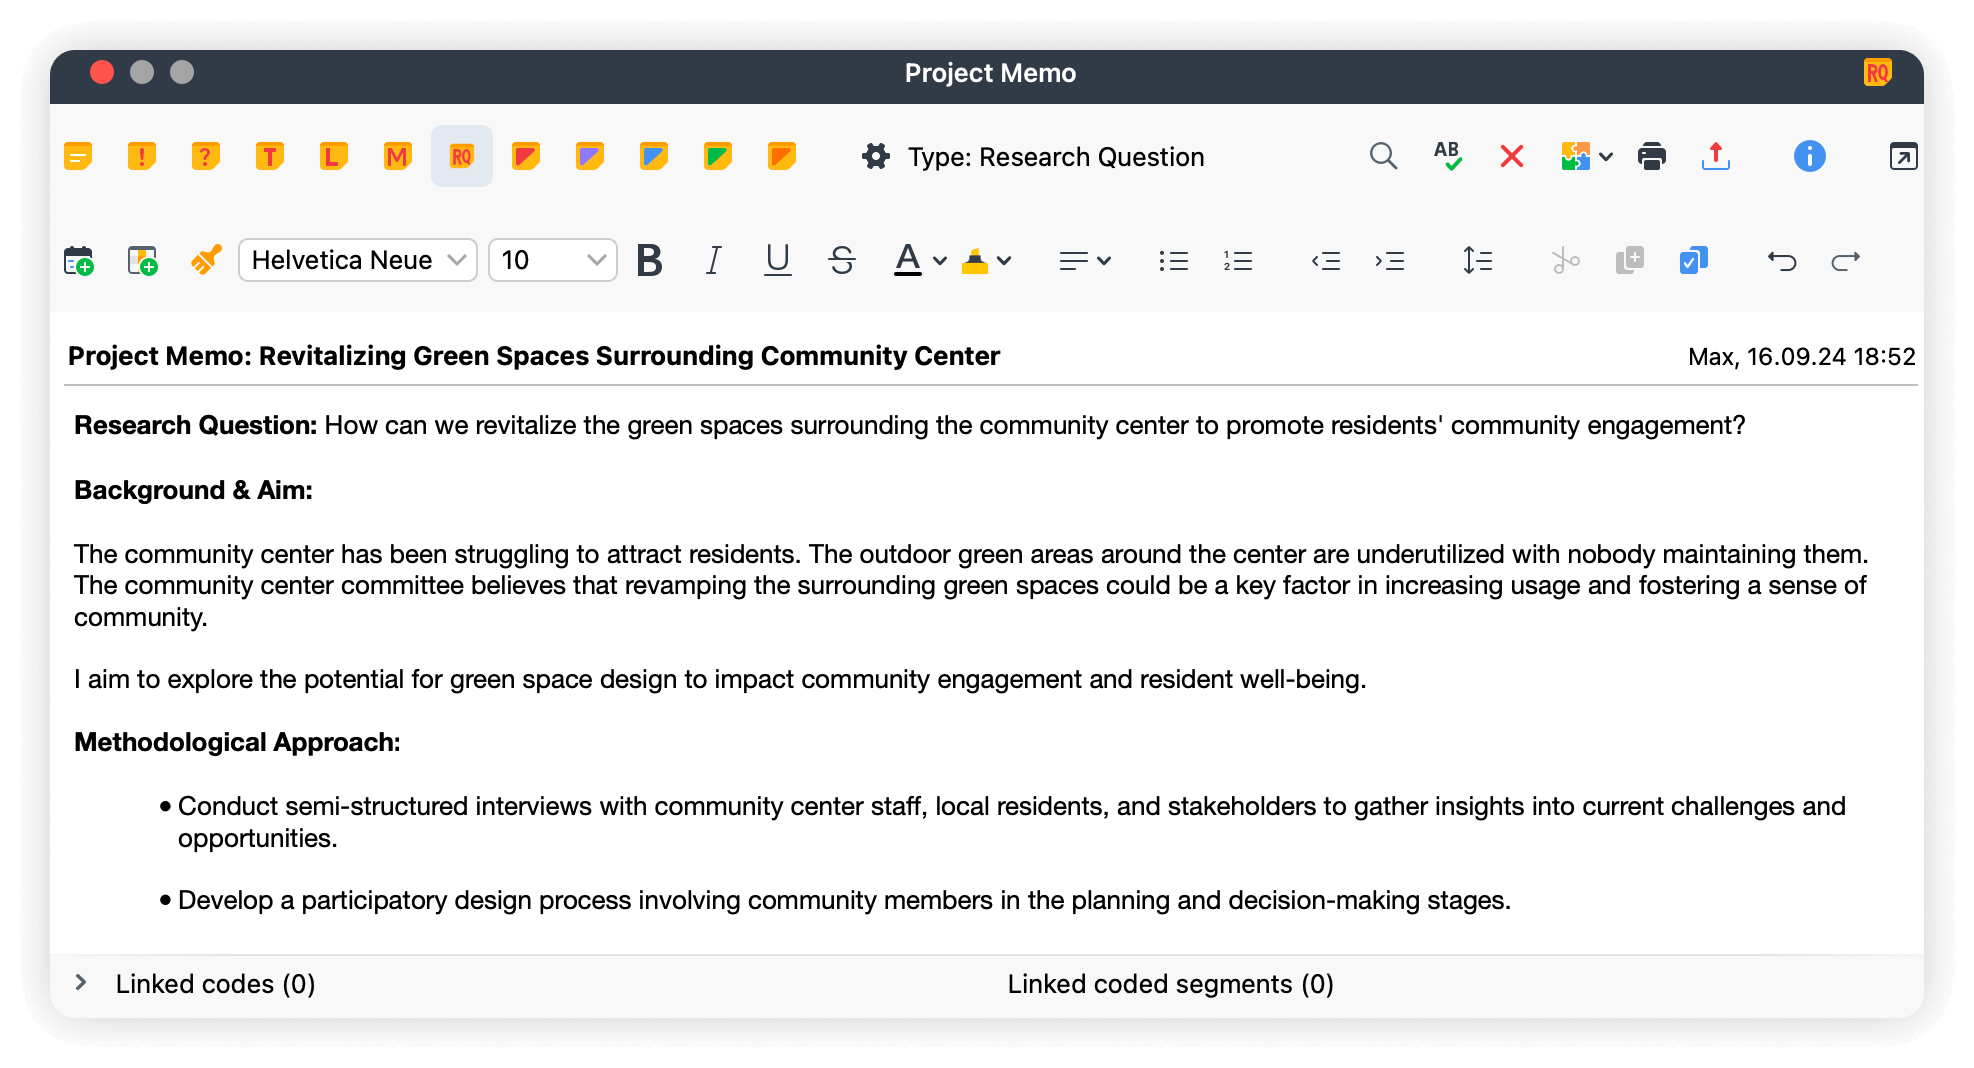
That is why we recommend starting work on your project memo at the very start of your project. By creating a project memo at the outset, you can establish a record of your decision-making processes and set the stage for ongoing reflection and iteration. For example, if you decide to merge or redefine codes, you can use the project memo as a centralized and accessible way to record the rationale behind these decisions.
To create a project memo, follow these steps:
- Navigate to the "Document Browser" window
- Right-click on Documents to access the context menu
- Select the Memo option from the menu
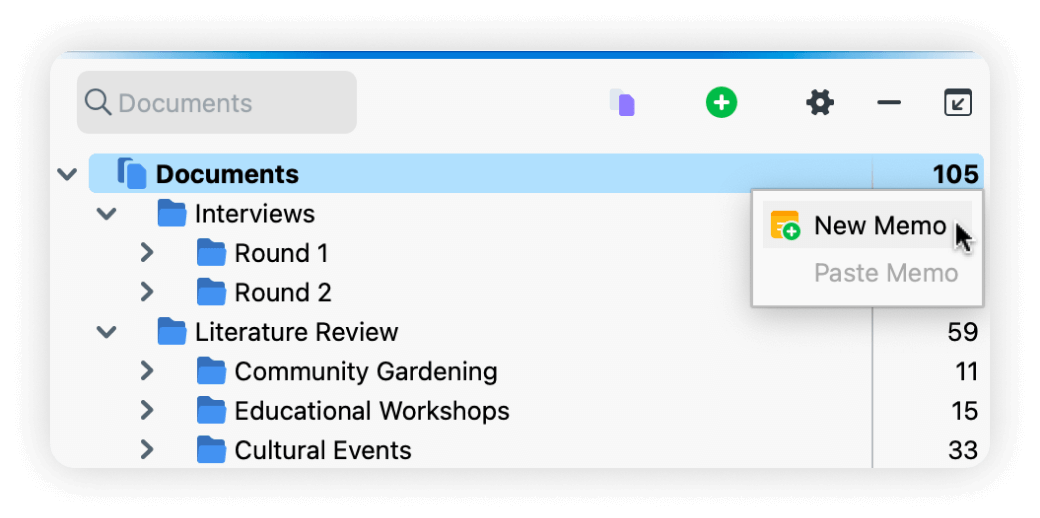
Alternatively, click on the documents level in the "Document Browser" to select it and use the keyboard shortcut Alt + ⇧ + M on Windows and option ⌥ + ⇧ + M on MacOS to add a memo to that level.
Note that this method allows you to add a memo to any document, code, or text segment within MAXQDA as long as you have selected or highlighted the element in question. However, what makes a memo a project memo is that you are adding it specifically to the Documents level in the "Document Browser."
Tips for using memos in Action Research
- Make it a habit: Write a memo as soon as you set up a project, read a document, or create a code. This will help you establish a routine of regular documentation and reflection.
- Keep them up-to-date: Regularly review and update your memos to reflect changes in your research approach, new insights, or shifts in your thinking.
- Link your thoughts: Take advantage of the ability to link codes and coded segments to individual memos, identify connections, and gain deeper insight into your data.
- Classify memos: Categorize memos by specifying their type by using the various symbols and colors, as well as adjusting the text label, making it easier to organize and track multiple memos throughout your project.
Pillar 4: Reporting Action Research outcomes
In Action Research, reporting is not just about summarizing findings but also about informing decision-making and actionable solutions. Effective reporting requires clear communication of complex data and actionable recommendations that resonate with stakeholders.
In this section, we explain how to leverage MAXMaps to visually represent actionable recommendations and create a clear roadmap for implementation. We also discuss strategies for efficiently writing reports using Summaries and utilizing MAXQDA's artificial inteligence tool, AI Assist, for support.
Visualizing actionable recommendations with MAXMaps
MAXMaps is a visual mapping tool that enables users to create interactive diagrams that link and organize data, ideas, and concepts into conceptual frameworks, causal loops, and system maps. MAXMaps facilitates analysis, interpretation, and decision-making by visually representing relationships between different elements.
In the context of Action Research, effective communication is crucial for stakeholders to grasp complex research insights and their practical applications. MAXMaps simplifies this process by providing a powerful tool for visually connecting research findings to real-world solutions, ultimately driving meaningful change and impact.

To start mapping, navigate to Visual Tools > MAXMaps to launch the dedicated workspace. Then, you can create maps and add objects, visualize the relationships between objects by linking them, customize their formatting, and more.
Let us consider an Action Research mapping example
Let us return to our example of revitalizing the community center's green spaces. Suppose we want to develop a comprehensive plan for revitalizing the green spaces surrounding a community center. We can use MAXMaps to create a diagram that combines critical findings from our research and link them to actionable recommendations directly. For instance:
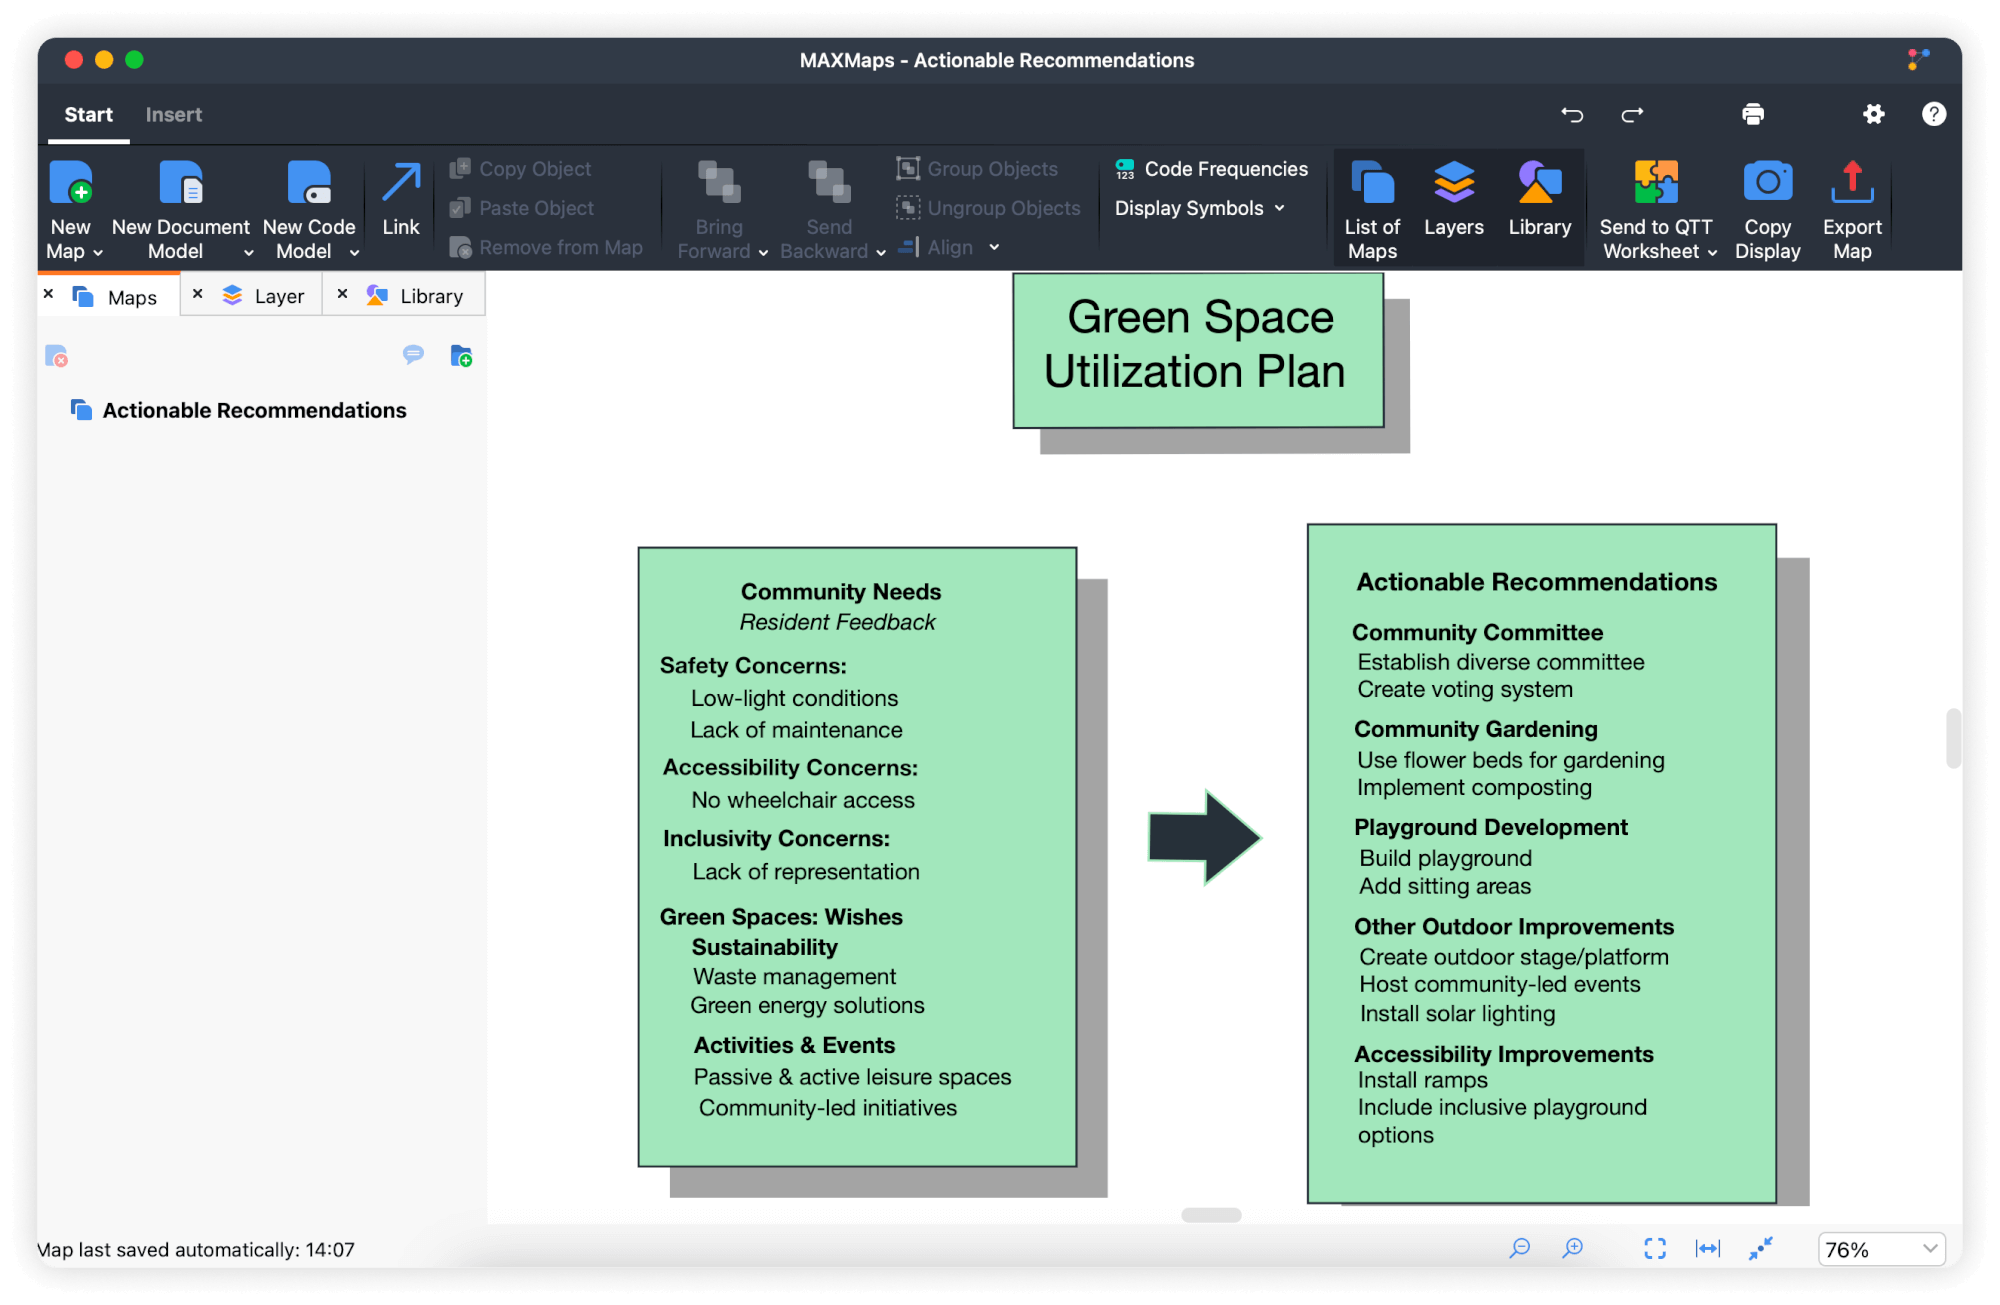
MAXMaps also plays a key role in prioritizing our recommendations and formulating a clear action plan. For instance, we can use the map to identify areas with the most pressing community needs or where existing green space design elements could be enhanced, thereby guiding our project towards the most impactful actions.
By using MAXMaps to visualize our research insights, we can create a powerful tool for communicating with stakeholders and guiding the implementation of our plan.
Best practices for using MAXMaps in Action Research
Here are some tips for using MAXMaps effectively in your Action Research projects:
- Keep it simple: Avoid overwhelming the map with too much data or complexity.
- Use clear labels: Ensure all elements are clearly labeled and easily understood.
- Focus on key connections: Highlight the most important relationships between elements.
- Cluster related elements: Group similar elements for clarity.
By following these best practices and leveraging the power of MAXMaps, you can create compelling reports that inspire action and drive meaningful change.
Using MAXQDA's summary function to write better Action Research reports
In Action Research, writing clear reports is crucial to effectively communicating findings and recommendations to stakeholders. One key challenge in this process is making sense of large amounts of data and distilling it into actionable insights. That is where MAXQDA's summary function comes in—a robust set of tools for summarizing, analyzing, and reviewing data.
MAXQDA's summary function: a two-stage approach
MAXQDA's summary function involves two main stages: summary creation and summary analysis/presentation. During the first stage, you create summaries in the Summary Grid. In the second stage, you analyze and present these summaries using tools like Summary Tables, which let you work on your summaries alongside document variables.

Stage One: The Summary Grid
The Summary Grid is an interactive table designed to help you systematically organize and summarize your data in a structured way. It provides a bird's-eye view of your project, making identifying patterns, relationships, and insights easier. Therefore, it can help you translate data into actionable solutions.
An example of MAXQDA's summary function in Action Research
Let us once again return to the Action Research project at a community center with underutilized green spaces. We have conducted interviews with several stakeholders and have coded our data with the codes 'Green Spaces: Current State' and 'Green Spaces: Wishes.'
Using the Summary Grid, we can summarize what each participant said in these two categories. A key advantage of utilizing the Summary Grid in Action Research is its ability to condense intricate data into actionable insights. When summarizing the points made by Téo, you can directly highlight potential solutions associated with his statements.
How to use the Summary Grid
Creating summaries in the Summary Grid is a simple process. Once your data is coded, you are ready to start summarizing.
To launch access the Summary Grid's workspace, navigate to the Analysis tab in the main menu and click on Summary Grid.
The Grid displays all codes in rows and all documents in columns, as shown in the picture below.
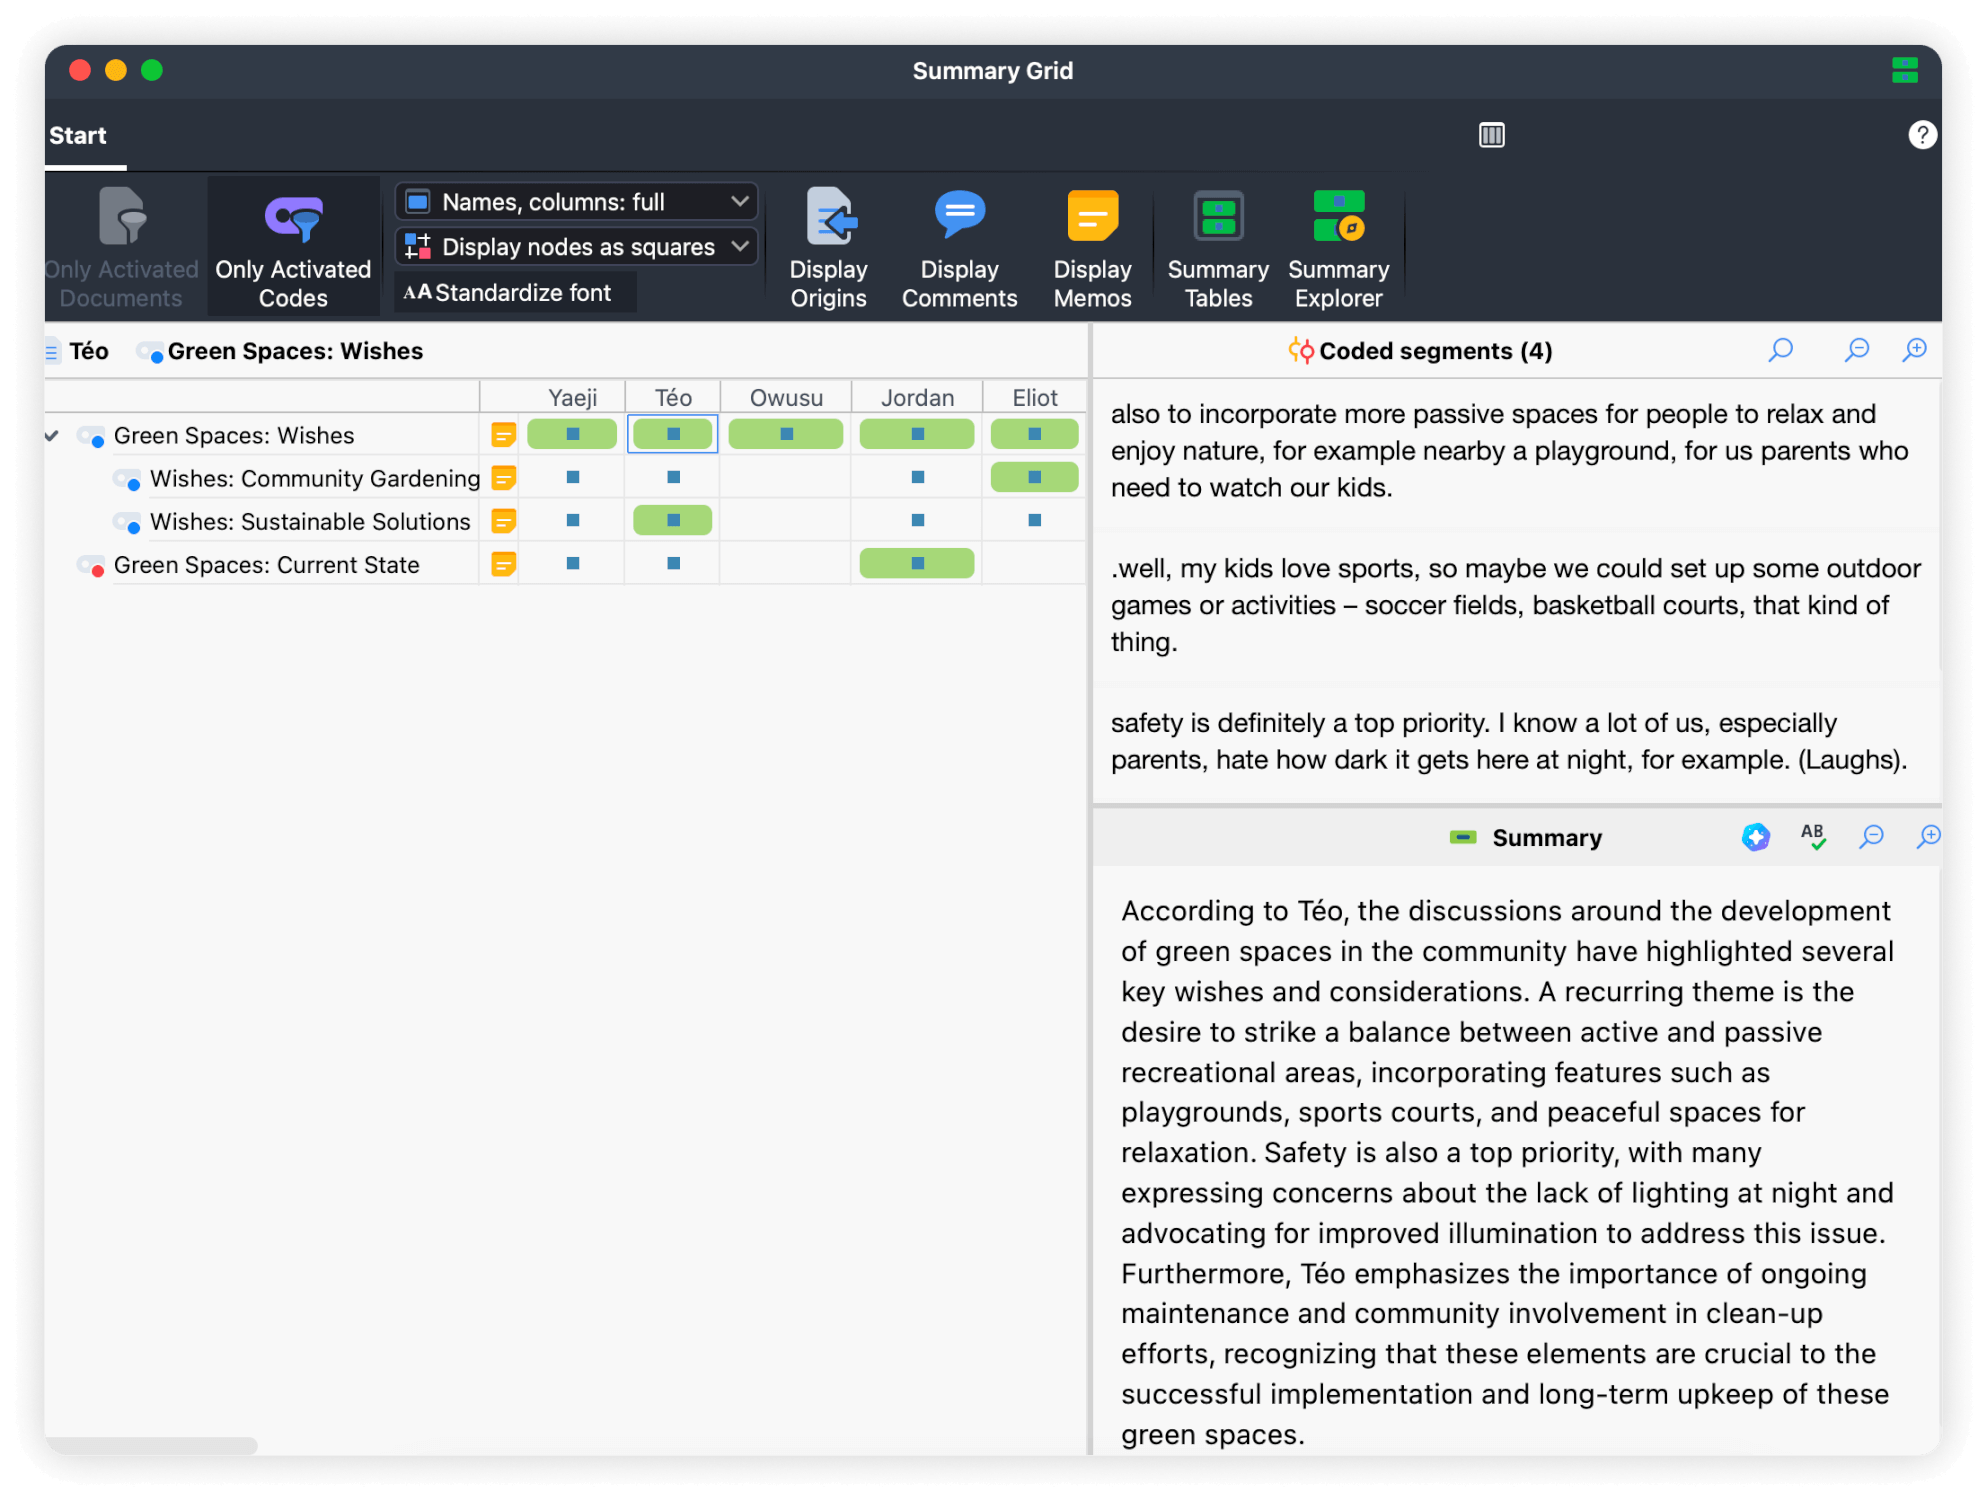
The blue squares in the Grid indicate the presence of coded segments for each intersection between a document and a code. When you click on a blue node, you display the respective coded segments in the upper right-hand panel. The bottom right-hand panel is where you can summarize the displayed coded segments.
To work with a selection of documents and codes, you can filter the Grid to generate a more focused display using the Only Activated Documents ![]() and Only Activated Codes
and Only Activated Codes ![]() icons found in the upper left corner of the Grid's workspace.
icons found in the upper left corner of the Grid's workspace.
MAXQDA also gives you the flexibility to choose whether to include comments and memos and whether to visualize the coded segments' origins.
The segments coded in the Summary Grid are linked to the original document. Clicking on one will highlight the respective segment in the "Document Browser" window. This can be particularly helpful if you need to contextualize a coded segment and inform your summaries.
How to use AI Assist for summary generation
MAXQDA's AI Assist, an AI-powered virtual assistant, is designed for ease of use. It offers various functionalities that can help you at various other stages of your research. In this section, we zoom in on its ability to summarize coded segments directly within the Grid. This intuitive feature allows you to approach your data from a new angle.
The benefits of using AI Assist's summary function
AI Assist provides numerous analytical benefits. It offers a descriptive summary of coded segments based on content. By comparing this summary with your own, it can help identify patterns and themes that may have been overlooked. Furthermore, it provides a fresh perspective on your data, which can inform and refine your analysis.
To summarize with AI Assist in the Grid:
- Navigate to Analysis > Summary Grid in the main menu.
- Choose the blue node corresponding to the coded segments you want to summarize.
- Start AI Assist by clicking on the corresponding icon
 in the toolbar of the "Summary" panel at the bottom right of the Grid's workspace.
 - Then, adjust the summary preferences in the dialog box according to your needs. Once you have done som you can hit OK to generate the summary.
- If needed, edit the AI-generated summary accordingly.
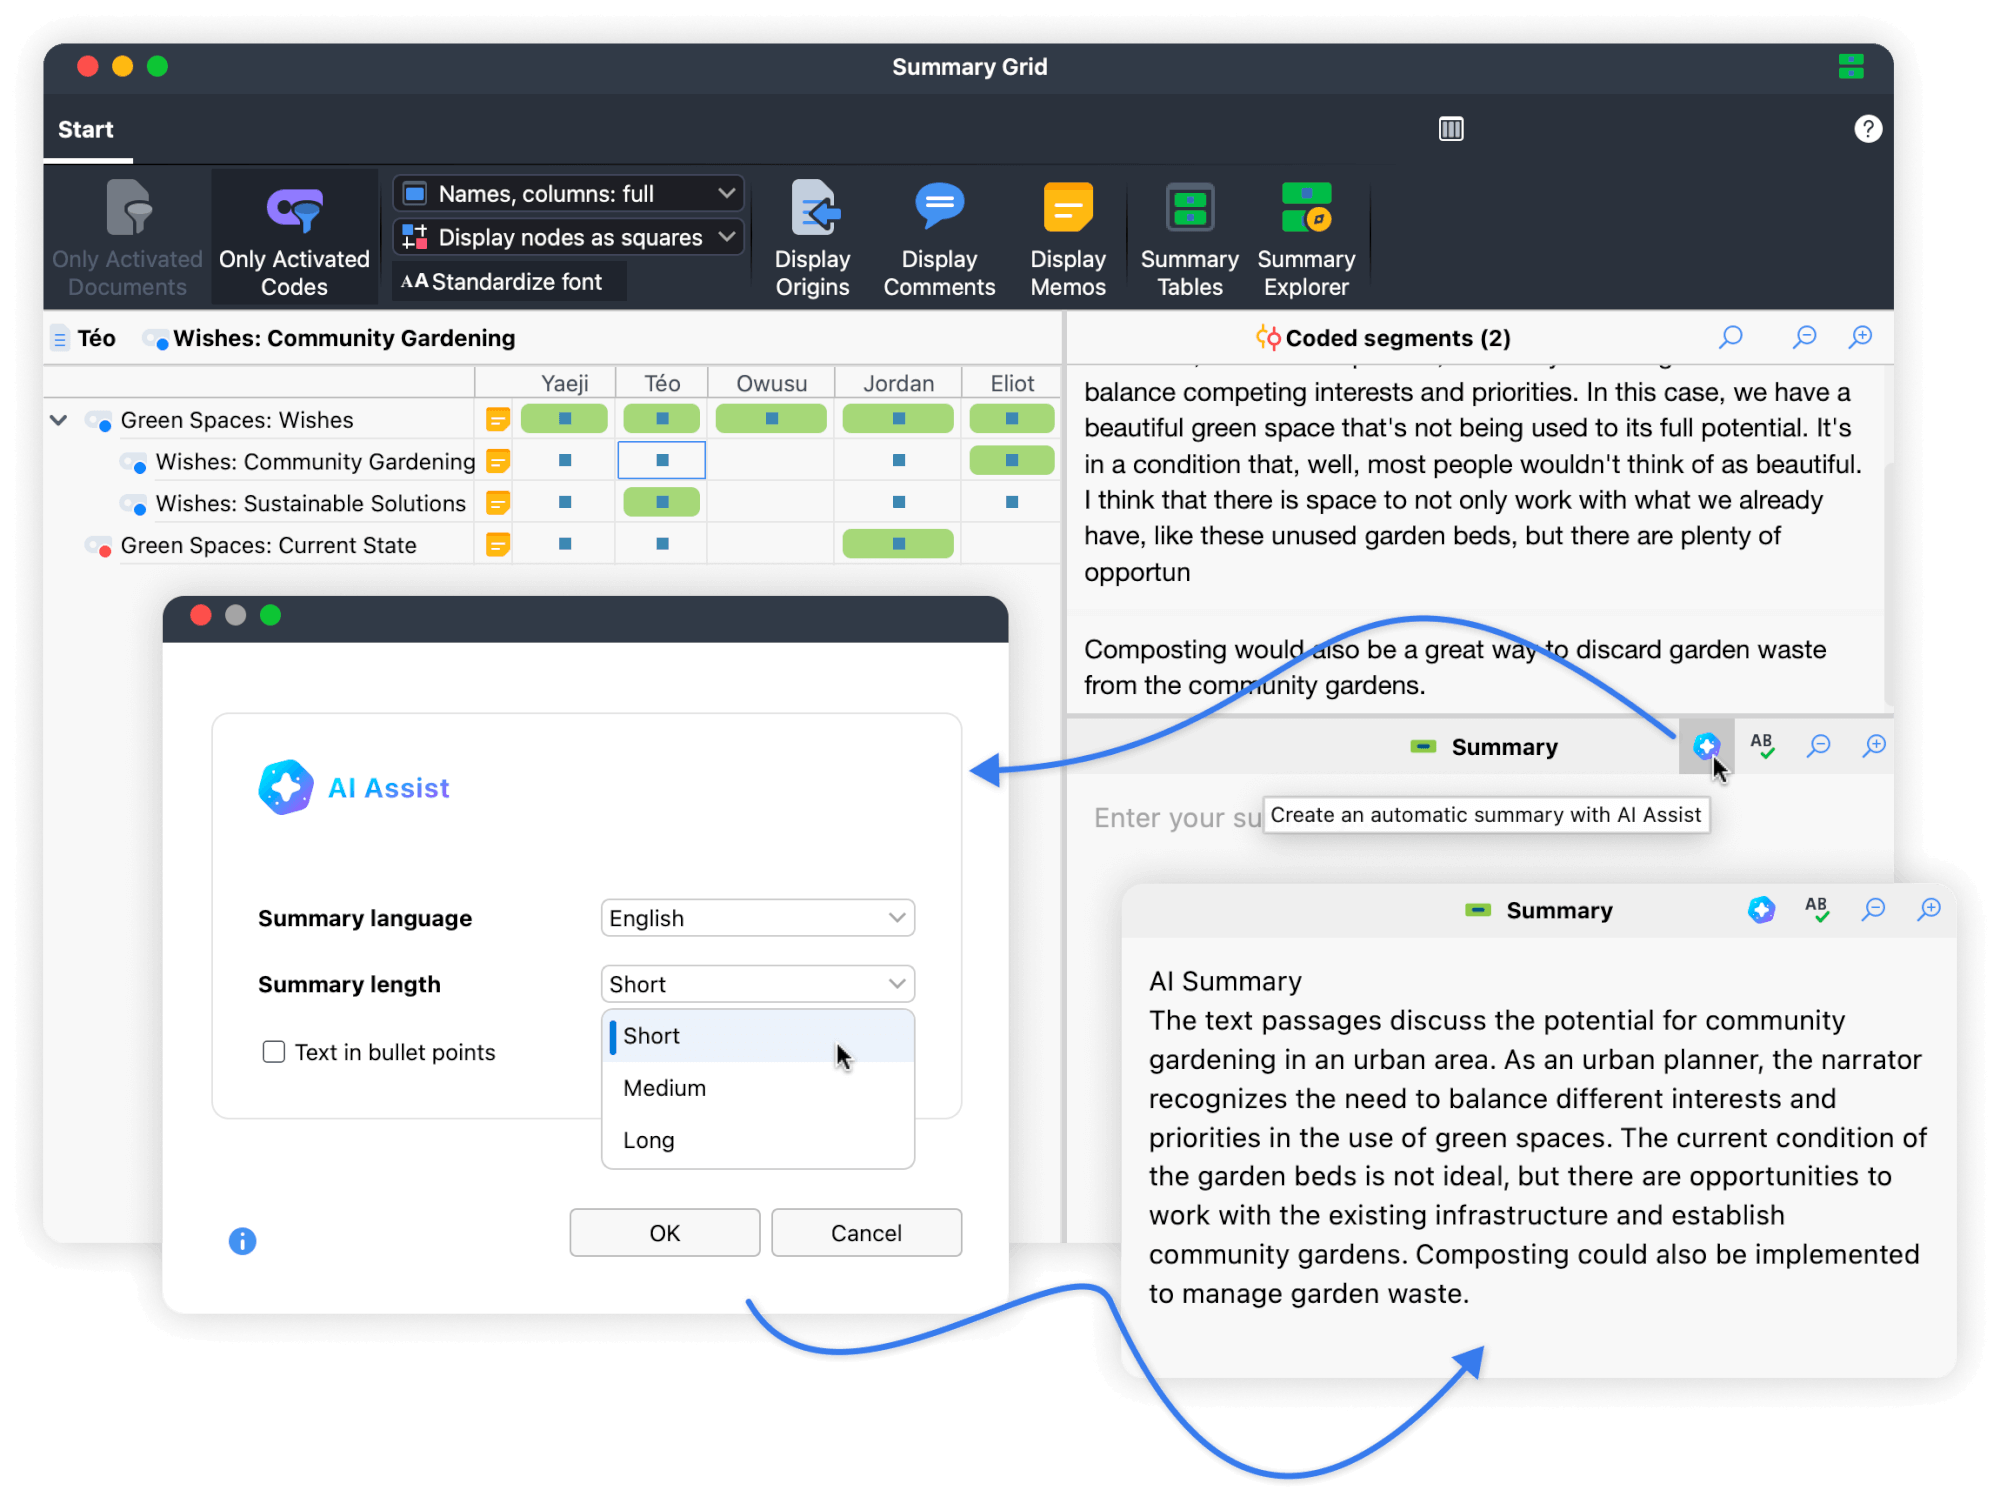
When working with AI Assist, keep the following tips in mind:
- Think of AI Assist as a collaborator:
Think of AI Assist as a partner that can provide suggestions and ideas to support your analysis. Use the AI-written summaries as a starting point for further exploration, refinement, and interpretation. - Refrain from over-relying on AI Assist:
Remember that AI Assist is designed to augment human judgment, not replace it. Always review and critically evaluate the suggestions provided by AI Assist, refining and editing the summaries to ensure they accurately reflect your understanding of the data. - Keep track of AI-generated content:
Clearly distinguish between summaries generated by AI Assist and your writing. This is essential for maintaining the integrity of your analysis and ensuring proper attribution of the summaries. You can easily identify AI-generated summaries by looking for the 'AI Summary' label at the top.
Stage Two: Summary Tables for effective reporting
In Action Research, the goal is to actively engage with stakeholders to identify problems and develop solutions that address their specific needs and concerns.
As mentioned previously, Summary Tables are a valuable tool in the Action Research toolkit. These tables compile summaries and document variables from selected documents and codes, providing a concise overview of the data. This allows for easy access to both the summaries and the underlying raw data, which are interactively linked to the table. They are particularly useful when reporting findings as they gather all the created summaries in one table.
For example, a summary table might reveal that safety is a recurring concern in both sets of summaries, but that it is more pronounced in the data coded 'Green Spaces: Wishes,' which might lead one to think that community members want to see improved lighting rather than express disatisfaction with the lack of lighting. Having an overview of your summaries like this makes writing your report a lot easier.
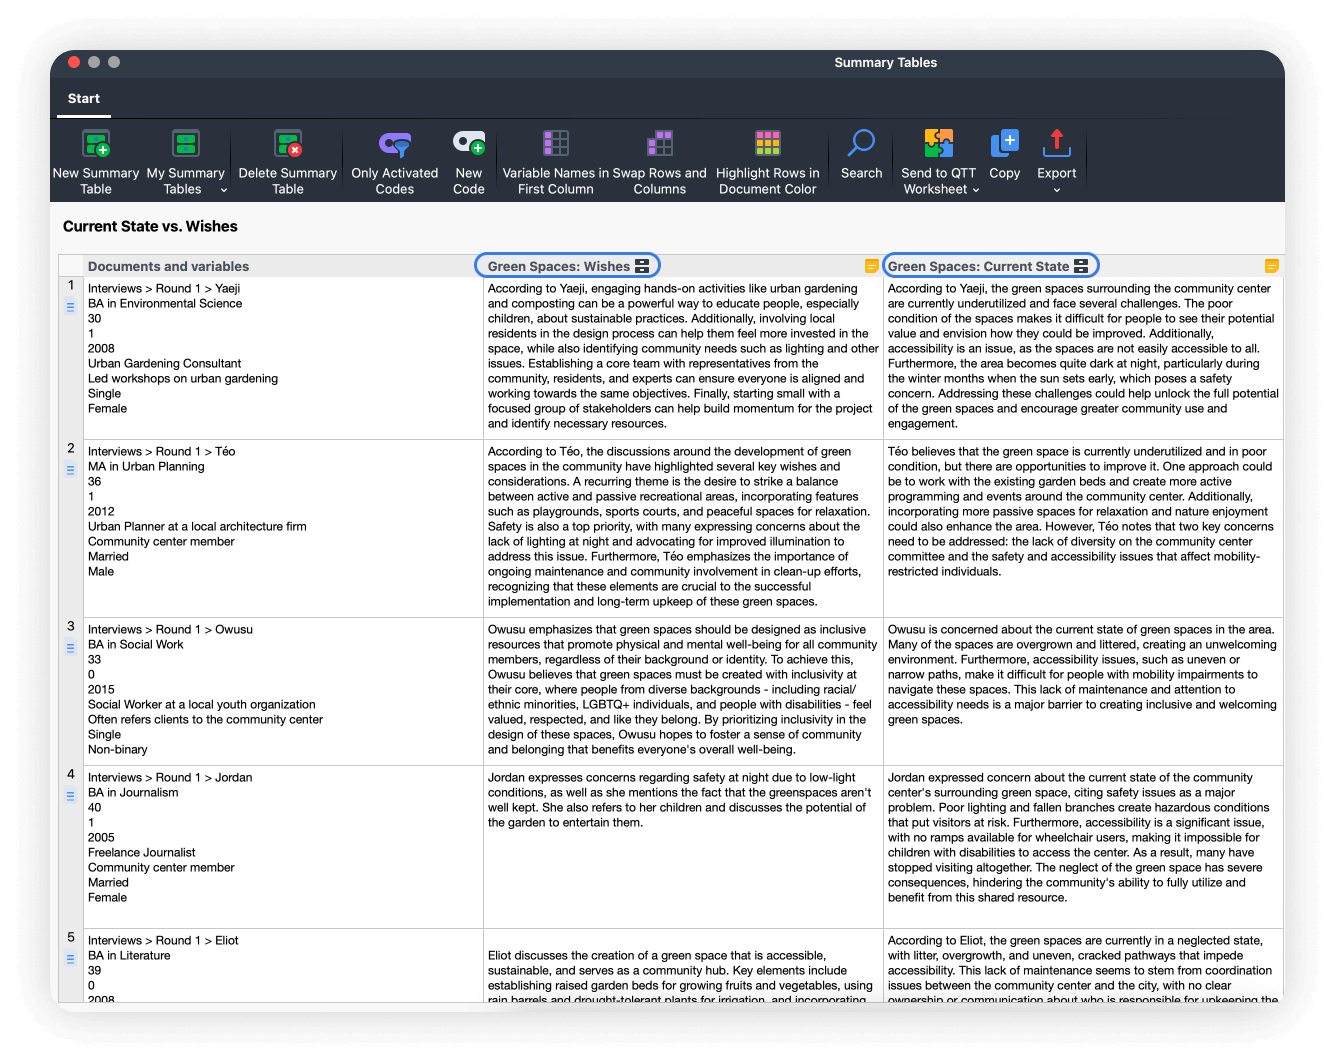
To create a Summary Table, follow these steps:
- Click on Summary Table to launch its workspace either in the Summary Grid's toolbar or the Analysis menu.
- Select New Summary Table.
- Choose documents and codes to include in the table using the 'Choose documents and codes' tab.
- Select the document variables to output as supplementary information in the 'Choose variables' tab.
- Change the title of your table by clicking on the editing icon
 . Tables are saved automatically.
The documents you have chosen will be displayed in the rows of the table, while the codes you've selected will be displayed in the columns. Each code will have its summary listed in the respective code column for each document. Variable values can be shown under each document name or in extra columns, providing a clear and organized view of your data. This will assist you in writing your reports, creating presentations, or designing your MAXMaps.
Action Research with MAXQDA: A conclusion
In conclusion, MAXQDA is a versatile powerhouse for qualitative data analysis, empowering researchers like yourself to conduct Action Research seamlessly. So, whether you are about to embark on a journey of discovery, reflection, or transformation, MAXQDA serves as your guiding light, illuminating pathways to deeper insights, informed action, and positive change.
The journey awaits you!
About the author

Xan (he/him) recently completed a master’s degree in sociology at Freie Universität Berlin. He now works at VERBI Software as a product manager, working on product documentation and localization processes.
Literature about MAXQDA
We offer a variety of free learning materials to help you get started with MAXQDA. Check out our Getting Started Guide to get a quick overview of MAXQDA and step-by-step instructions on setting up your software and creating your first project with your brand new QDA software. In addition, the free Literature Reviews Guide explains how to conduct a literature review with MAXQDA.

