The comparative analysis of cases and groups is one of the most important techniques of qualitative research. In MAXQDA there are numerous possibilities to compare the data material, for example to display only the statements of certain groups of persons in the "Retrieved Segments" or to compare visualizations, such as Document Portraits, for different cases.
The MAXQDA function Compare Cases & Groups allows you to easily compare coded data (qualitative data) and code frequencies (qualitative data transformed into quantitative data) for cases and groups. From the “Document System”, you can include documents or focus group speakers as cases and document groups as well as document sets as groups in the comparison.
Perform quantitative comparison
A group comparison for code frequencies is performed as follows:
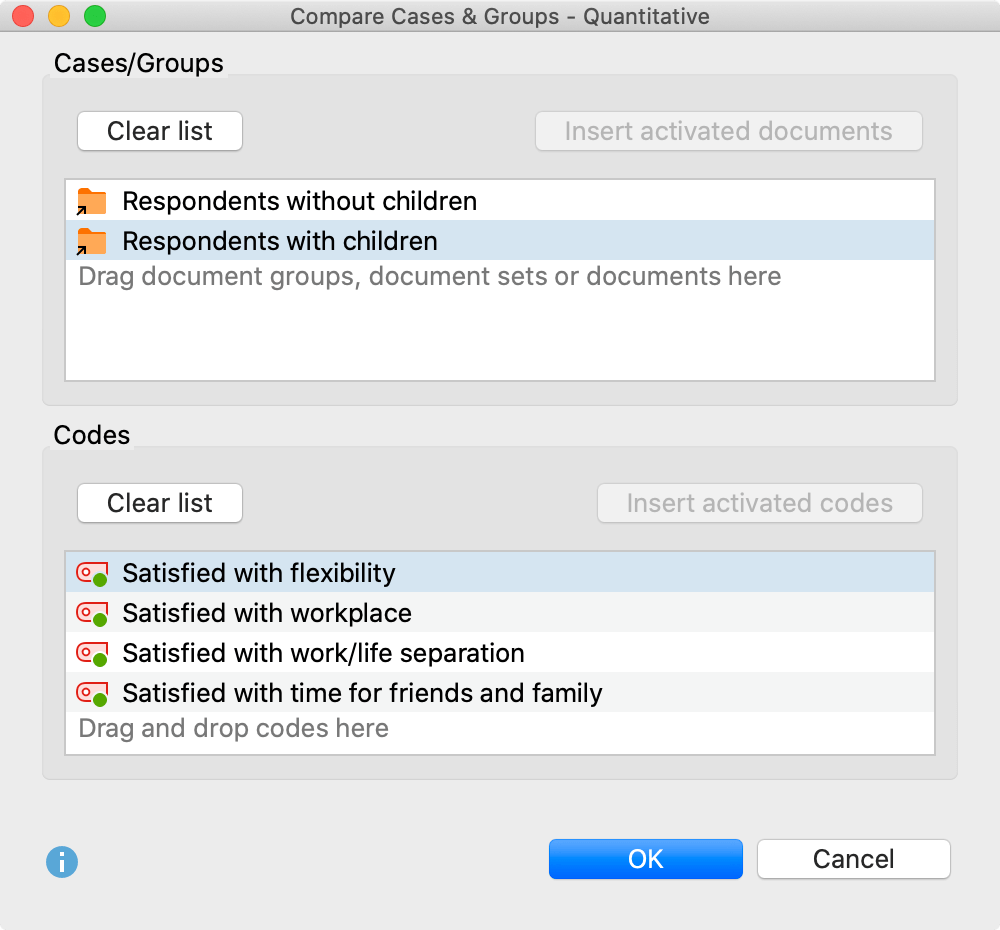
- Open the function Analysis > Compare Cases & Groups > Quantitative. An options dialog window will appear with two sections:

- Drag at least two document groups, document sets, individual documents or focus group speakers from the "Document System" into the upper "Groups" area. You can also combine document groups, document sets, documents, and focus group speakers. Entries can be deleted at any time by clicking on the X at the end of a line.
- Drag several codes from the "Codes" into the bottom "Codes" area. Click on the Insert activated codes button to add all activated and not yet selected codes below. You can adjust the sequence of the codes later by holding down the mouse button.
Click on OK and MAXQDA creates a crosstab. The selected groups form the columns and the selected codes the rows of the matrix:

