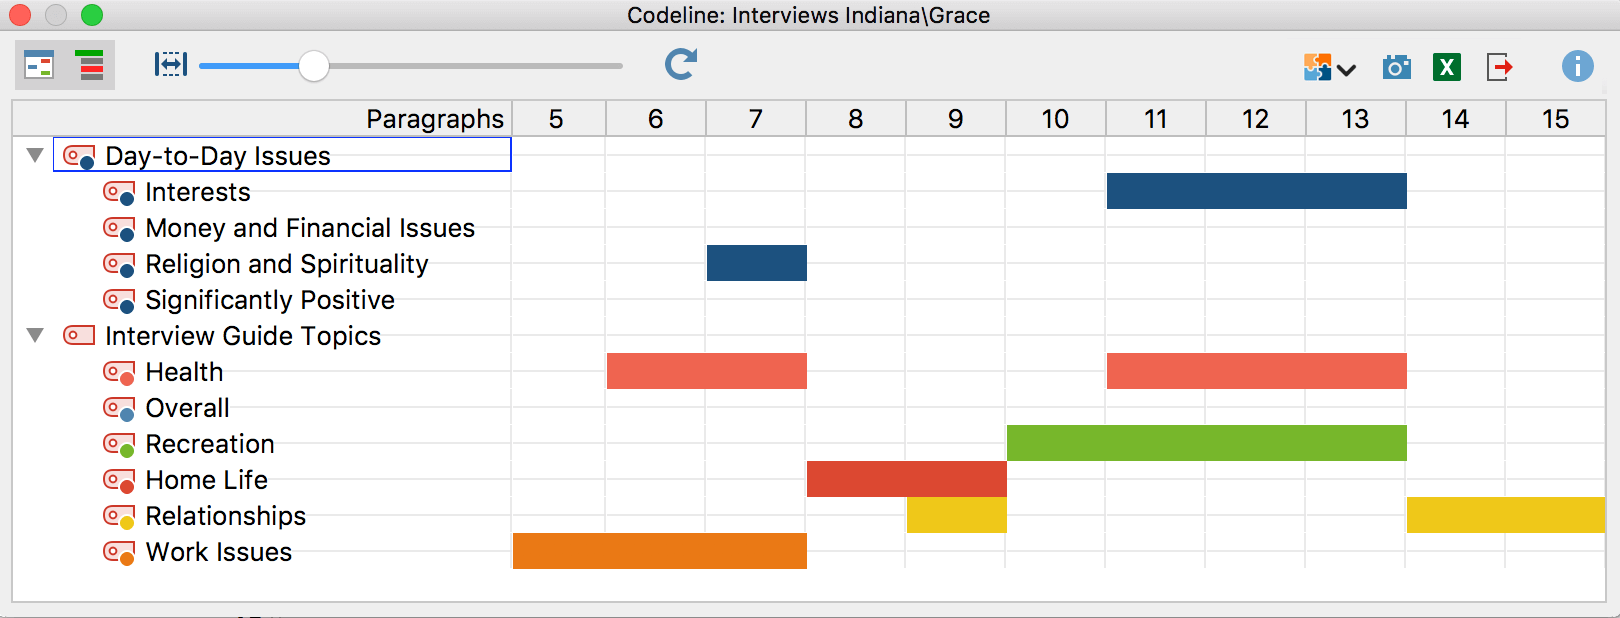
The Codeline is a case-based visual function that displays a sequential view of a document’s coded segments. The Codeline visualization is available for texts, PDF documents, tables and also for videos. The picture is quite similar to that of a score of a piece of music. For a text, the columns display its paragraphs, starting with paragraph 1 and ending with the last paragraph of the particular text. The rows display the codes. The cells of the Codeline are filled with a color if the code has been assigned to the paragraph.
The basic idea behind the visualization can be seen below. There are 12 paragraphs and three codes shown. You can see that nothing was coded in the first paragraph of any of the documents. In the second, eleventh, and twelfth paragraph, Code1 is used. In paragraph five, both Code2 and Code3 were used. This shows you already how you can use this visualization. It gives you a visual overview of a document, so for the phases of an interview, you can quickly identify which codes appear and co-occur.
| Paragraph | ||||||||||||
| 1 | 2 | 3 | 4 | 5 | 6 | 7 | 8 | 9 | 10 | 11 | 12 | |
| Code1 | ■ | ■ | ■ | |||||||||
| Code2 | ■ | ■ | ■ | ■ | ■ | |||||||
| Code3 | ■ | ■ | ■ | ■ | ||||||||
You can open MAXQDA's Codeline either
- via the main ribbon menu: Visual Tools > Codeline or
- by selecting Codeline in the context menu for a text, table, or PDF document
Codeline options
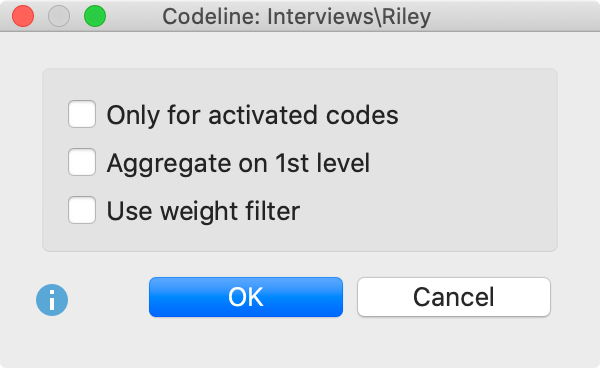
When you call up the Codeline, MAXQDA offers the following options:
Only for activated codes – this limits the codes to be included in the visualization to those that you have already activated in the “Code System”. If you have activated a subcode, also its parents will be integrated into the visualization.
Aggregate on the 1st level – this option means that only top-level/parent codes will be visualized. The subcodes of each parent code will be handled as if they were instances of the parent code.
Use weight filter – if you select this option, MAXQDA will open another dialog after clicking OK, in which you can set a range for the coding weight. Only those segments, that fit into this range will be displayed in the Codeline.

Codeline display
Unlike the Document Portrait, the Codeline tool can be used even if you have not associated meaningful colors to your codes. The Codeline graphics display the color, but if you have not selected colors, only green symbols will be displayed. The function of Codeline is to show where in a document the different codes have been applied, and this diagram also makes sense and can be interpreted without color differentiation.
What can the Codeline be used for?
- Codeline gives a good overview of the coding and can therefore be used universally.
- The diagram may be of use for exploration – just follow a particular code, see when it appears and which other codes appear near it.
- The opportunity to display only selected codes enables comparing two or more codes in the course of an interview.
- When analyzing focus groups, you can see at a glance which speakers react to each other and what the topics are in relation to the speakers.

What does MAXQDA's Codeline display?
- MAXQDA's Codeline creates a "codes x paragraphs" table for texts.
- The codes are listed in the sequence of the text's paragraphs, starting with the first paragraph, i.e. the beginning of the text. The paragraphs form the X-axis, i.e., the diagram has exactly as many columns as the text has paragraphs.
- If a code has been assigned within the paragraph, you will see its code color depicted as a rectangle in the corresponding column. If codes have been assigned to several paragraphs consecutively, you will see a continuous bar.
- When a parent code is collapsed, the subcodes are added to this parent code and displayed in the color of the parent code.
The Codeline function is available for all document types that MAXQDA supports, except for images. Depending on the document type, different units will be used for the columns:
| Text | paragraphs lines, if line numbering has been set for a text in the "Document Browser" |
| Table | rows |
| pages | |
| Audio and Video file | seconds or minutes for files not longer than 10 minutes minutes for files longer than 10 minutes |
Display options
Above the Codeline you will see a toolbar, which offers several options for the display:
![]() Codeline for linked media file – This option is displayed only when the Codeline is opened for a text document that has an audio or video file associated with it. Turn this option on to create the Codeline for the associated media file.
Codeline for linked media file – This option is displayed only when the Codeline is opened for a text document that has an audio or video file associated with it. Turn this option on to create the Codeline for the associated media file.
![]() Standardize width of units and color them completely – If you select this option, all paragraphs (resp. lines) of a text document will be displayed with the same width, independent from their length. Furthermore, the whole paragraph width will be filled with the color of the code, no matter how large or small the coded segments within this paragraph are.
Standardize width of units and color them completely – If you select this option, all paragraphs (resp. lines) of a text document will be displayed with the same width, independent from their length. Furthermore, the whole paragraph width will be filled with the color of the code, no matter how large or small the coded segments within this paragraph are.
For the other document types, the behavior is as follows when the option is enabled:
- For tables, the table rows are displayed with the same width and each table row containing a code is visualized as if it were fully coded with the code.
- For PDF documents, the pages are displayed with the same width and each page containing a code is visualized as if it were fully coded with the code.
- Audio and video files already have standardized units (seconds and minutes), so there is no standardization. However, each second or minute is visualized as if it were fully coded with the code.
![]() Display codes with hierarchy – If the option is activated, the codes are displayed in the tree structure of the code system. Even if the “Only activated codes” option is selected, non-activated upper codes are also included to preserve the tree structure. If the option is deactivated, all codes are displayed on one level. If the “Only activated codes” option is activated, then only the activated codes are displayed.
Display codes with hierarchy – If the option is activated, the codes are displayed in the tree structure of the code system. Even if the “Only activated codes” option is selected, non-activated upper codes are also included to preserve the tree structure. If the option is deactivated, all codes are displayed on one level. If the “Only activated codes” option is activated, then only the activated codes are displayed.
![]() Fit to window width - Selecting this option will “compress” the Codeline into the horizontal space of the window. This is very helpful for any publication in which you want to include an image of the whole Codeline, but in which the space is usually limited to a single page. The proportions of the visualized coded segments will stay the same, only very short coded segments get a special treatment: they will be reduced to a minimum of a thin vertical line only, but will not be excluded from the view.
Fit to window width - Selecting this option will “compress” the Codeline into the horizontal space of the window. This is very helpful for any publication in which you want to include an image of the whole Codeline, but in which the space is usually limited to a single page. The proportions of the visualized coded segments will stay the same, only very short coded segments get a special treatment: they will be reduced to a minimum of a thin vertical line only, but will not be excluded from the view.
You can use the slider next to the icons to adjust the column width.
Interactive link with source files
The display of the coded segments is interactive. If you hover the mouse over a symbol, a short information window appears with the code or subcode name and the position. Double-clicking on in the Codeline highlights the corresponding segment(s) in the “Document Browser” or “Multimedia Browser”.
Store view in Questions – Themes – Theories
In the Questions – Themes – Theories window, you can collect and comment on all the important results of your project. Click the ![]() Send to QTT Worksheet icon in the upper right corner to save the current view in a new or existing worksheet.
Send to QTT Worksheet icon in the upper right corner to save the current view in a new or existing worksheet.
Exporting Codeline
In the toolbar, there are two icons on the right that can be used to export the display:
![]() Copy current display as an image to clipboard - Copies the current view to the clipboard so that you can easily paste the display into reports or presentations by, for example, using Ctrl+V (Windows) or ⌘+V (macOS).
Copy current display as an image to clipboard - Copies the current view to the clipboard so that you can easily paste the display into reports or presentations by, for example, using Ctrl+V (Windows) or ⌘+V (macOS).
![]() Export - Exports the whole Codeline as a graphics file.
Export - Exports the whole Codeline as a graphics file.
