Take your mixed methods research to the next level with MAXQDA
MAXQDA is the best choice for your mixed methods analysis. It works with a wide range of data types and offers powerful tools such as coding, visualization, mixed methods, statistical, and quantitative content analysis tools. Whether you are a first-time researcher or an old pro, MAXQDA is your professional software solution with advanced tools for you and your team.
How to use MAXQDA for your mixed methods research
Researchers use mixed methods designs to gain a more comprehensive understanding of a research problem or topic by combining the analysis of qualitative (non-numerical data that provides more in-depth and nuanced insights) and quantitative (numerical data that can be analyzed statistically) data in a single research project. MAXQDA as the #1 software for mixed methods research provides numerous tools to evaluate both types of data. Analyzing both qualitative and quantitative data leads to numerous analysis possibilities. Therefore, you should carefully plan your approach and familiarize yourself with mixed methods designs. See our FAQs for an introduction in mixed methods designs.
Step one: Import your data
Conducting mixed methods research with MAXQDA is easy because MAXQDA allows you to import a wide range of data types. Import qualitative data such as text documents, interview transcripts, focus groups, web pages, images, audio and video files, bibliographic data, social media date, such as YouTube data. Of course, you can easily import quantitative data as well such as Excel spreadsheets, and surveys. Alternatively, you can create quantitative data within MAXQDA. For example, you can easily create variables and quantize your qualitative coding information.
With MAXQDA importing your files is easy. Simply drag the files into MAXQDA’s “Document System” window or go to the Import tab and choose the corresponding file format.

Step two: Analyze your data
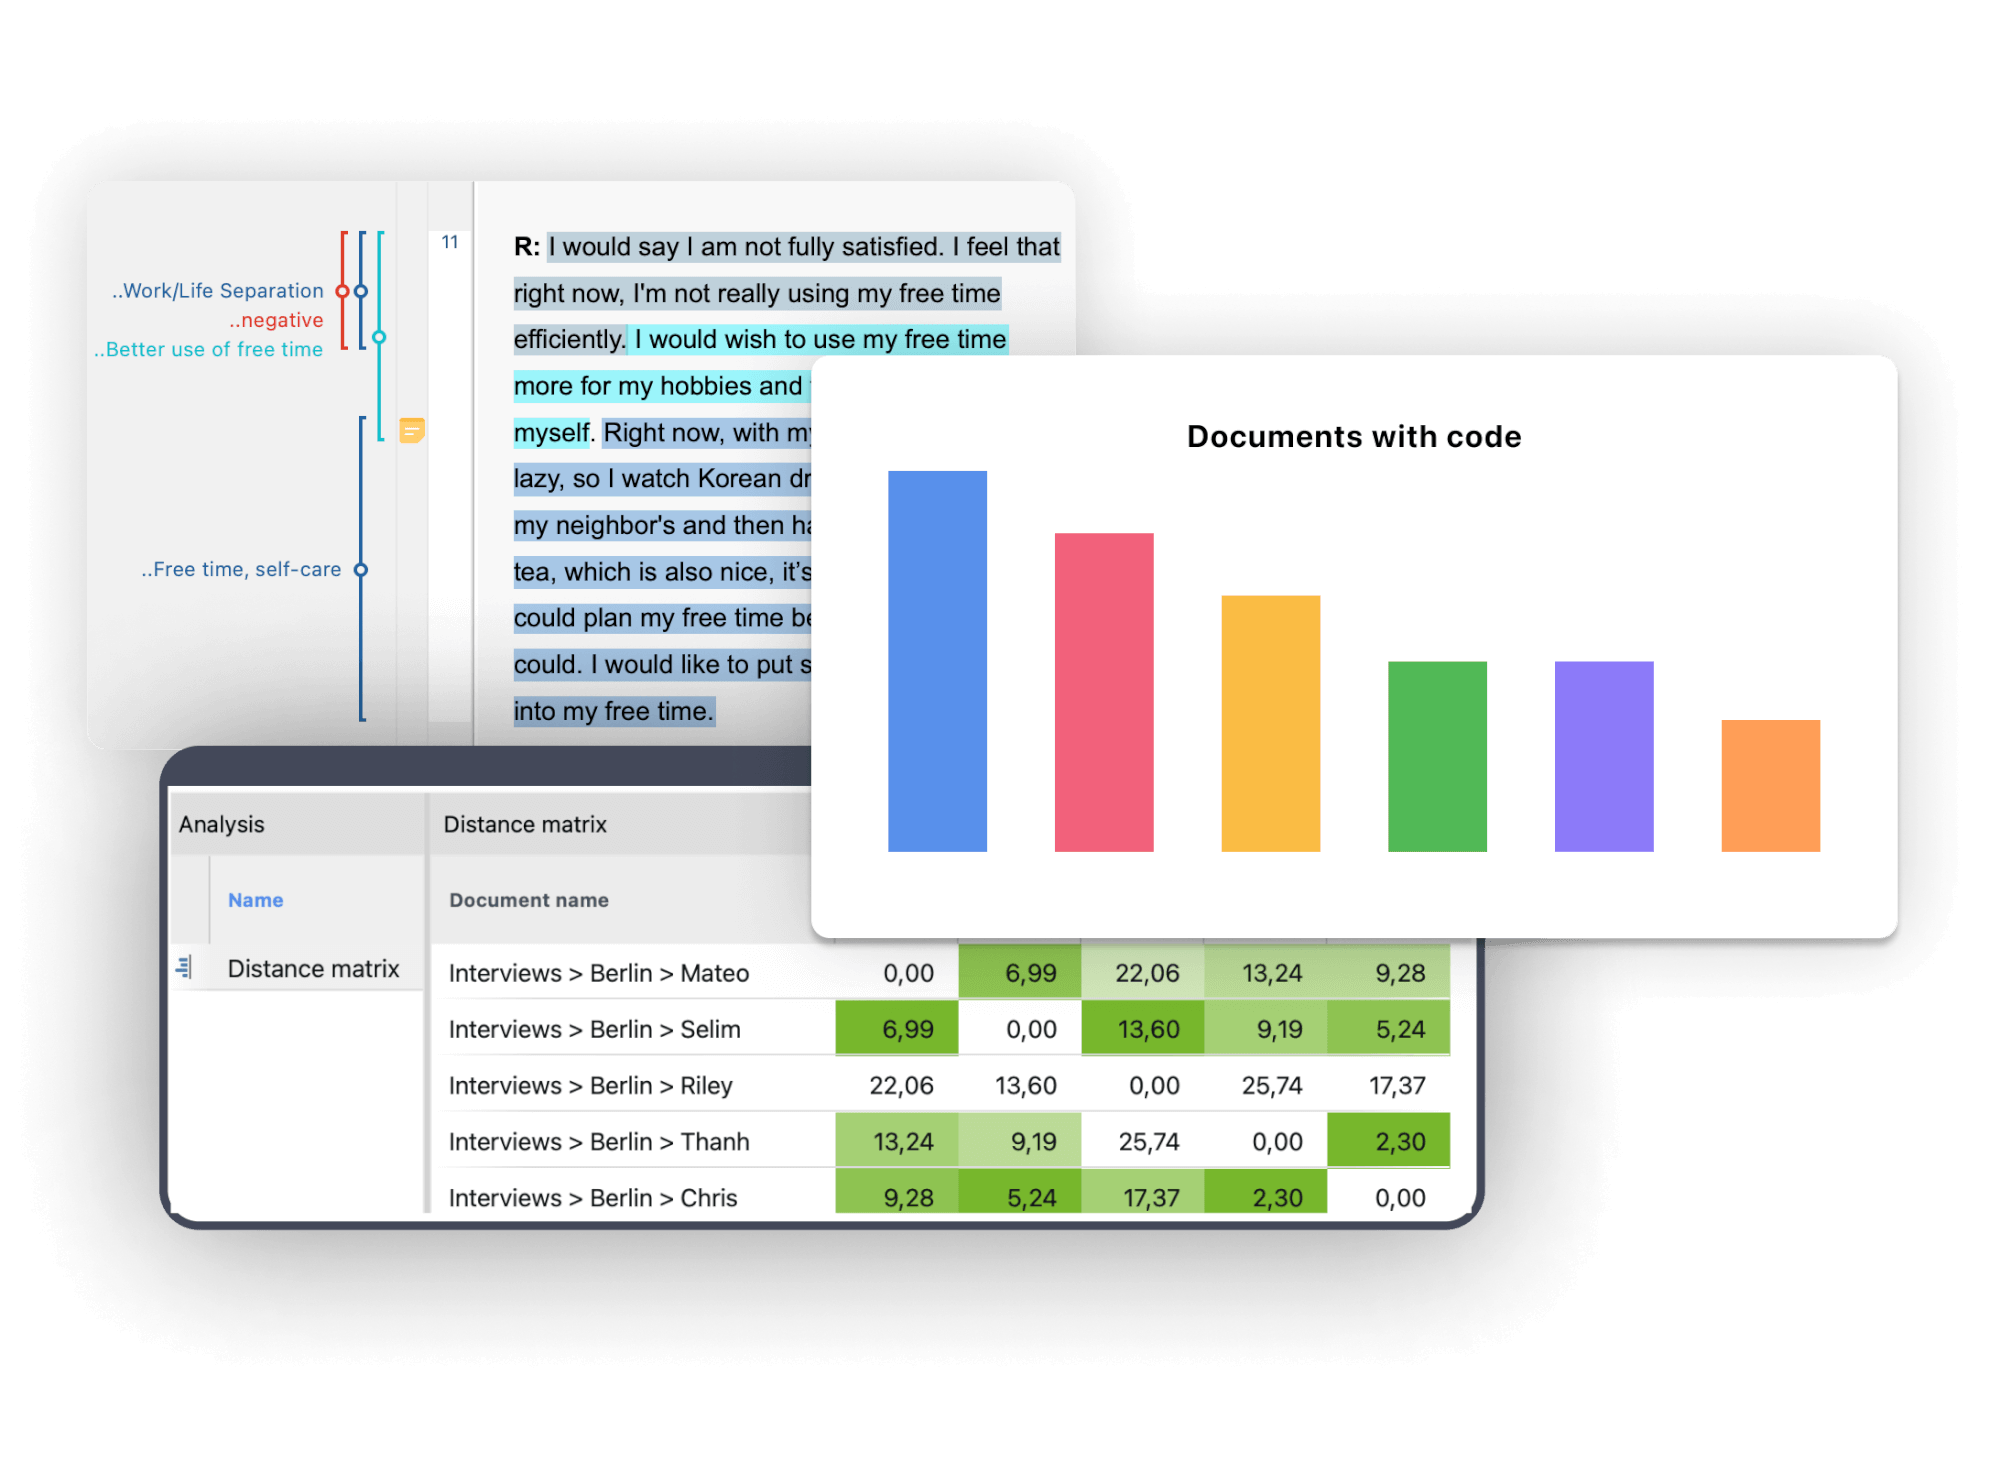
With MAXQDA you have numerous possibilities for analyzing your qualitative as well as your quantitative data – impossible to mention all of them. Often, qualitative data, such as text documents, are coded which means that text segments are labelled with one or more categories. Alternatively, qualitative data is explored by searching for certain words or word combinations, or by paraphrasing the text. At a later analysis stage, the text or the coded segments are aggregated, and the results are visualized.
For quantitative data analysis, MAXQDA offers frequency tables and charts, crosstabs, and even an entire module, called MAXQDA Stats, for statistical comparisons such as descriptive statistics, inferential statistics, cluster-analysis, correlations and much more. For mixed methods analysis, MAXQDA offers an entire tab full of tools perfectly suited for mixed methods approaches.

Step three: Integrate your qualitative and quantitative data and results
An important step in mixed methods research approaches is the integration of qualitative and quantitative data and results. Depending on your mixed methods design the integration takes place at a different stage of your analysis, as described by Kuckartz und Rädiker (2019, 2021). When using a sequential design, the integration occurs sequence-based. The results of the qualitative or quantitative sub-study are used to inform and guide the second sub-study. Independent of your mixed methods design, the integration can take place on the level of results. The qualitative and quantitative results are combined which allows to make meta-inferences and ultimately to gain a more complete understanding of the research problem. In contrast, for data-based integration the qualitative and quantitative data is pooled and analyzed in parallel. This requires that the data can be assigned to cases or groups.
With MAXQDA you are free to choose on which level you want to integrate your qualitative and quantitative data. MAXQDA offers a variety of tools to support the integration process, such as Joint Displays, Crosstabs, Typology tables and more which will be presented in the following.

How to use MAXQDA for your mixed methods research
MAXQDA is the mixed methods expert. With MAXQDA as your mixed methods software, you can easily combine qualitative and quantitative methods to get an even deeper insight into your data. MAXQDA offers numerous tools and functions that you can use to enhance your mixed methods analysis. For example, MAXQDA offers an entire tab dedicated to mixed methods research with tools designed to facilitate mixed methods research; MAXDictio includes many quantitative text analysis tools that allow you to explore the content and structure of your texts; and MAXQDA Stats offers an entire module dedicated to statistical analysis. Thus, we can present only a subset of tools here. Check out our literature about performing literature reviews with MAXQDA to discover more possibilities.
Quantitizing of qualitative coding information
Coding qualitative data lies at the heart of many qualitative data analysis approaches. Coding refers to the process of labeling segments of your material. In a later step, MAXQDA allows you to compile all text segments coded with one (or more) codes of interest from one or more documents. But there is more. MAXQDA offers multiple ways of coding, such as in-vivo coding, highlighters, emoticodes, Creative Coding, or the Smart Coding Tool.
As your all-in-one Mixed Methods Software, MAXQDA allows you to import and explore quantitative data as well. Easily import quantitative data matrices from statistics software packages like SPSS or Excel spreadsheets and explore them with MAXQDA’s mixed methods tools. You can also turn your codes into variables to perform statistical analyses, and automatically or manually assign variables to your data. Of course, you can also export your data matrices from MAXQDA to statistics software packages like SPSS.


Create and compare groups
With MAXQDA you have many possibilities to create and compare groups of documents. For example, you can group interviewees based on variables or code frequencies. With MAXQDA as your mixed methods software, you can easily compare the code frequencies of various groups with each other or identify and quantify similarities or dissimilarities in code frequency across your data. Calculate various variables and their percentages for qualitative typologies. Especially useful for mixed methods research are MAXQDA’s joint displays that visualize integrated data and/or results.
Aggregate your data
A mixed methods research project can be overwhelming, but with MAXQDA as your mixed-methods software, you have an easy-to-use solution. For example, you can use AI Assist which supports you with numerous functions to automatically summarize elements of your research project. Among other tools, MAXQDA’s overview and summary tables are especially useful for aggregating your analysis results. MAXQDA offers overview tables for almost everything, codes, memos, coded segments, links, and so on. Use our summary grids and summary tables to keep summaries of which codes and variables appear in each respective project or document: another level of analysis that means you will never lose track of the bigger picture. Of course, you can easily export your overview and summary tables and integrate them into your publication.


Quantitative evaluation of themes
Quantitative aspects can also be relevant in a qualitative research project. Using MAXQDA as your state-of-the-art mixed methods software enables you to employ a vast range of procedures for the quantitative evaluation of your material. You can sort sources according to document variables, compare amounts with frequency tables and charts, and much more. Make sure that you do not miss the word frequency tools of MAXQDA’s add-on module for quantitative content analysis. Included are tools for visual text exploration, content analysis, vocabulary analysis, dictionary-based analysis, and more that facilitate the quantitative analysis of terms and their semantic contexts.
Visualize qualitative and quantitative data
As an all-in-one mixed methods software, MAXQDA offers a variety of visual tools that are tailor-made for analyzing qualitative data as well as quantitative data. Create stunning visualizations to analyze your material. Of course, you can export your visualizations in various formats to enrich your final report. Visualize the progression of an interview with the Codeline, use the Code Cloud to illustrate and explore your categories, or make use of the graphical representation possibilities of MAXMaps, which in particular permit the creation of concept maps. Thanks to the interactive connection between your visualizations with your MAXQDA data, you will never lose sight of the big picture.


QTT: Synthesize your results and write up the review
MAXQDA has an innovative workspace to gather important visualization, notes, segments, and other analytics results. The perfect tool to organize your thoughts and data. Create a separate worksheet for your topics and research questions, fill it with associated analysis elements from MAXQDA, and add your conclusions, theories, and insights as you go. For example, you can add Word Clouds, important coded segments, and your literature summaries and write down your insights. Subsequently, you can view all analysis elements and insights to write your final conclusion. The Questions-Themes-Theories tool is perfectly suited to help you finalize your mixed methods analysis. With just one click you can export your worksheet and use it as a starting point for your final report.
Literature about mixed methods research with MAXQDA
We offer a variety of learning materials to help you get started with your mixed methods research project. Check out our Getting Started Guide to get a quick overview of MAXQDA and step-by-step instructions on setting up your software and creating your first project with your brand new QDA software. For a comprehensive book about mixed methods approaches check out the book by Udo Kuckartz.
Getting Started with MAXQDA
Get the guide
Mixed Methods
by Udo Kuckartz