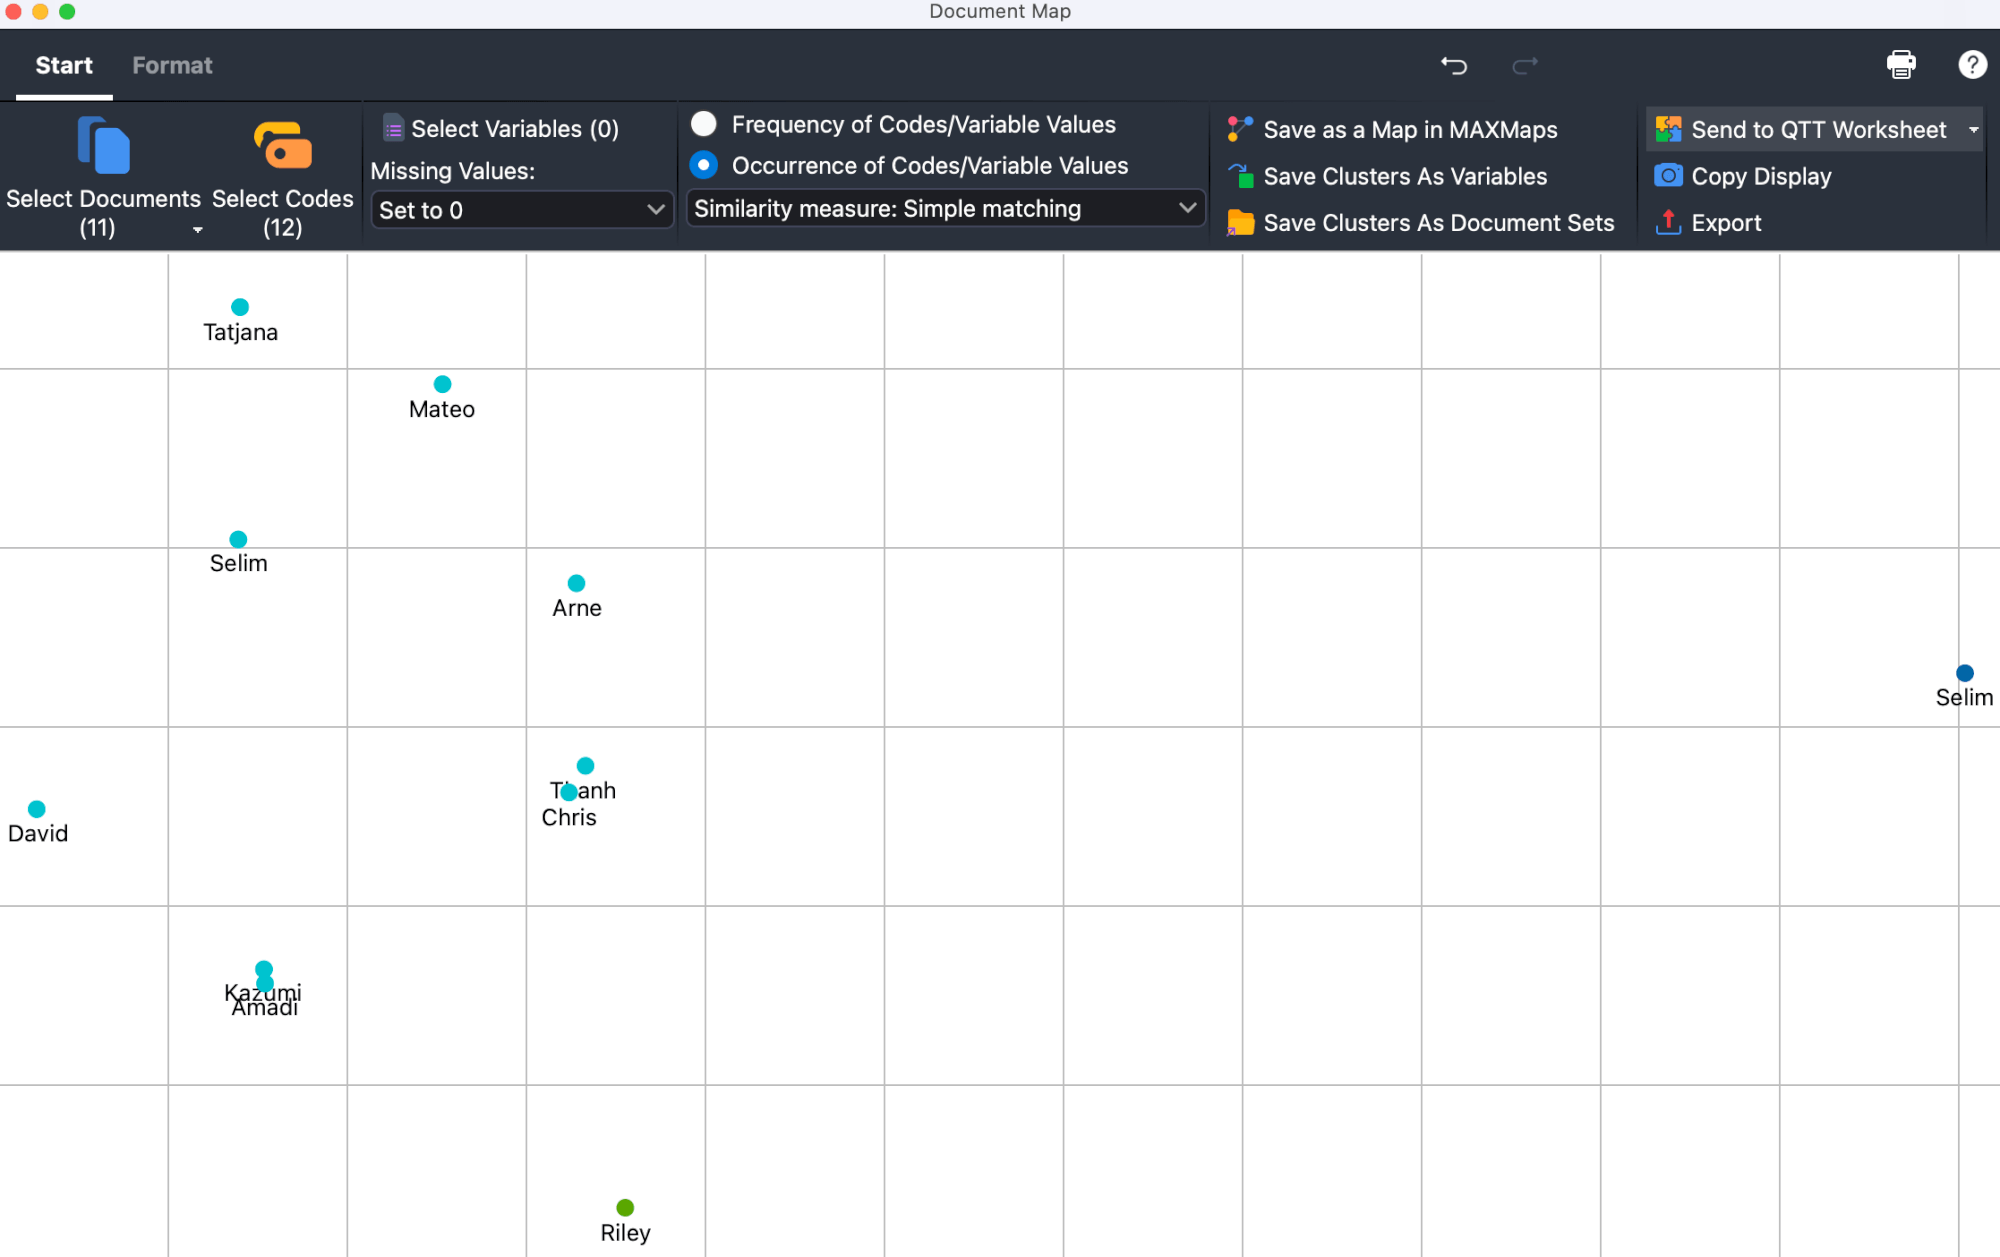
The Document Map is a visual tool that displays selected documents as though they were arranged on a map. The greater the similarity between two documents with regard to codes assigned to them, the closer their circle symbols are located to each other; the less similar they are, the further away they are from each other. If required, the variable values of the documents can also be taken into account when determining their similarity. Documents that are similar in terms of their code assignments and variables can be marked with matching colors. Optionally, the size of the circles themselves can be set to reflect the number of code assignments made in the respective document.

The Document Map is an ideal tool for visual grouping of cases (documents) and can serve as a basis for building typologies or more in-depth explorations of the identified groups.
Generating a Document Map
To generate a Document Map:
- Select Visual Tools > Document Map in the MAXQDA main menu. An empty document map will appear with its own menu.
- In the Document Map window, under Start > Select Documents, select the documents you want to place on the map.
- Via Start > Select Codes, select the codes you want to take into account when determining the similarity between documents.
MAXQDA will now place all the selected documents on the map.
Select the analysis mode
Two different modes can be selected in the Start tab to determine the distances between the documents:
Frequency of Codes/Variable Values – The frequency with which a code has been assigned in a document is taken into account. So if the code "Parents" was assigned twice to Document A and three times to Document B, this is considered a difference.
Occurrence of Codes/Variable Values – Only whether a code has been assigned to a document at all is taken into account. In the above example, Documents A and B would count as identical with regard to the code "Parents", because the code was assigned in both cases – how often the code was assigned does not matter here.
Depending on the selected calculation mode, different similarity or distance measures can be selected. These are described in detail in the Similarity Analysis for Documents section.
Taking variable values into account
By clicking on the Start > Select Variables icon, you can select document variables to be taken into account when determining the similarity between documents, in addition or as an alternative to codes. If the calculation mode “Frequency of Codes/Variable Values” is selected in the Start tab, variables of the types “Integer” and “Decimal” can be selected. If the variant “Occurrence of Codes/Variable Values” is selected, variables of the types “Text”, “Date” and “Boolean” can be selected.
As there may be missing values for the selected documents in a document variable, you have the option of choosing between two alternatives as to how to proceed in this case:
Missing values: Set to 0 – The variable value is set to 0. Selecting this option usually only makes sense in the Frequency of Codes/Variable Values mode.
Missing values: Exclude Documents – Documents with at least one missing value for the selected variables are not placed on the map. In brackets behind this option, you can see how many documents are affected and therefore not visible on the map.
Document Map interactivity
The Document Map is interactive:
- Click on a document to select it in the "Document System".
- Double-click a document to open it.
- Hover your cursor over a document name or icon: A tooltip will appear displaying which of the selected codes have been assigned in this document.
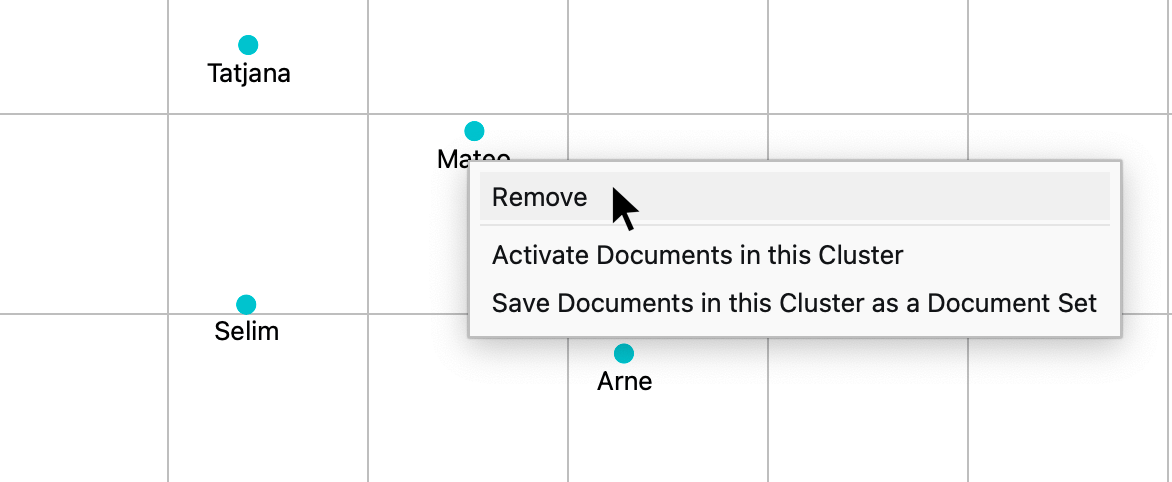
- Right-click a document and choose Remove to delete it from the map. The map will then regenerate itself with the remaining documents.
- Right-click on a document and select Activate Documents in this Cluster to select only the documents of the clicked color in the “Document System”. This allows you to perform analyses that only take into account the documents in this cluster. Alternatively, select the Save Documents in this Cluster as a Set option to not only activate the documents, but to compile them into a new set in the “Document System” window.

Customizing the display
In the Format menu you will find several options for interactively adjusting the appearance of the Document Map:

![]() Number of Codes – Displays in brackets after the document name how many of the selected codes occur in the document.
Number of Codes – Displays in brackets after the document name how many of the selected codes occur in the document.
![]() Size Reflects Number – The more analyzed codes have been assigned in the document, the larger the circle will be symbolizing that document.
Size Reflects Number – The more analyzed codes have been assigned in the document, the larger the circle will be symbolizing that document.
![]() Font Size Reflects Number – The more analyzed codes have been assigned in the document, the larger the font of the document’s name.
Font Size Reflects Number – The more analyzed codes have been assigned in the document, the larger the font of the document’s name.
![]() Grid – Turns on and off a grid, as known from a real map, to better estimate the relative distances between codes. The grid works with a fixed distance of 100 pixels. Distances can therefore only be compared within a map, not between different maps.>
Grid – Turns on and off a grid, as known from a real map, to better estimate the relative distances between codes. The grid works with a fixed distance of 100 pixels. Distances can therefore only be compared within a map, not between different maps.>
Color: Cluster / Document System / Uniform – Specifies how the documents are to be assigned a color:
- Cluster (map position) – Documents are assigned a color according to their group affiliation. The positions of the documents on the map are taken into account for the group identification. The clusters do not take into account the exact calculated distances with respect to the selected codes and documents, but only their projection on the two-dimensional surface. That is, documents can be grouped together that are further away from each other in the multidimensional space. You can determine the number of clusters in the numeric field.
- Cluster (distance matrix) – Recommended setting for cluster display: documents are assigned a color according to their group affiliation. The calculated distances between the documents with respect to the selected codes and variables are used for group determination. Due to the representation on a surface, even documents that are close to each other can be colored differently (if two documents from different clusters are displayed on the same map position, no color dot appears there, but a black circle). You can determine the number of clusters in the numeric field.
- Document System – Color is taken from the "Document System".
- Uniform – All document symbols are assigned the same color.
Comparing and investigating clusters
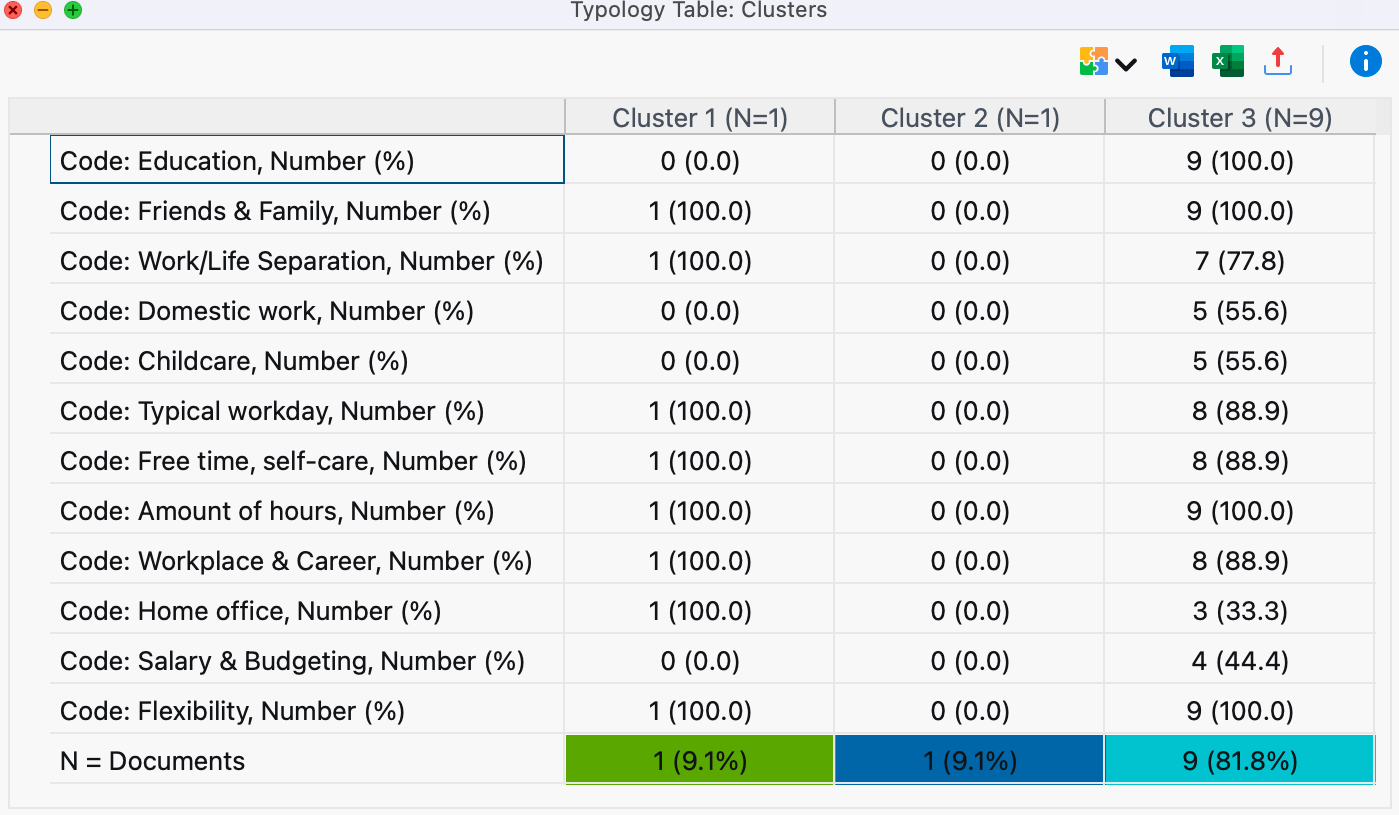
To better assess the similarities of the documents in a cluster and the differences between the clusters, the function Format > Typology Table: Cluster is available. This opens the following window:

The selected codes and variables are listed in the first column. The other columns are made up of clusters.
In the Occurrence of Codes/Variable Values analysis mode, the number of documents in which the code or variable value occurs is specified in the Typology Table. In the Frequency of Codes/Variable Values analysis mode, the mean value and standard deviation of the documents are displayed instead.
In the example above, the first cluster consists of seven documents, the other two of one and two documents, respectively. The first row shows that the code “Grandparents” was assigned on average 0.4 times in Cluster 1, three times in Cluster 2, and not at all in Cluster 3. And from the last line, it can be seen that the people in Cluster 1 are on average 20.4 years old.
The allocation of individual documents to clusters can also be saved as variables so that these can be used later for grouping the data. To do so, select Start > Save Cluster As Variables. The Data Editor for document variables will open, to which a new column with the cluster allocation will have been added.
Store view in Questions – Themes – Theories
In the Questions – Themes – Theories window, you can collect and comment on all the important results of your project. Click the ![]() Send to QTT Worksheet icon in the upper right corner to save the current view in a new or existing worksheet.
Send to QTT Worksheet icon in the upper right corner to save the current view in a new or existing worksheet.
Exporting a Document Map and calculations
The Start tab provides functions for exporting and refining the map as well as its underlying calculations:
![]() Save as a Map in MAXMaps – Creates a new map in MAXMaps – the tool for Concept Maps in MAXQDA – and inserts the contents of the Document Map here. You can edit the map later in MAXMaps.
Save as a Map in MAXMaps – Creates a new map in MAXMaps – the tool for Concept Maps in MAXQDA – and inserts the contents of the Document Map here. You can edit the map later in MAXMaps.
![]() Copy Display – Saves a high-resolution image of the map to the clipboard so you can paste it directly into a report or presentation.
Copy Display – Saves a high-resolution image of the map to the clipboard so you can paste it directly into a report or presentation.
![]() Export – Saves the display as an image file in PNG or SVG format. If you select Excel (XLSX) as the export format, the calculations are exported as matrix.
Export – Saves the display as an image file in PNG or SVG format. If you select Excel (XLSX) as the export format, the calculations are exported as matrix.
Notes on Document Map calculations and display
The classic multi-dimensional scaling method is used to locate the documents on the map.
For this purpose a distance matrix of the documents is calculated for the selected analysis mode Frequency of Codes/Variables as described in the section Similarity Analysis for Documents. If the evaluation mode Occurrence of Codes/Variable Values is selected, the resulting similarity matrix is first converted into a distance matrix. Since the similarity values can be a minimum of 0 and a maximum of 1, the conversion is performed by subtracting each similarity value from 1.
A distance of 0 means that two documents are identical with regard to the number or frequency of the selected codes and the considered variable values.
If the Color: Cluster (map position) option is selected, the documents are clustered and colored using a hierarchical cluster analysis of the positions on the two-dimensional surface. If the Color: Cluster (distance matrix) option is selected, clustering is performed using the underlying distance matrix. Unweighted average linkage is used as the clustering method.
If the option Size Reflects is switched on, the same principle is used to determine symbol sizes as with a Code Map.
