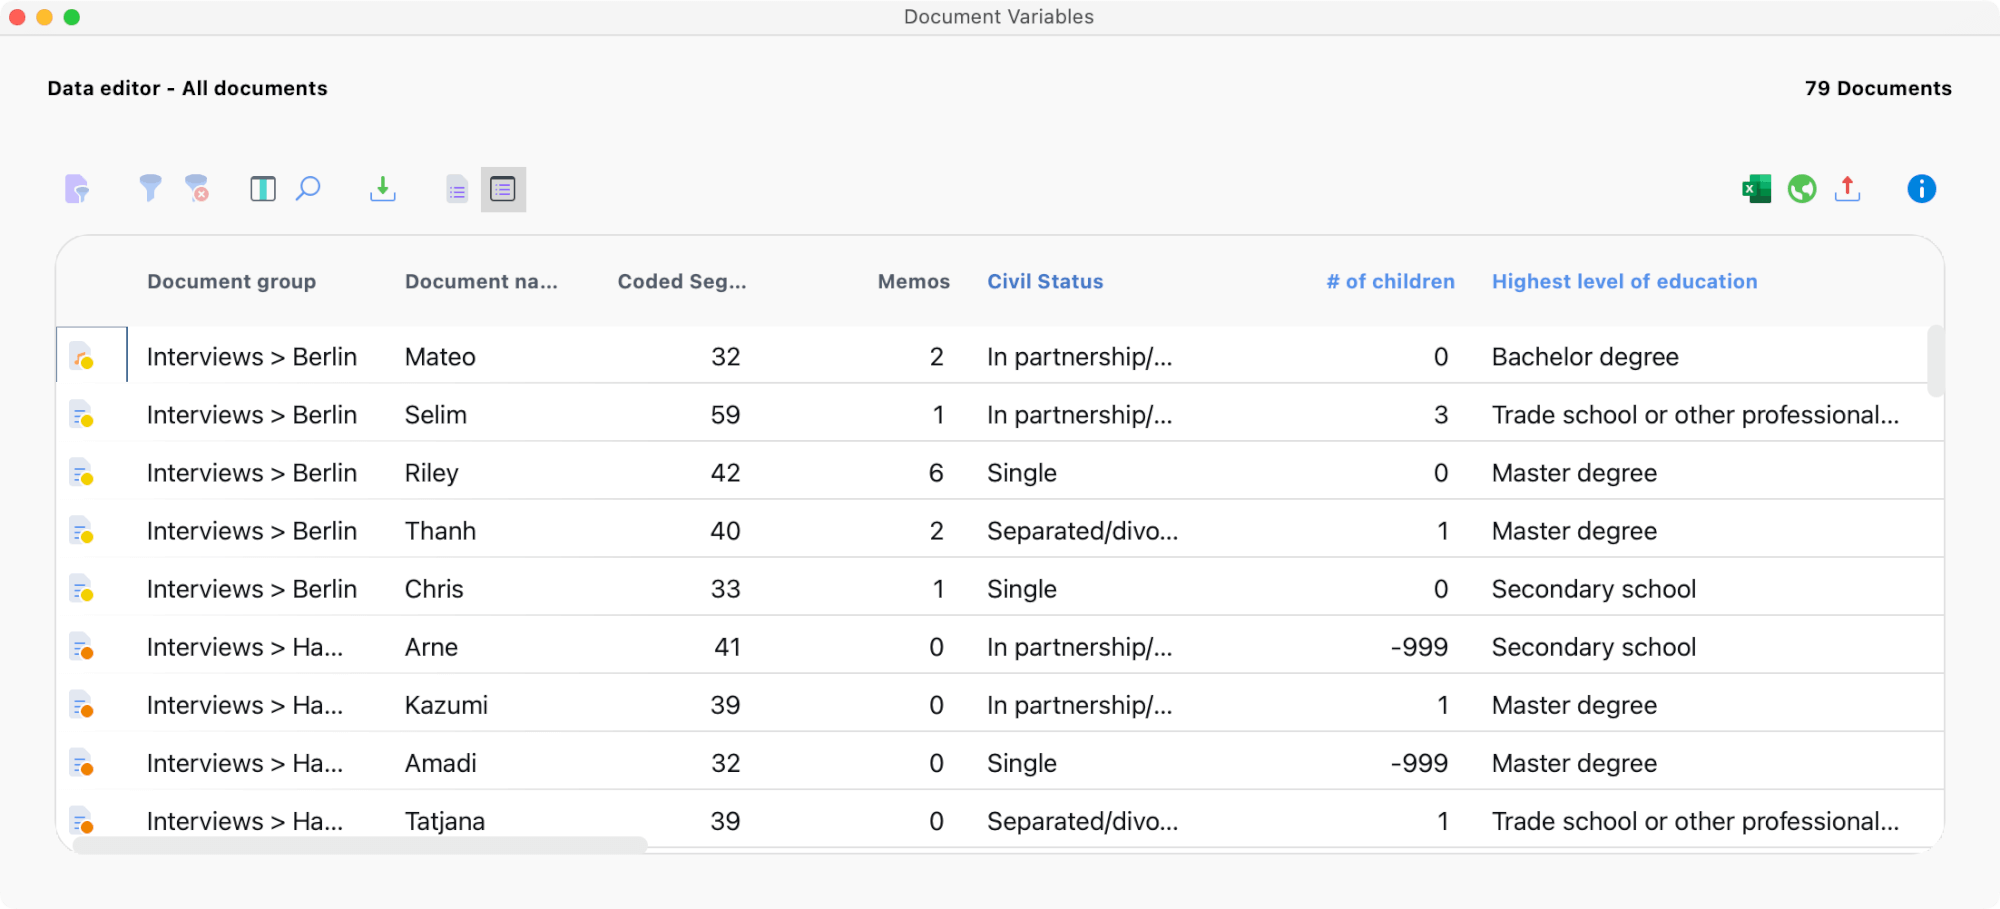
When working with variables, two views are available in MAXQDA: the variables view and the data view in the Data Editor. The Data Editor is similar to statistics programs in that the data is displayed as a rectangular matrix with a “rows x columns” structure. The variables are displayed in the columns; while the rows display the document variables for documents or the code variables for codes. For document variables the table will contain as many rows as there are documents in the “Document System”; for example, in an interview study, the number of rows will correspond to the number of interviewees. For the code variables, the codes represent the cases.
Opening the Data Editor for Document Variables
The Data Editor for Document Variables can be opened in three ways:
- via Variables > Data Editor for Document Variables,
- from the List of Document Variables by clicking on the
 Data Editor icon
 - in the “Document System” window, by selecting Variables in the context menu. When called up at the top level, the table contains all the documents; at the document group level, the data table contains only corresponding documents, and at the document level, only data.
A table will appear, in which the selected documents and their corresponding variable values are listed. System variables can be recognized by the black column heading; this cannot be modified in the table. User-defined variables are indicated with a blue heading; their values can be adjusted by double-clicking the appropriate cell.

In the Data Editor for Document Variables it is possible to access a document by right-clicking the appropriate row. A context menu will appear which lists the same options for opening the document as in the "Document System".
Opening the Data Editor for Code Variables
The Data Editor for Code Variables can be opened in three ways:
- via Variables > Data Editor for Code Variables,
- from the List of Code Variables by clicking on the Data Editor button, or,
- in the “Code System” window, by selecting Variables in the context menu of a code. If you click on a code, which does not contain subcodes, only the variable values for this code will be listed in the table. If the code contains subcodes, the variables of the subcodes will also be listed.
A table will appear which lists the selected codes and their corresponding variable values.
An extensive context menu, the same as in the “Code System”, is also available for individual codes.
Entering variable values in the Data Editor
To insert variable values into the Data Editor:
Double-click on the cell of the table where you would like to insert a value. Use the Enter key to jump to the next line to enter the variable values for your variables. Use the Tab key to jump to the next column to enter the values case by case.
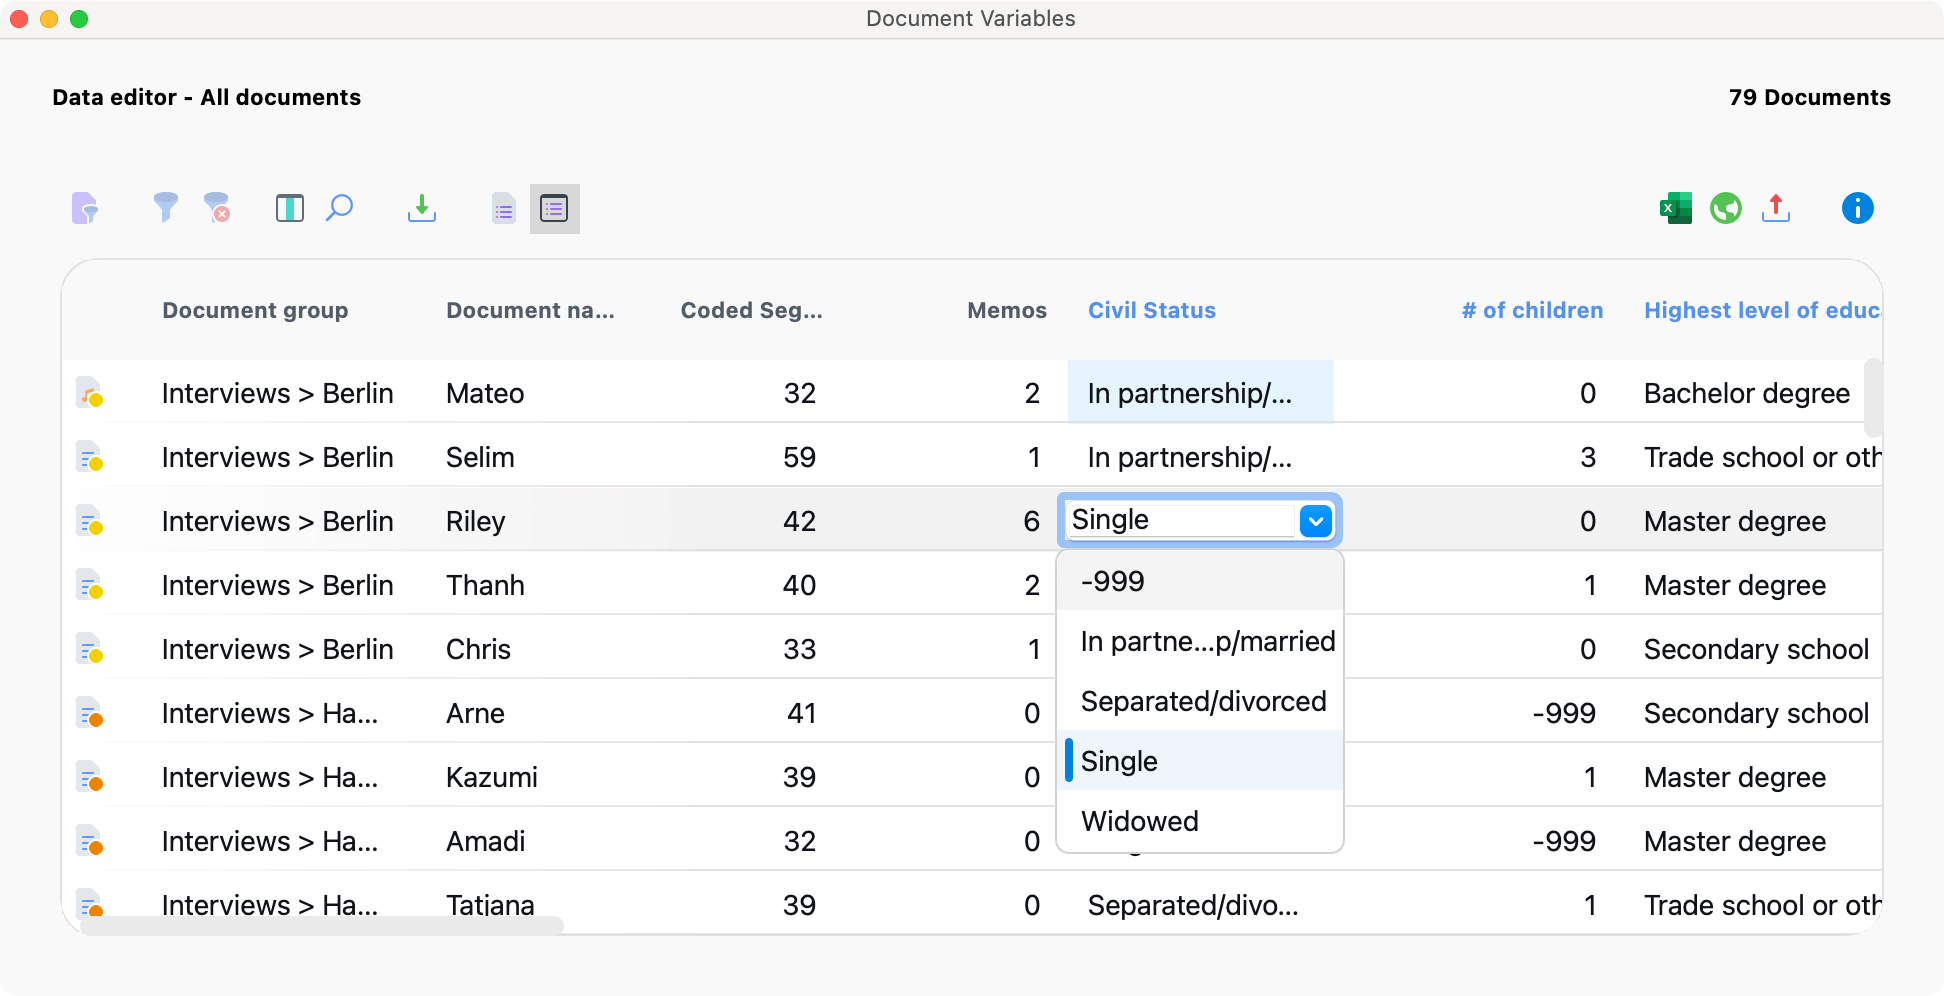
The values that have already been given to any of the cases in the column are in the drop-down list, sorted alphabetically. You can view this list and select a value from it by clicking on the triangle to the right of the cell you double-clicked on.

If the value isn’t available in the drop-down list, you can simply type in the value after double-clicking in the cell.
Managing tables
If you have created a large number of variables, it quickly becomes difficult to see the entire table at one time. You can view more columns at one time by making the columns thinner (click and drag the separator between column headers), but eventually even this does not suffice.
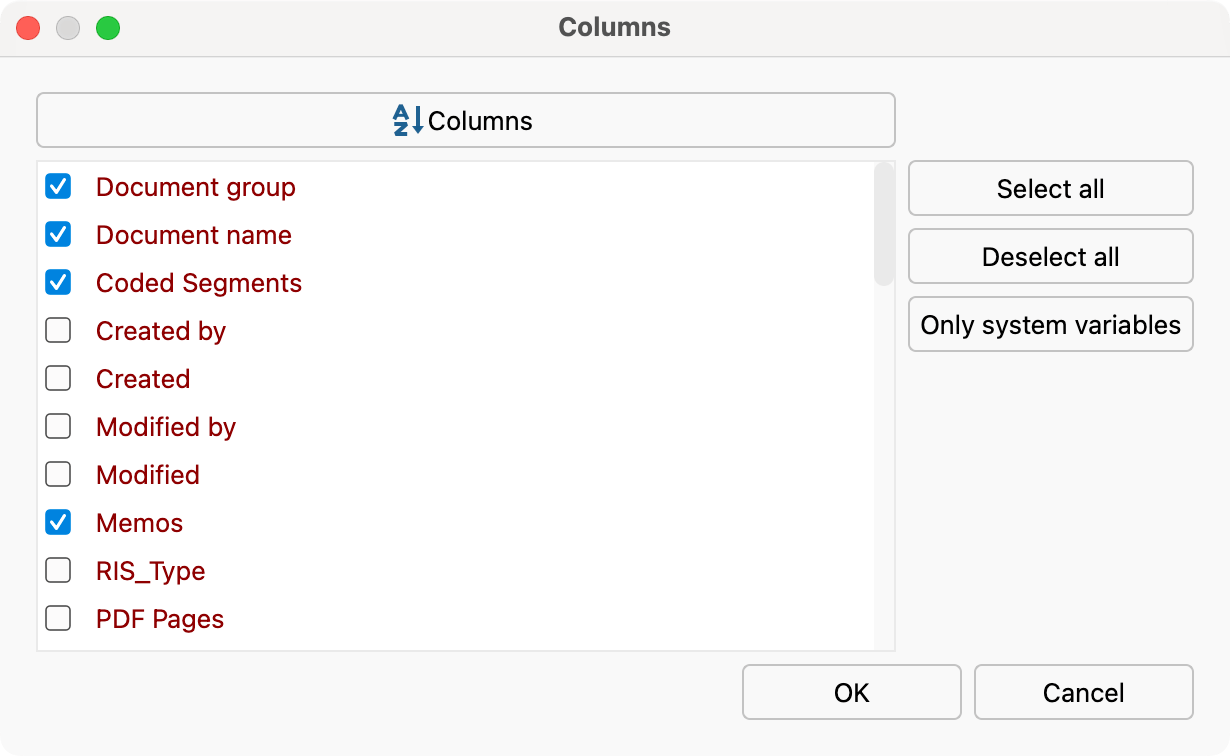
Of course there is the possibility to scroll through the table to the right and it is also possible to change the order of the variables in the table by grabbing a variable column with the left mouse button pressed and moving it to any other place in the table. However, it is simpler to click the Select Columns icon in the toolbar. There are a number of possibilities to influence the display in the variable table.

Besides (un)checking the boxes one by one, you also have the following options:
- select all fields
- deselect all fields
- only system fields (those automatically created by MAXQDA)
- hide or show variables by checking or un-checking the box in front of the variable name
Statistical analysis of a variable
You can start a statistical analysis of the variable values of a column at any time. Right-click on the column header and choose Document Variable Statistics or Code Variable Statistics.
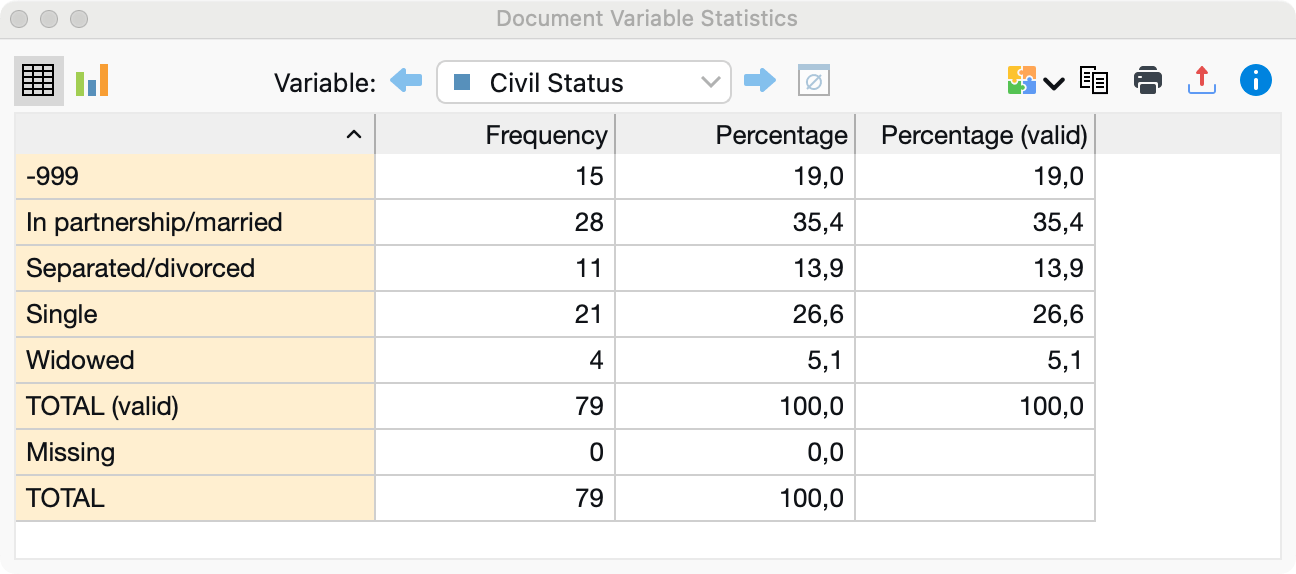
MAXQDA then creates a frequency table for the selected variable, which can also be displayed as a chart. Further information on the handling and design of frequency tables and charts can be found here.

