
Code Patterns let you examine the co-occurrence of codes in a document or segment. They are particularly suitable for analyzing code combinations, and they support multi-dimensional analysis as well as the formation of types by identifying patterns.
For Simple Code Patterns, you select individual codes for the analysis. For Complex Code Patterns, you select parent codes whose subcodes are evaluated. The following example shows how you might use code patterns in your analysis.
Example
Imagine you have carried out a video analysis of several situations in a kindergarten to determine which teachers play which games with which children. Each analyzed situation is entered as a separate document in the documents window, and the codes window contains three parent codes for your three analysis dimensions, each with three subcodes:
| Parent code 1: Teacher | Parent code 2: Child | Parent code 3: Game |
| Mrs. Mathilde Mr. Wolters Mrs. Berkempers | Finn Mareike Joshua | Ball game Knight's castle Board game |
Simple Code Patterns are especially suited to analyzing combinations of subcodes within one dimension. The results table has the following structure:
| Finn | Mareike | Joshua | Segments |
|---|---|---|---|
| x | x | 5 | |
| x | x | 3 | |
| x | x | 2 |
The selected codes form the columns, and combinations of these codes are marked with a symbol (here an "x"). The last column shows in how many segments the combination occurs. For example, the first row shows that Finn and Mareike playing together was coded in 5 segments. The remaining rows show that all three children never played together as a group, because no row has an x in every column.
Instead of the number of segments, you can analyze the number of documents, document groups, or document sets. The table then shows how often a code pattern occurs in the selected unit.
Complex Code Patterns are particularly suited to analyzing the interrelationships between several dimensions. The results table has the following structure:
| Teacher? | Child? | Game? | Segments |
|---|---|---|---|
| Mrs. Mathilde | Finn | Ball game | 10 |
| Mr. Wolters | Mareike | Knight's castle | 6 |
| Mr. Wolters | Joshua | Ball game | 3 |
The columns contain the parent codes, that is, the analyzed dimensions. The cells contain the subcodes, that is, the manifestations of each dimension. The last column shows in how many segments of your data the three subcodes in each row co-occurred. In the first row, for example, a ball game between Mrs. Mathilde and Finn was coded in 10 situations.
You can also display the number of documents, document groups, or document sets instead of the number of segments.
Analyzing simple code patterns
To analyze simple code patterns, go to Analysis > Code Patterns > Simple Code Patterns.
A dialog appears where you can drag and drop codes from the codes window. Alternatively, click Insert activated codes to transfer the activated codes to the selection window. Click Remove code(s) to remove selected codes from the selection window again.
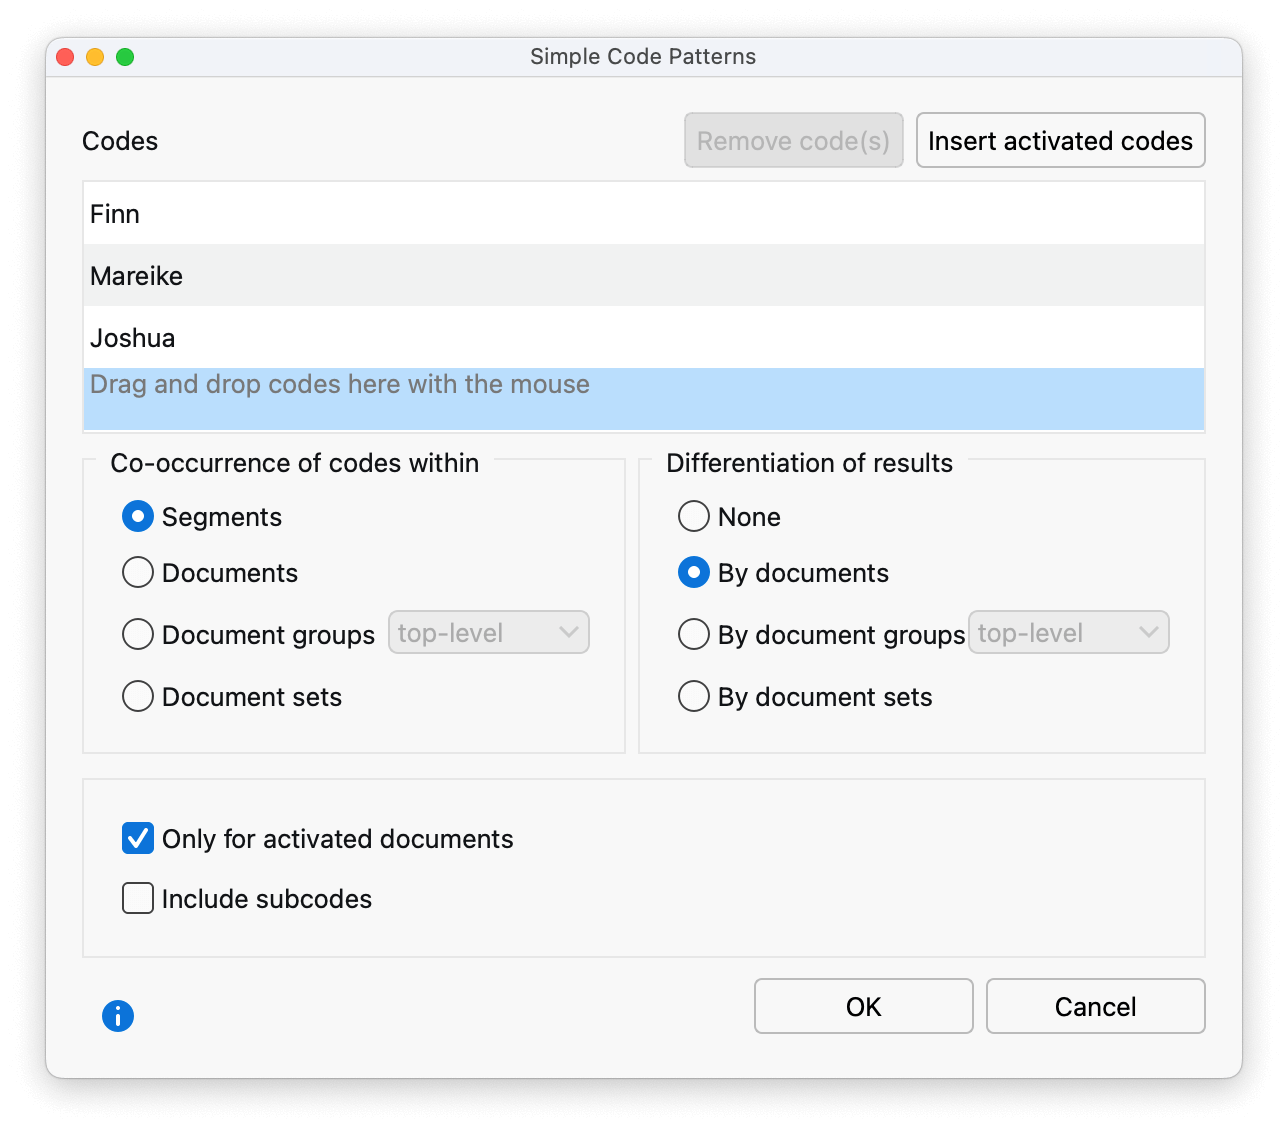
Below the code selection, choose which co-occurrence of codes should be analyzed, that is, the counted unit:
- Segments: Analyzes in how many segments the selected codes co-occur. It is enough if the codes overlap. They do not have to be applied to exactly the same segment.
- Documents: Analyzes in how many documents the selected codes co-occur. It does not matter where the codes occur in a document, only that all codes have been assigned in it. If a code occurs several times in a document, one occurrence is enough to count it.
- Document groups and sets: Works like Documents, but across several documents, so the codes do not have to occur in the same document. It is enough if one code is assigned in one document and another code in a different document of the same document group or set.
Differentiation of results: If you chose to count segments or documents, you can also split the results table by documents, document groups, or document sets. This makes it easy to compare cases or groups of cases.
Select Only activated documents to restrict the analysis to activated documents.
Click OK to start the analysis. MAXQDA produces the following results table:
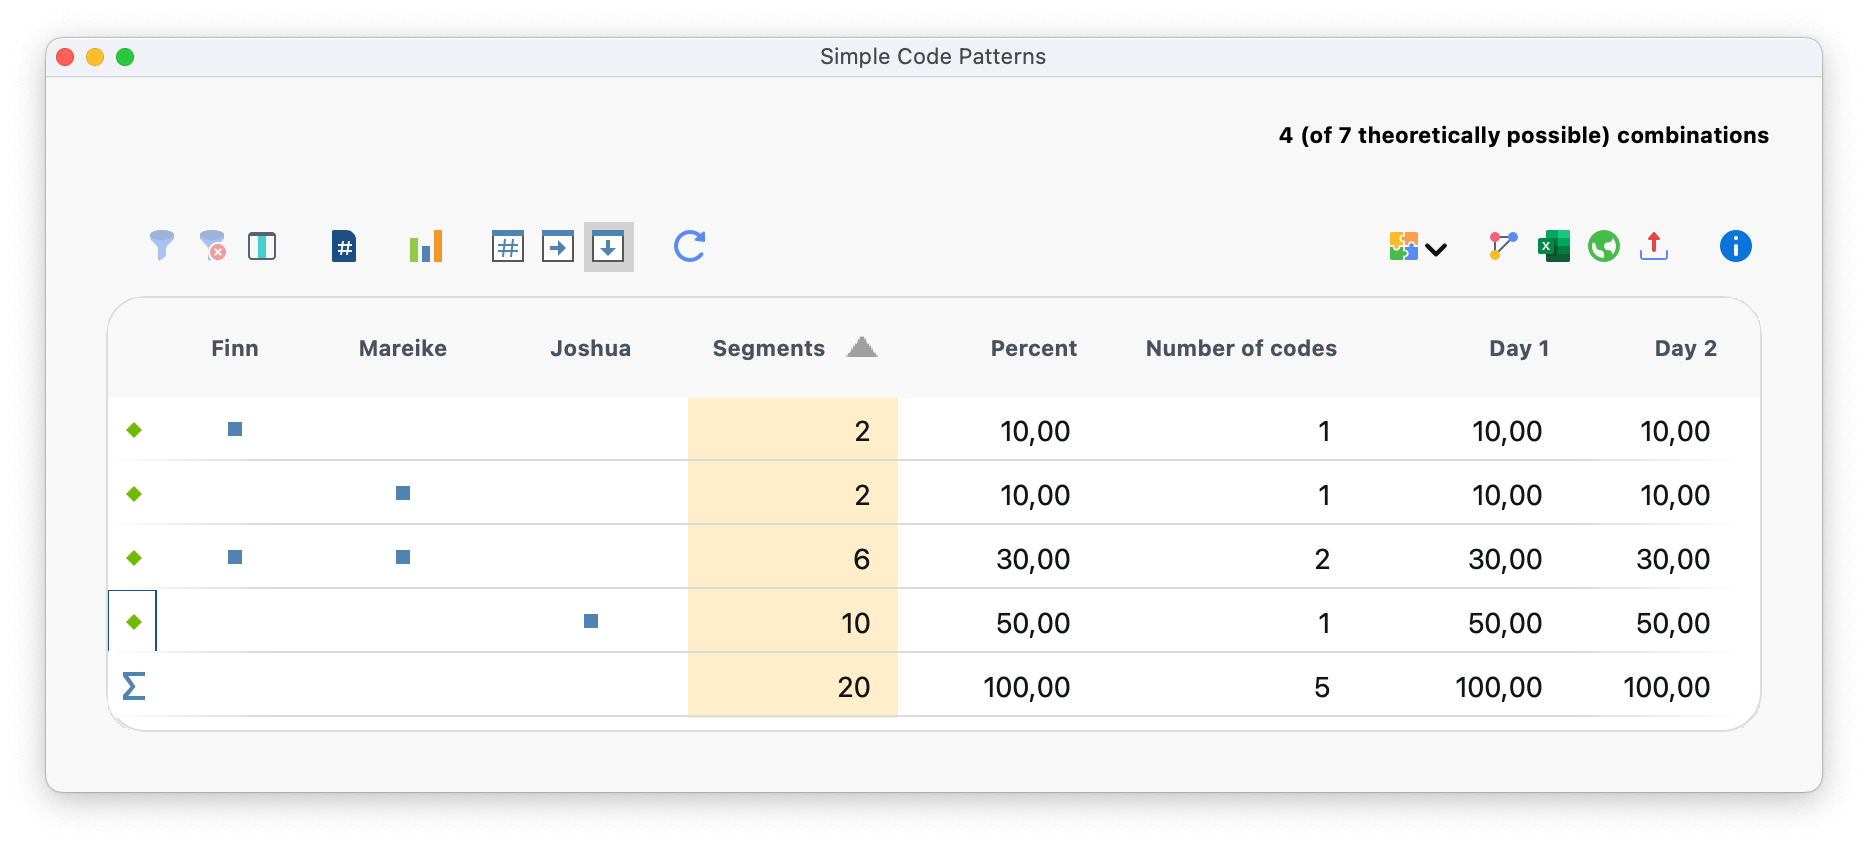
The first columns of the results table are headed with the names of the selected codes and show where each code occurs. If a code occurs in a segment, the column shows a blue square. Each row contains a different combination of the analyzed codes (a "pattern").
The upper right corner of the window shows how many combinations actually occurred in the analyzed documents and, in brackets, how many could have occurred at most.
If a combination of codes does not exist, its row does not appear in the table. Only segments with at least one of the selected codes are analyzed, so with the Segments unit, a row without any of the analyzed codes is not displayed.
The Segments column shows how often a combination occurs in the analyzed documents. The Percent column shows the corresponding relative frequency. The Number of codes column shows how many codes occur in the combination.
If you chose a differentiation by documents, document groups, or document sets, additional columns are added at the end of the table for each selected unit. In the example above, these are the two documents "Day 1" and "Day 2". The three icons in the toolbar switch the display in these columns between absolute numbers, row percentages, and column percentages. In the table above, column percentages are selected, so the results for the individual documents can be compared directly with the overall values in the Percent column.
Output when analyzing the co-occurrence of codes within documents, document groups, or document sets
- In the results table, the Segments column is replaced by a column named Documents, Document groups, or Document sets, depending on the unit. It shows how many analyzed units contain the combination of codes.
- If some documents, groups, or sets contain none of the analyzed codes, the results table contains a row without blue squares.
- A Detailed View table also appears. It shows which combination of the selected codes each document, group, or set contains. The table corresponds to the Code Matrix Browser visual tool, with rows and columns swapped.
Analyzing complex code patterns
To analyze complex code patterns, go to Analysis > Code Patterns > Complex Code Patterns.
A dialog appears where you can drag and drop parent codes from the codes window. MAXQDA then lists their subcodes automatically. To exclude a subcode from the analysis, clear its checkbox.
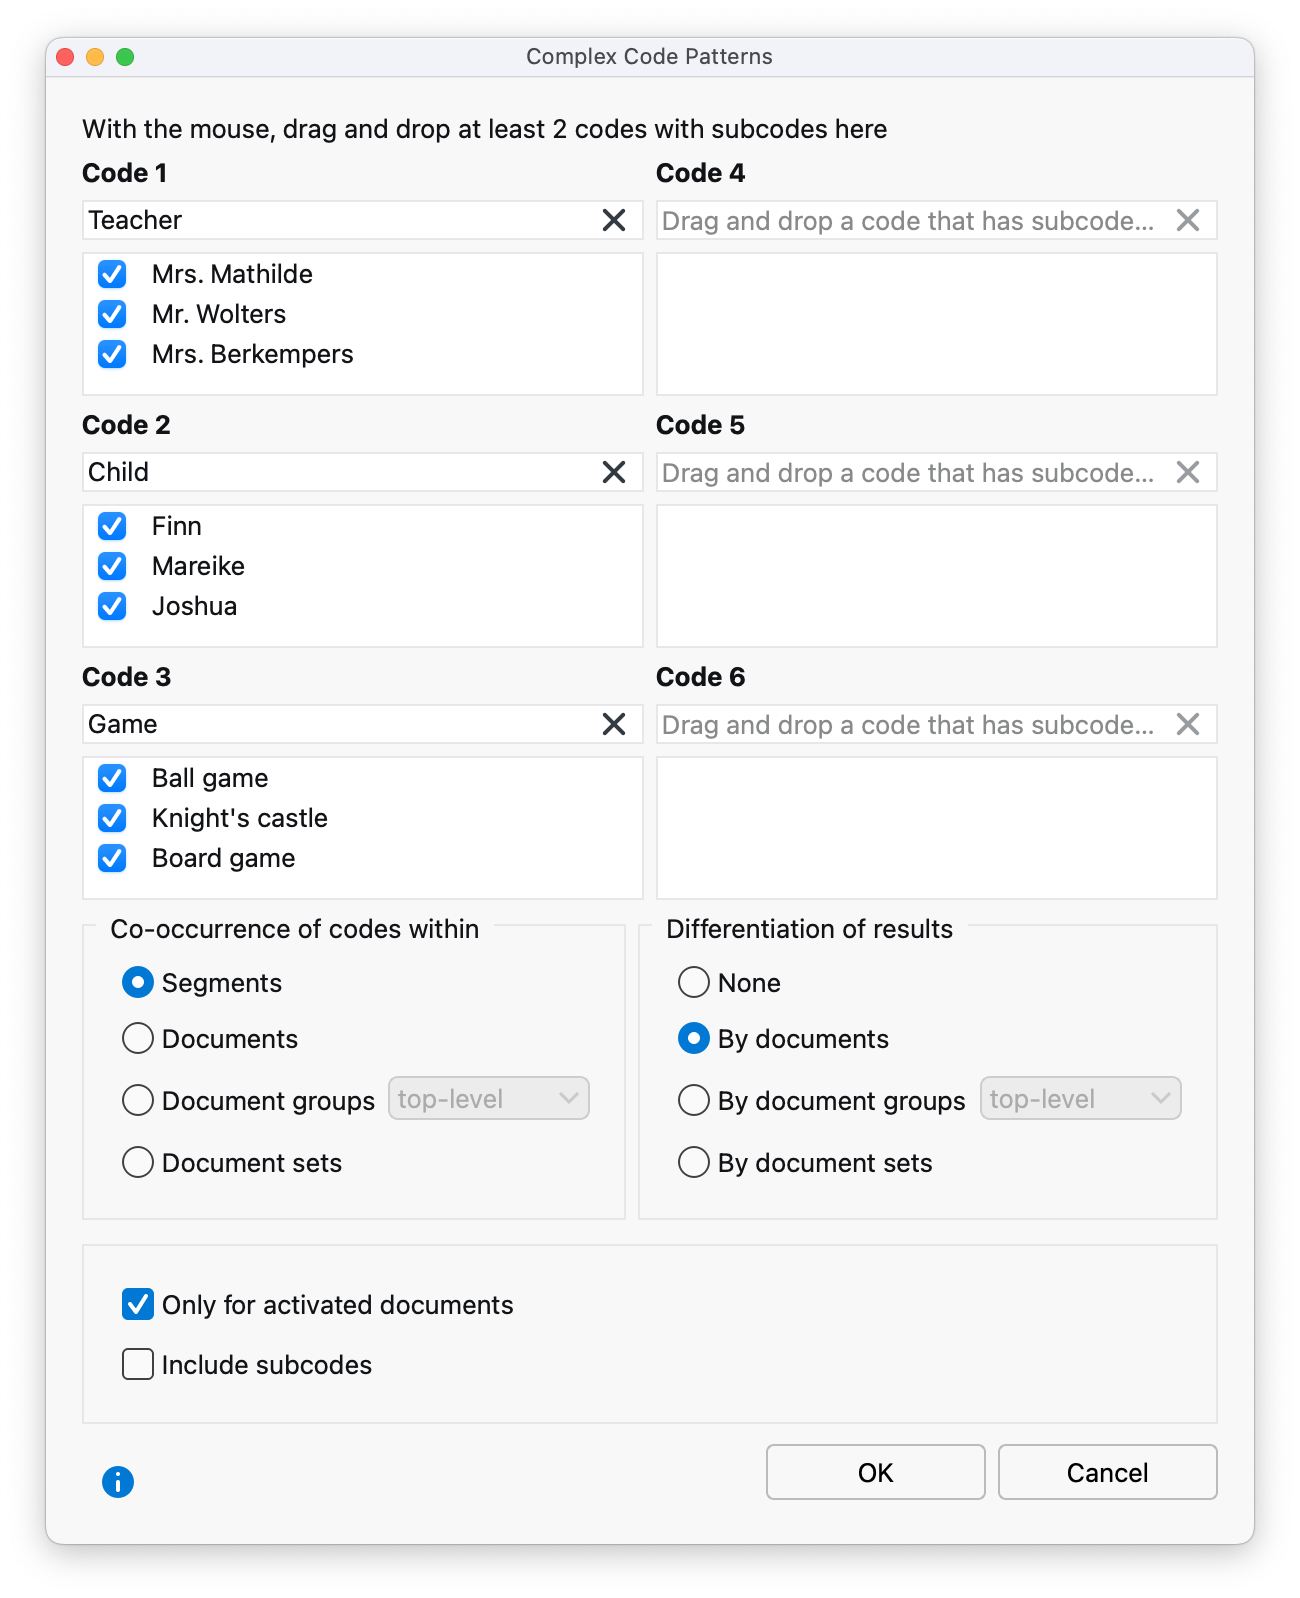
The other settings in this dialog are the same as described above for Simple Code Patterns.
Click OK to start the analysis. MAXQDA produces the following results table:
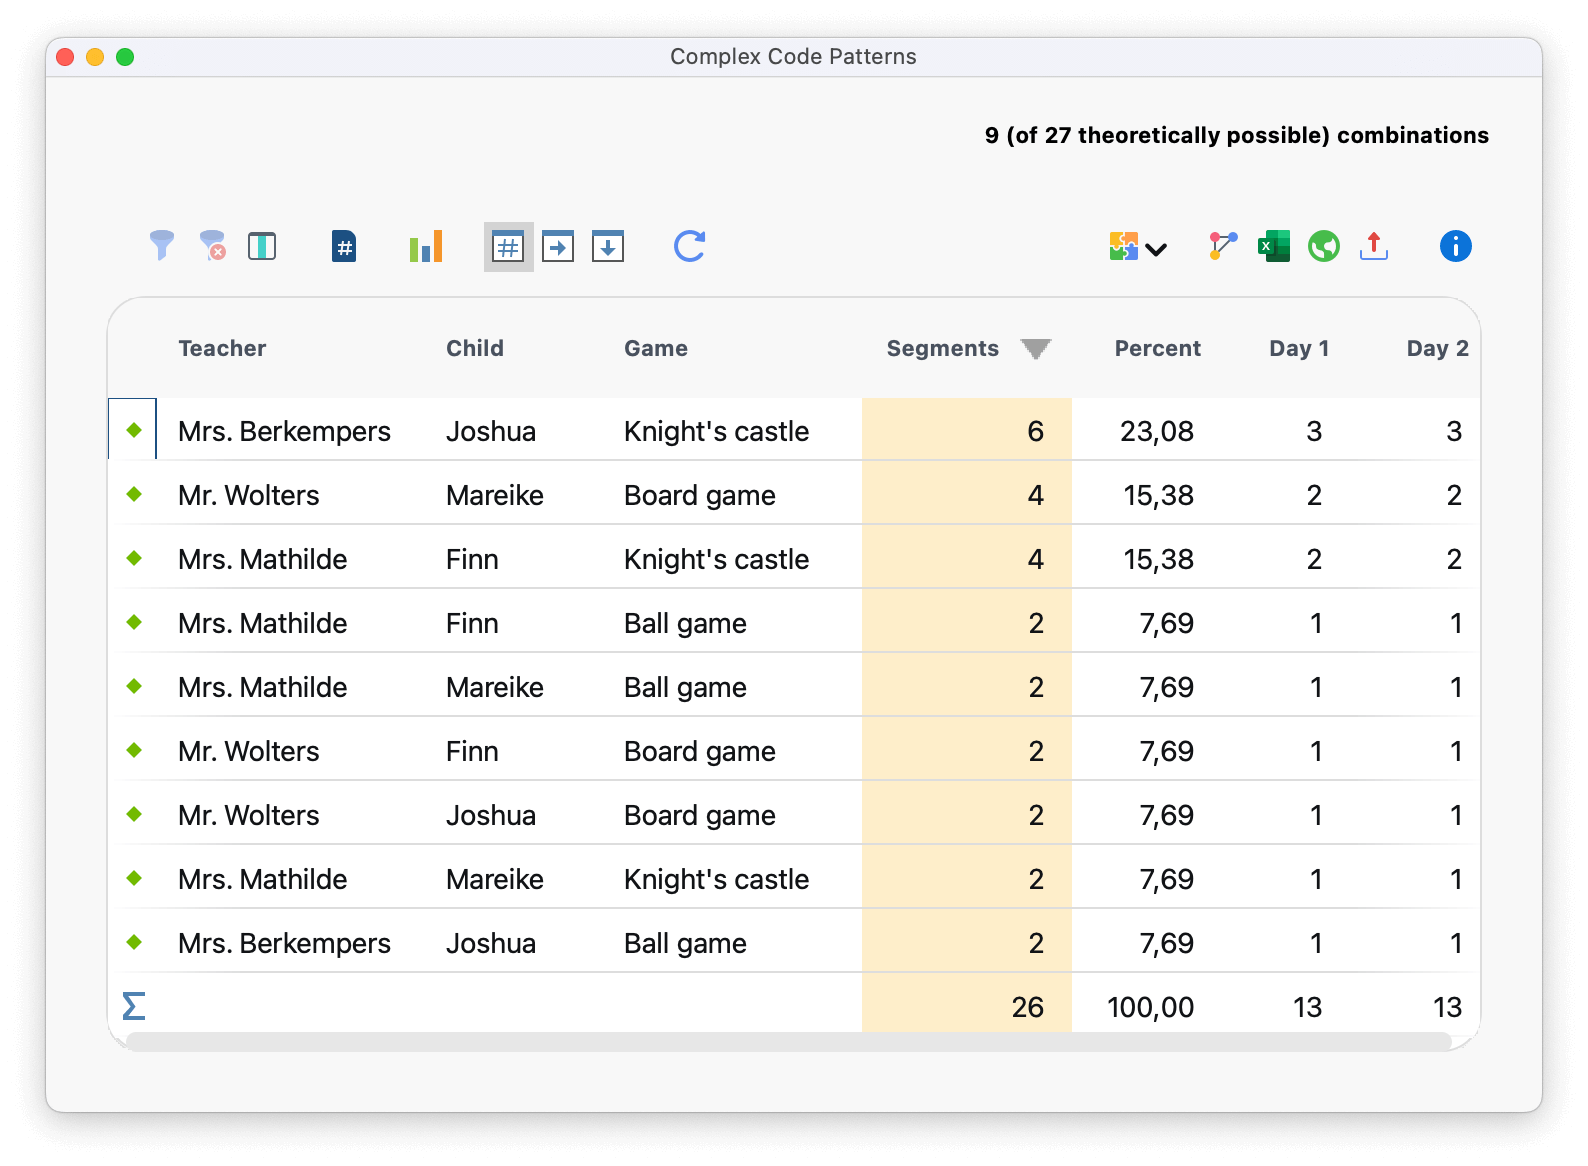
The first columns contain your selected parent codes. Each row contains a combination of subcodes, and the Segments column shows how often the combination occurs in your data.
If you chose to differentiate by documents, document groups, or document sets, the right side of the table shows columns with the frequencies in each of them. You can switch the values in these columns to column percentages or row percentages.
Toolbar
 Filter: Applies the filters you define by right-clicking a column heading and selecting Set filter.
 Reset all filters: Removes the filters from all columns.
 Column selection: Opens a dialog where you choose which columns of the results table are displayed.
 Count hits only once per document: When enabled, a combination of codes is counted only once per document, regardless of how many segments in the document contain it. This option appears only when you analyze segments.
 Statistics: Displays the results as a frequency table, which you can also switch to a chart to display the results visually.
 Number: The additional columns for documents, document groups, or document sets display absolute numbers.
 Row percentages: The additional columns for documents, document groups, or document sets display row percentages.
 Column percentages: The additional columns for documents, document groups, or document sets display column percentages.
Interactive results tables
The Code Patterns tables are sorted by the frequency of the combinations. Click a column header to change the sort order, and drag a column header to change the order of the columns.
The results tables of Simple and Complex Code Patterns are interactive. Double-click a row with a code combination to list all associated coded segments in the Retrieved Segments window.
Store results table in a QTT Worksheet
In the Questions – Themes – Theories (QTT) workspace, you can collect and comment on all the important results of your project. To save the currently visible part of the code patterns results table in a new or existing worksheet, click the  Send to QTT Worksheet icon in the upper right corner of the toolbar.
Exporting results tables
Use the usual icons at the top right of the window to export the current display. The selected rows are exported. If no rows are selected, the entire table is exported.
Displaying results as a chart
Click the chart symbol at the top left to display the current table as a horizontal or vertical bar chart or as a pie chart. If you selected Documents, Document groups, or Document sets as the unit, the chart also includes a row with the number of analyzed documents in which none of the respective codes occur. For information on creating and customizing charts, see Frequency Tables and Charts for Subcodes.
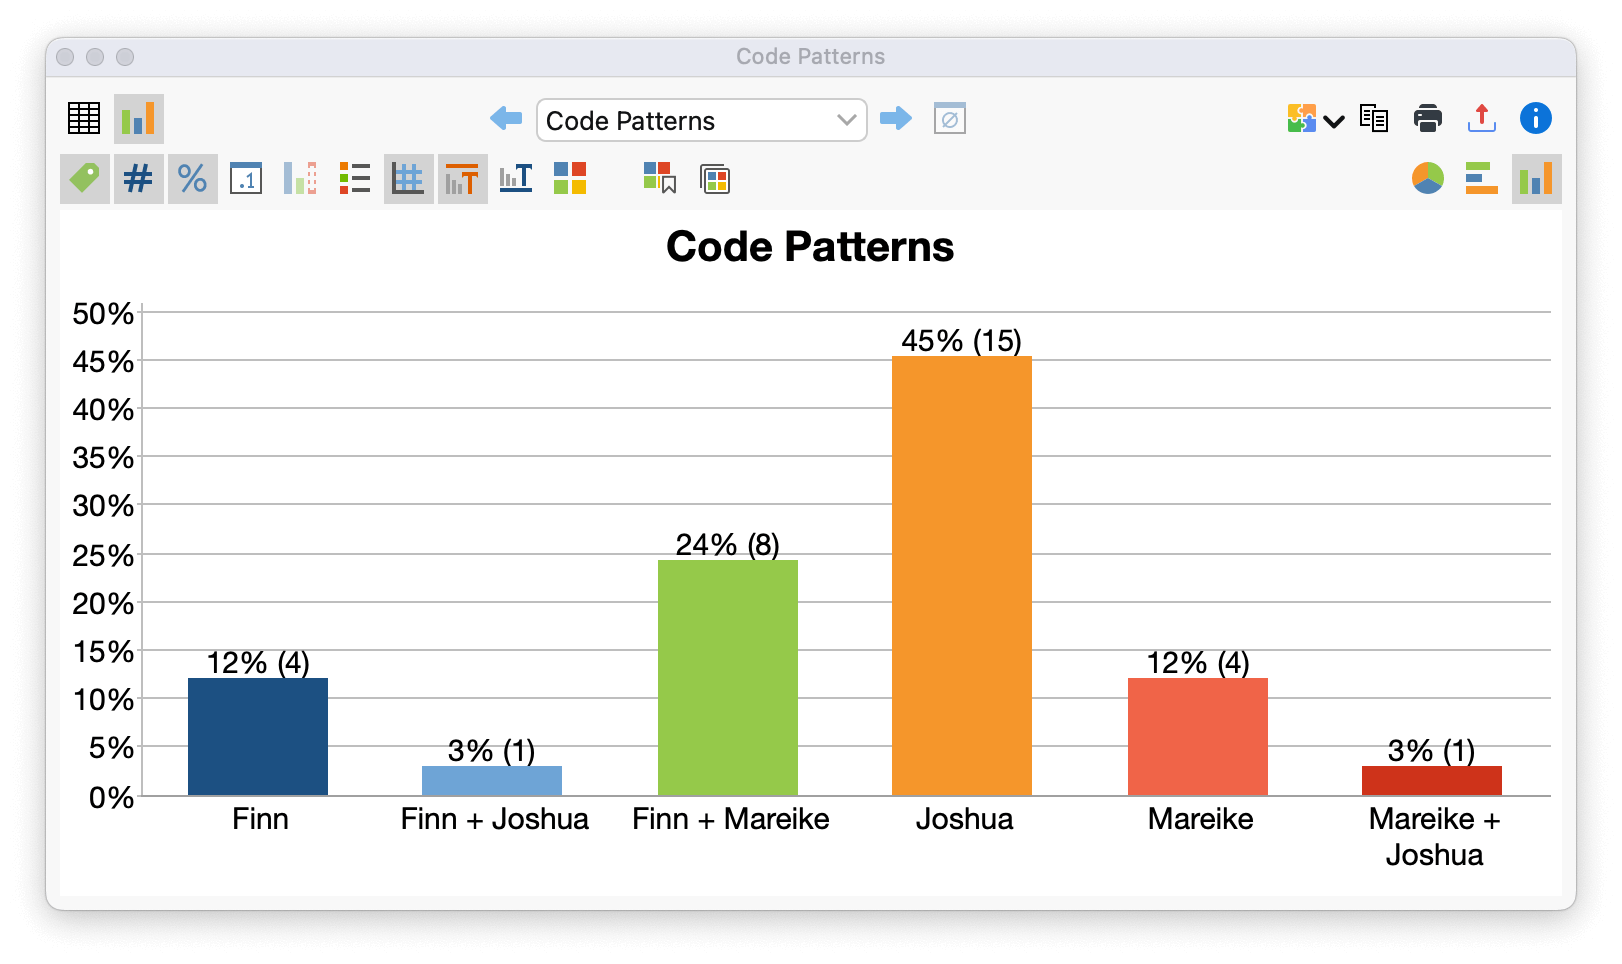
Displaying pairwise relations of the codes in MAXMaps
You can display the code patterns from the table visually and examine them further in MAXMaps, a MAXQDA workspace for creating concept maps. To do so, click the  Save as a Map in MAXMaps icon. MAXMaps opens and creates a new Code Relations Model:
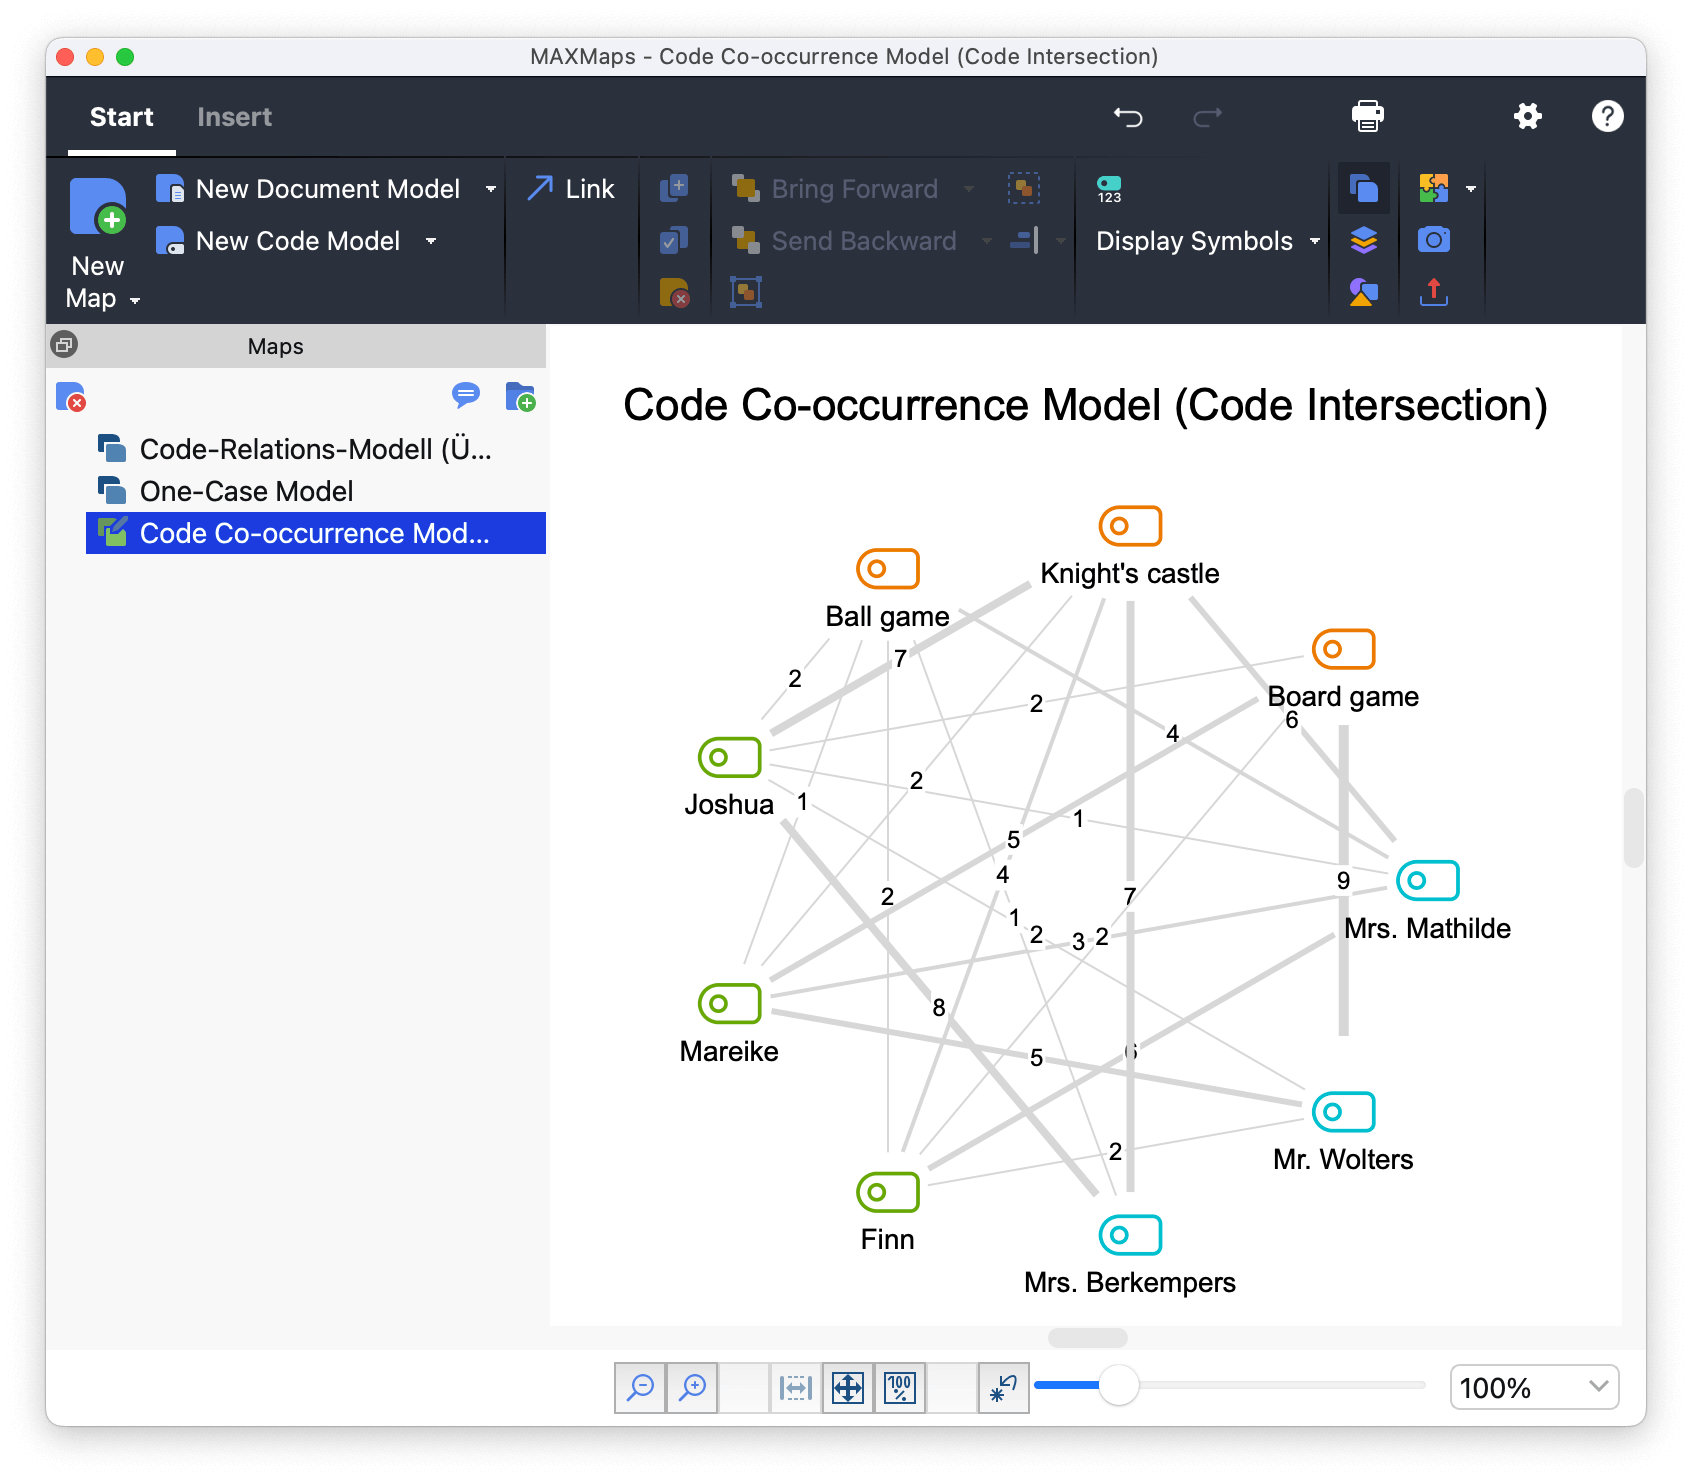
All analyzed codes are arranged in a circle, with codes of the same dimension next to each other. A connecting line between two codes shows that the codes co-occur in the analyzed data. The number on a line shows the exact number of co-occurrences, and the more co-occurrences there are, the thicker the line is. When MAXQDA creates the Code Relations Model, it applies the settings of the code patterns analysis: a relation means either that two codes were assigned together in the same segment, or that two codes were assigned somewhere in the same document.
The results tables of Code Patterns show the co-occurrence of several dimensions, while the Code Relations Model in MAXMaps shows the pairwise relations between two codes. This lets you analyze the relationships between two codes in detail.
If document groups or document sets are selected as the unit for the code patterns, or if the option for including subcodes is active, you cannot display the results as a Code Relations Model in MAXMaps.
