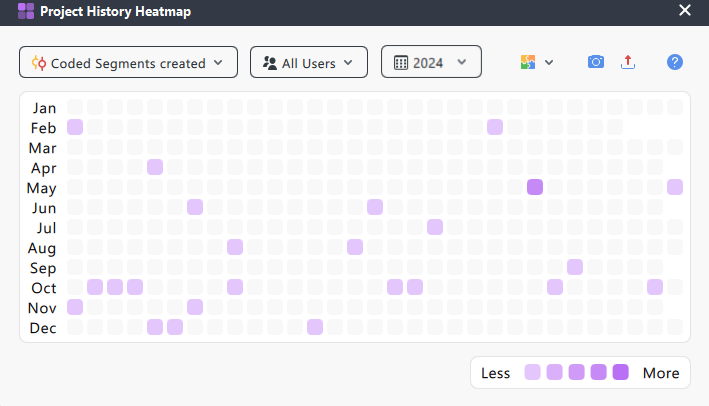
The Project History Heatmap provides a visual overview of your MAXQDA project's development over time. You can track the creation of elements, such as coded segments, codes, documents, and memos, and see which users were most active during different periods. This helps you better understand your project's workflow, team contributions, and overall progression.
How to open the Project History Heatmap
- Go to the Reports menu in the main menu bar.
- Then, click
 Project History Heatmap
What you'll see
When you open the Project History Heatmap, you'll see a compact grid layout that visualizes your project activity over time. The display resembles a calendar-style heatmap broken down by month and day.

- Rows: Represent calendar months for the selected year.
- Squares: Each one represents a single day for a given month in a year.
- Color intensity: Indicates activity level.
The more elements were created on a given day, the darker the shade of purple the square will appear. Gray squares indicate no activity. - Color legend: A scale from "Less" to "More" is located at the bottom right of the window.
Only colored squares appear in the legend (gray is excluded). Colors range from light purple (few items created) to dark purple (many items created).
- Color intensity: Indicates activity level.
To dig deeper, hover your mouse over any square to see the exact number of items created on that specific day.
Filter options
Use the dropdown filters at the top of the window to tailor the display to your needs:
- Element type: Choose which type of activity to visualize.
- Coded Segments created (default)
- Codes created
- Documents created
- Memos created
- User: Filter by contributor.
- All users (default)
- Individual users (only users with activity will appear in the list)
- Year: Select the calendar year you'd like to view.
- MAXQDA lists all years from the project's creation date to the current year, even if no activity occurred in a given year.
- The selected year stays the same when switching between users or element types.
Project History Heatmap export options
You can reuse or share your project's History Heatmap in several ways. Click the icons in the top-right corner of the window to:
![]() Take a snapshot of the current display
Take a snapshot of the current display
![]() Export as image (PNG, JPEG, SVG)
Export as image (PNG, JPEG, SVG)
![]() Send to QTT worksheet for further analysis
Send to QTT worksheet for further analysis
