With MAXQDA you can import structured documents from Excel spreadsheets in XLS or XLSX format. Each table cell is automatically coded, and you can assign variable values to the individual texts (the cases). This feature is especially useful for survey data that combines standardized and open-ended questions.
Overview of the import workflow
- Create your Excel file – Set up the spreadsheet in the required structure.
- Start the import process – Open the Survey Data from Excel import in MAXQDA and select your file.
- Work through the import steps – Preview the data, assign data types, and define case IDs and groups.
- Complete the import – MAXQDA creates your cases, assigns variables, and codes responses automatically.
Importing data from Excel spreadsheets
1. How should the Excel spreadsheet be structured?
MAXQDA imports survey-style data in a tabular format. Each row of your spreadsheet becomes a case (document). Each column represents a type of information: this could be identifiers (such as ID or group), survey questions, or standardized variables. The cells contain the values for that case, for example, a participant's name, their response to an open question, or their age. This follows the logic of a data matrix: rows are cases, columns are variables.
Example
The table below provides a simple example showing how this logic looks in practice. Content in square brackets clarifies the column's role and is not part of the actual header.
| Document Group | ID [Document Name] | Positive Feedback [Open Question 1] | Negative Feedback [Open Question 2] | Age [Variable 1] | Pre-knowledge [Variable 2] |
| Group A | Person 1 | Great conference! | The catering was a bit tight | 22 | high |
| Group A | Person 2 | Best keynote I have heard in a long time | 25 | medium | |
| Group B | Person 3 | I especially enjoyed the pre-conference workshop | none | 21 | medium |
| Group B | Person 4 | Great job - keep going! | Please make workshops longer in the future | 31 | low |
Here, each row is a separate case. The columns "Positive Feedback" and "Negative Feedback" contain open-ended responses. The "Age" and "Pre-knowledge" columns store standardized variables. The first two columns help MAXQDA create and organize documents in the "Document System."
Step-by-step setup
- Create a single worksheet that contains all rows you intend to import.
- Add the required and optional identifier columns at the beginning:
- ID (required): The document name for each row.
- Document Group (optional): The group into which the document will be imported. If you do not include one, MAXQDA will generate it during import.
- Add columns for your questions and variables: Use one column per question or standardized attribute, such as sociodemographic variables.
- Enter data in the cells: Open-ended answers can be full text; variables can be numbers or categories.
- Create subgroup levels: Create a subgroup by adding a backslash to the group name (e.g., Survey\Berlin).
Notes and recommendations
- Document Group is optional: If this column is not present, MAXQDA can create a new document group and import all documents into it during the import process. However, the ID column with the document names is required.
- Keep column headings short and clear: MAXQDA imports the first 63 characters of a column heading. If two headings are identical within those 63 characters, they are treated as the same column.
- Use a single worksheet: MAXQDA imports only the first worksheet in an Excel file. If your data is split across multiple sheets, combine it before importing.
- Missing values: Empty cells are treated as missing values. If the column is imported as qualitative data, those empty cells will not be coded.
2. Start the import process
Select Import > Survey Data > Import Data from Excel Spreadsheet, as shown in the image below, and choose the file in the dialog window.

3. Import Survey Data from Excel
After you select a file, MAXQDA opens the import dialog and guides you through the process.
Step 1: Preview
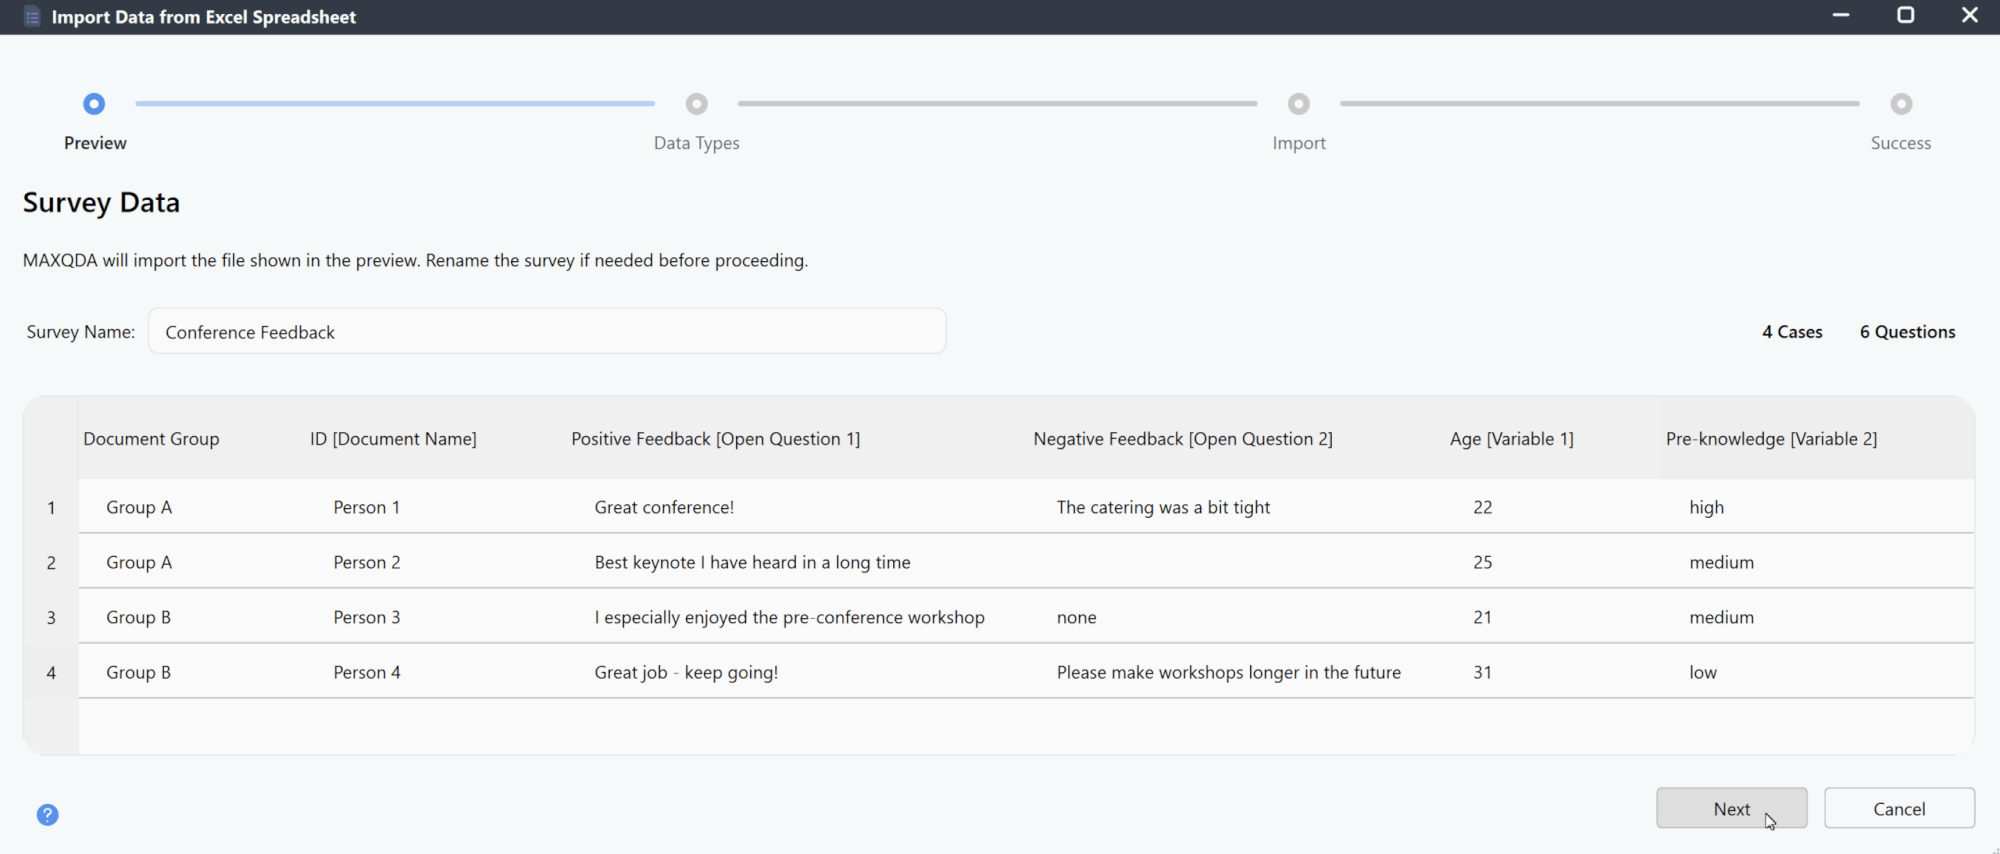
The first window displays a preview of the data (see image below) so you can confirm that the file was read correctly before continuing. You can scroll through the preview to check the content. The window also shows the total number of cases (rows) and questions (columns) detected in the file.

At this stage, you can enter a name for the survey; by default, MAXQDA uses the Excel file name.
Click Next to continue, or Cancel to exit the import process.
Step 2: Confirm Data Types
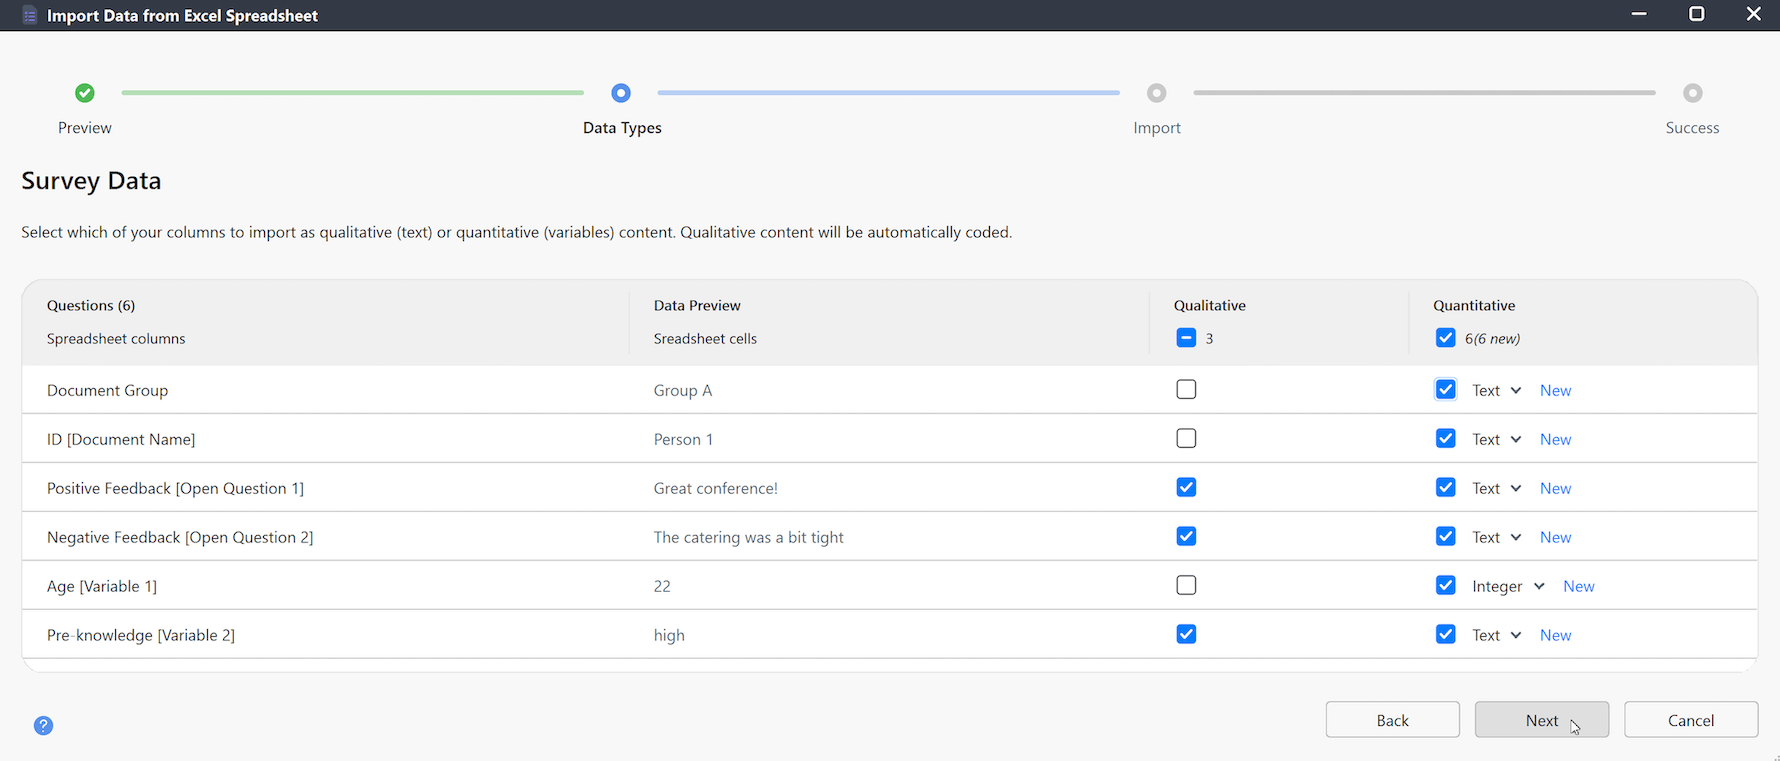
In this step, MAXQDA shows how it has interpreted your spreadsheet. Each column is classified as either qualitative content or a quantitative variable. A preview of sample cells appears for every column so you can verify the detection. For quantitative columns, MAXQDA also proposes a variable type. Use the checkboxes and menus to change a column's classification or type if needed.

- Qualitative columns are imported as text and automatically coded with their respective column header.
- Quantitative data is added as document or code variables, and each case/document includes the values from those columns.
If you select both qualitative and quantitative for a column, MAXQDA imports the data in two ways: once as coded text under the column header, and once as a variable. This is useful if you want to analyze standardized information alongside the open-ended responses, for example, recording a respondent's age as a variable while also keeping it coded in their text.
When you finish assigning data types, click Next.
Step 3: Define Case IDs and Groups
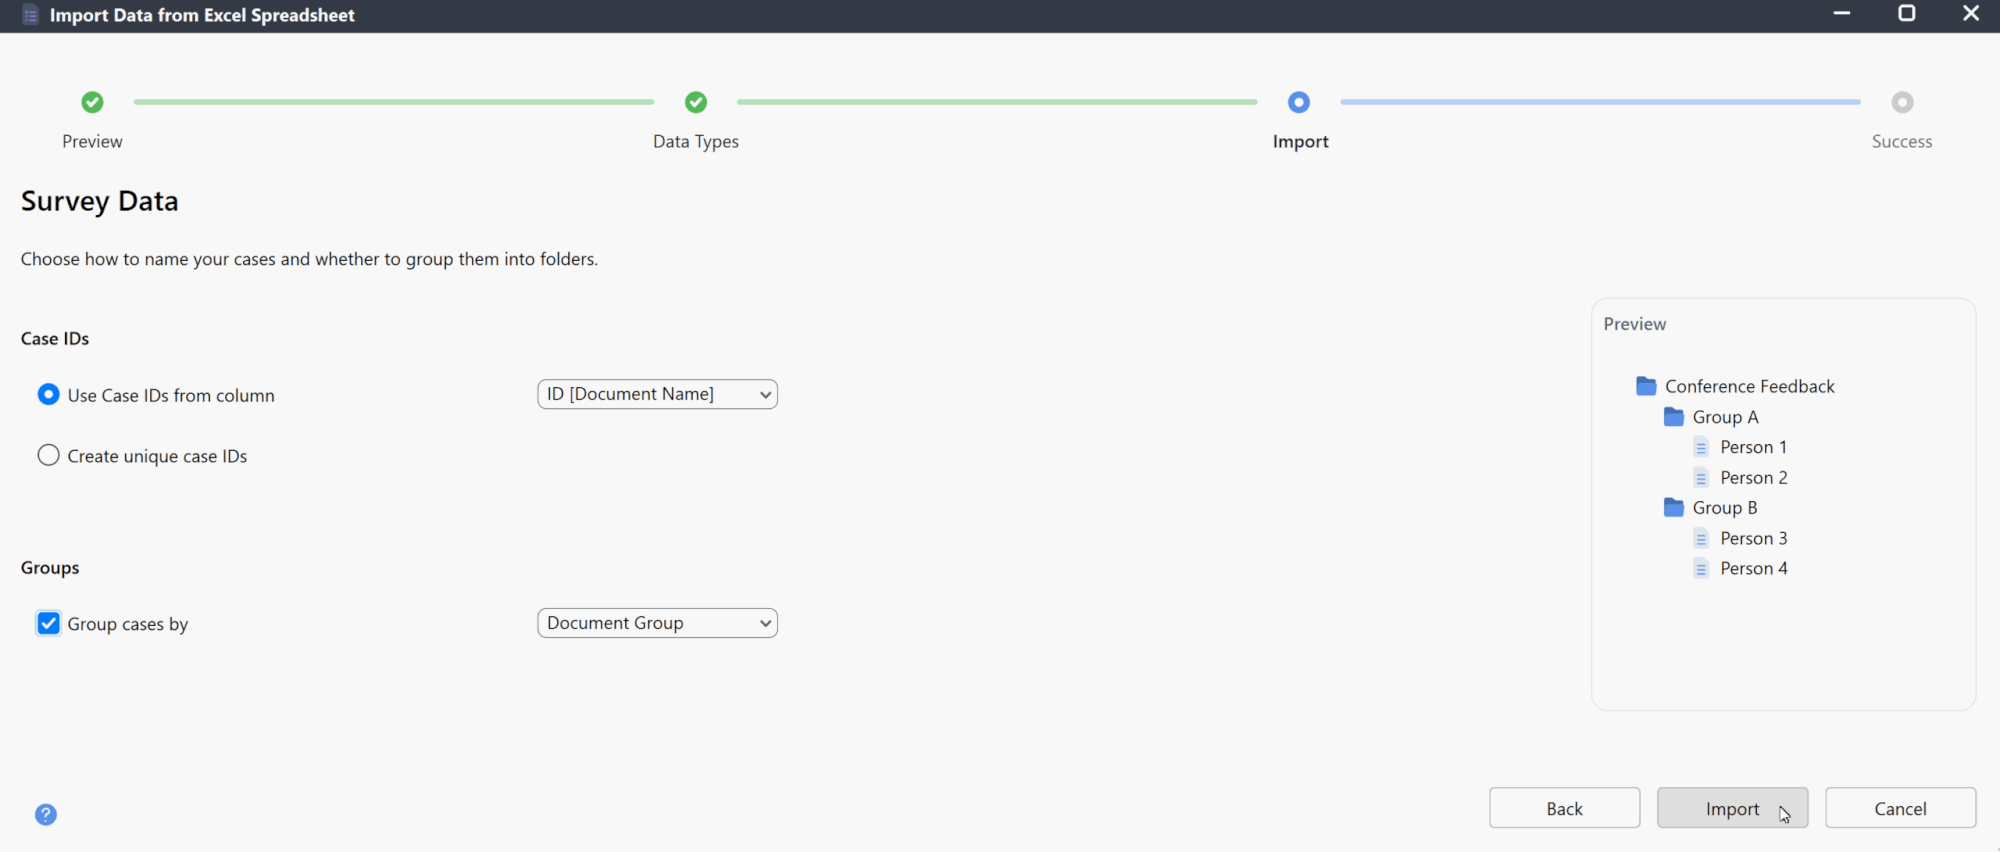
In this step, you decide how MAXQDA should create and organize your cases. Each row in your spreadsheet becomes one case. A preview panel shows how the cases will be grouped.

- Case IDs – choose whether to use values from an existing column (for example, a participant pseudonym) or let MAXQDA create unique IDs automatically.
- Groups – optionally group cases by the values of a selected column. Cases with the same value are placed together in document groups (namely, folders).
Click Import to start the process.
Step 4: Import
MAXQDA now imports your survey data. Cases are created, variables are defined, and qualitative responses are automatically coded. When the import is complete, a confirmation message appears.
How MAXQDA handles imported survey data
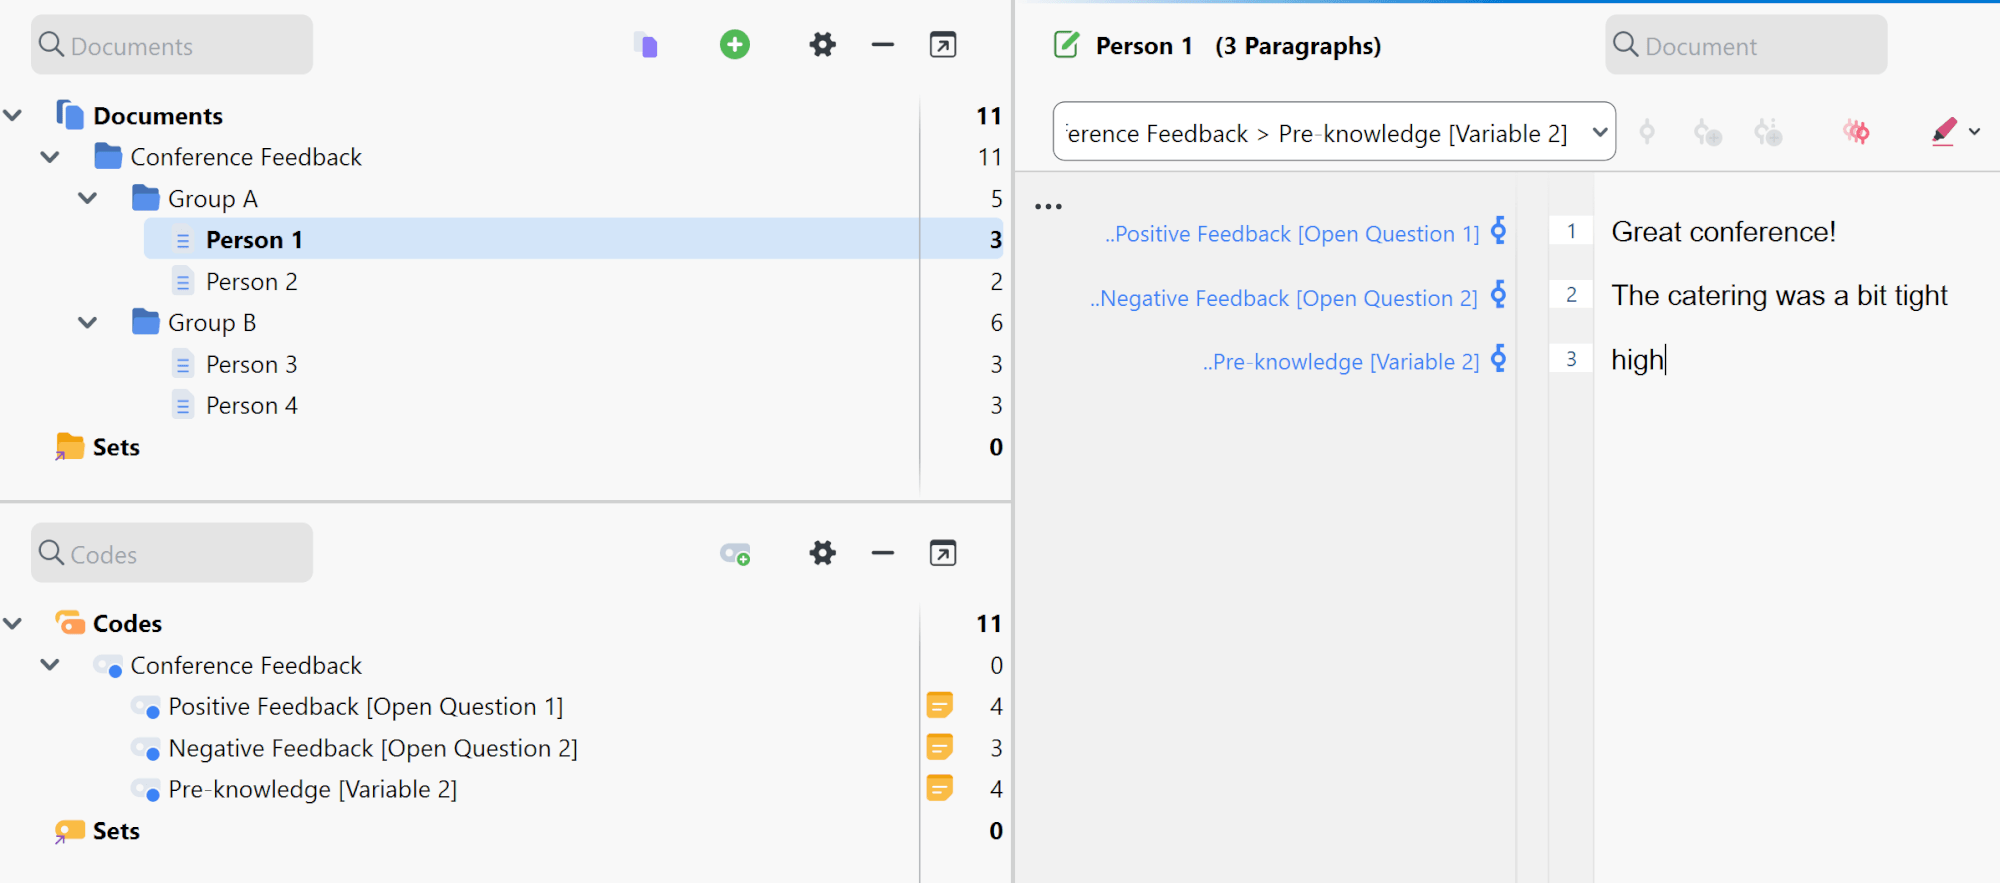
After you import data from an Excel spreadsheet into an empty MAXQDA project, the project will look like this:

In sum, when you import survey data, MAXQDA does the following:
- Creates new document groups if they don't already exist.
- Adds the column headers from left to right as new codes in the code system (only if they're not already there).
- Codes the text in each column with its corresponding header. The full column header is also saved in the code memo.
- Creates new variables if needed, and assigns each document the values from the variable columns.
Once your data is imported, you can proceed to work with it. The section on Survey Analysis walks you through the analysis process.
