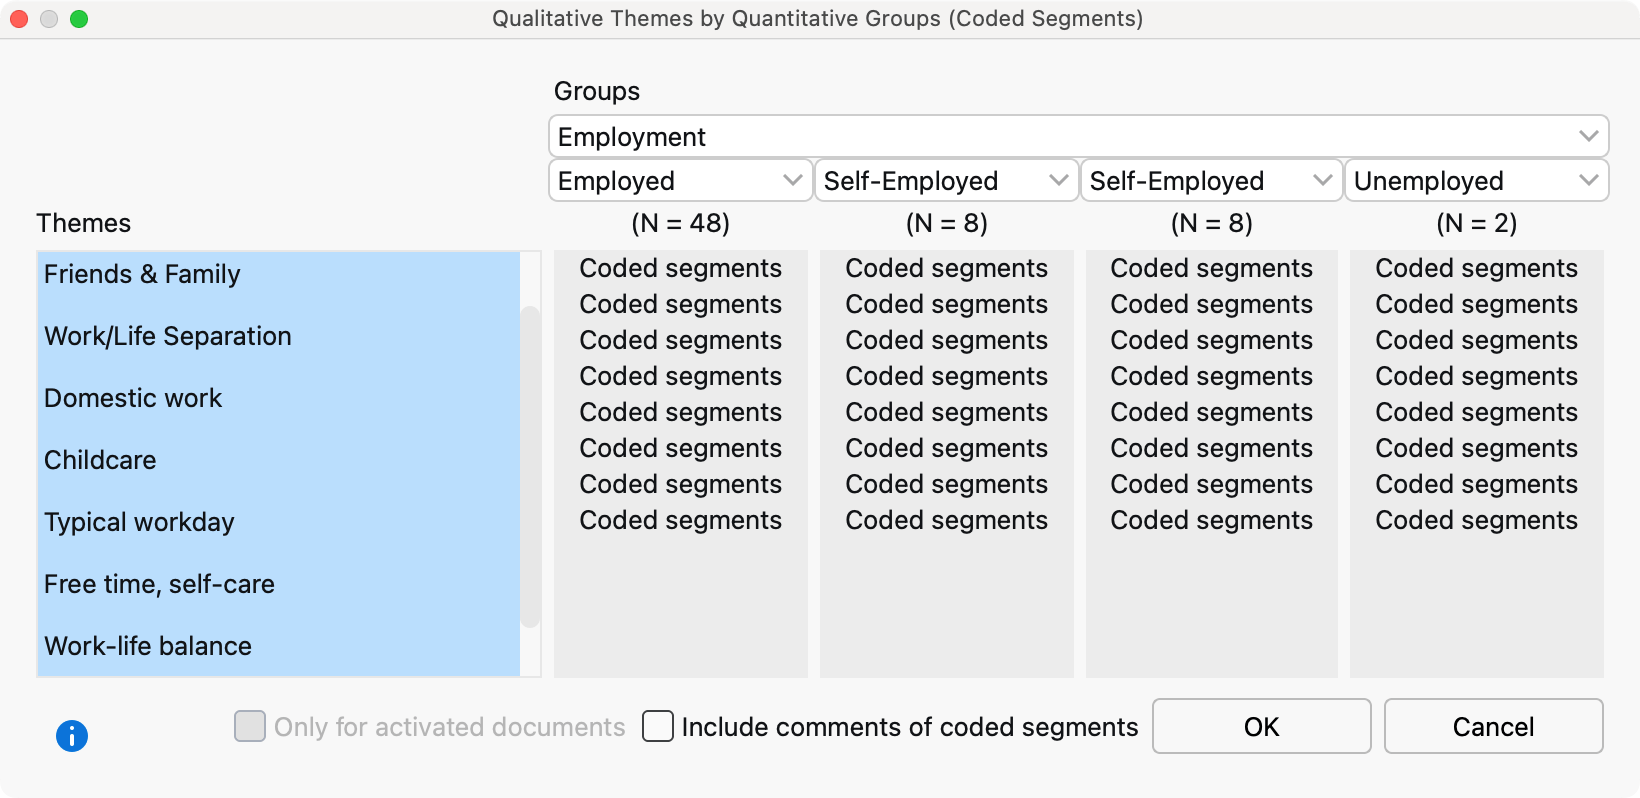
Definition: This joint display integrates data by arraying the qualitative data (segments or summaries) as one dimension and the groups formed by the quantitative data as another dimension.
This joint display is used to compare coded segments or summaries for groups of documents. Documents are grouped based on variable values. The following table is a schematic representation of a joint display for the document variable “Occupation”. Document groups are created based on their occupational status:
Document variable: Occupation | |||
| unemployed (N = x documents) | employed (N = y documents) | self-employed (N = z documents) | |
| Theme 1 (Code 1) | Coded segments / Summaries | Coded segments / Summaries | Coded segments / Summaries |
| Theme 2 (Code 2) | Coded segments / Summaries | Coded segments / Summaries | Coded segments / Summaries |
| Theme 3 (Code 3) | Coded segments / Summaries | Coded segments / Summaries | Coded segments / Summaries |
Each column displays coded segments or summaries from those documents with the corresponding variable value, separated into rows by themes (= codes).
Creating a new display
Navigate to the Mixed Methods menu tab and click on the QUAL Themes for QUAN Groups option either for coded segments or summaries. MAXQDA will open the following dialog:

- Select which groups to compare by selecting a document variable and up to four variable values from the drop-down menus. MAXQDA will include all documents with the corresponding variable value in the final columns of the display.
- You can limit the display to only include currently activated documents by checking the box next to Only for activated documents.
- Drag and drop any number of codes from the “Code System” into the “Themes” box on the left. Codes can be rearranged with the mouse. Codes can be removed from the “Themes” box by dragging the code out of the box or selecting the code and pressing Del key (Windows) or cmd-Backspace (Mac).
- After clicking OK, MAXQDA will open a new window with the joint display. The joint display can be explored intractively. You can find a detailed description on how to operate the results window in the Segment Matrix chapter.
