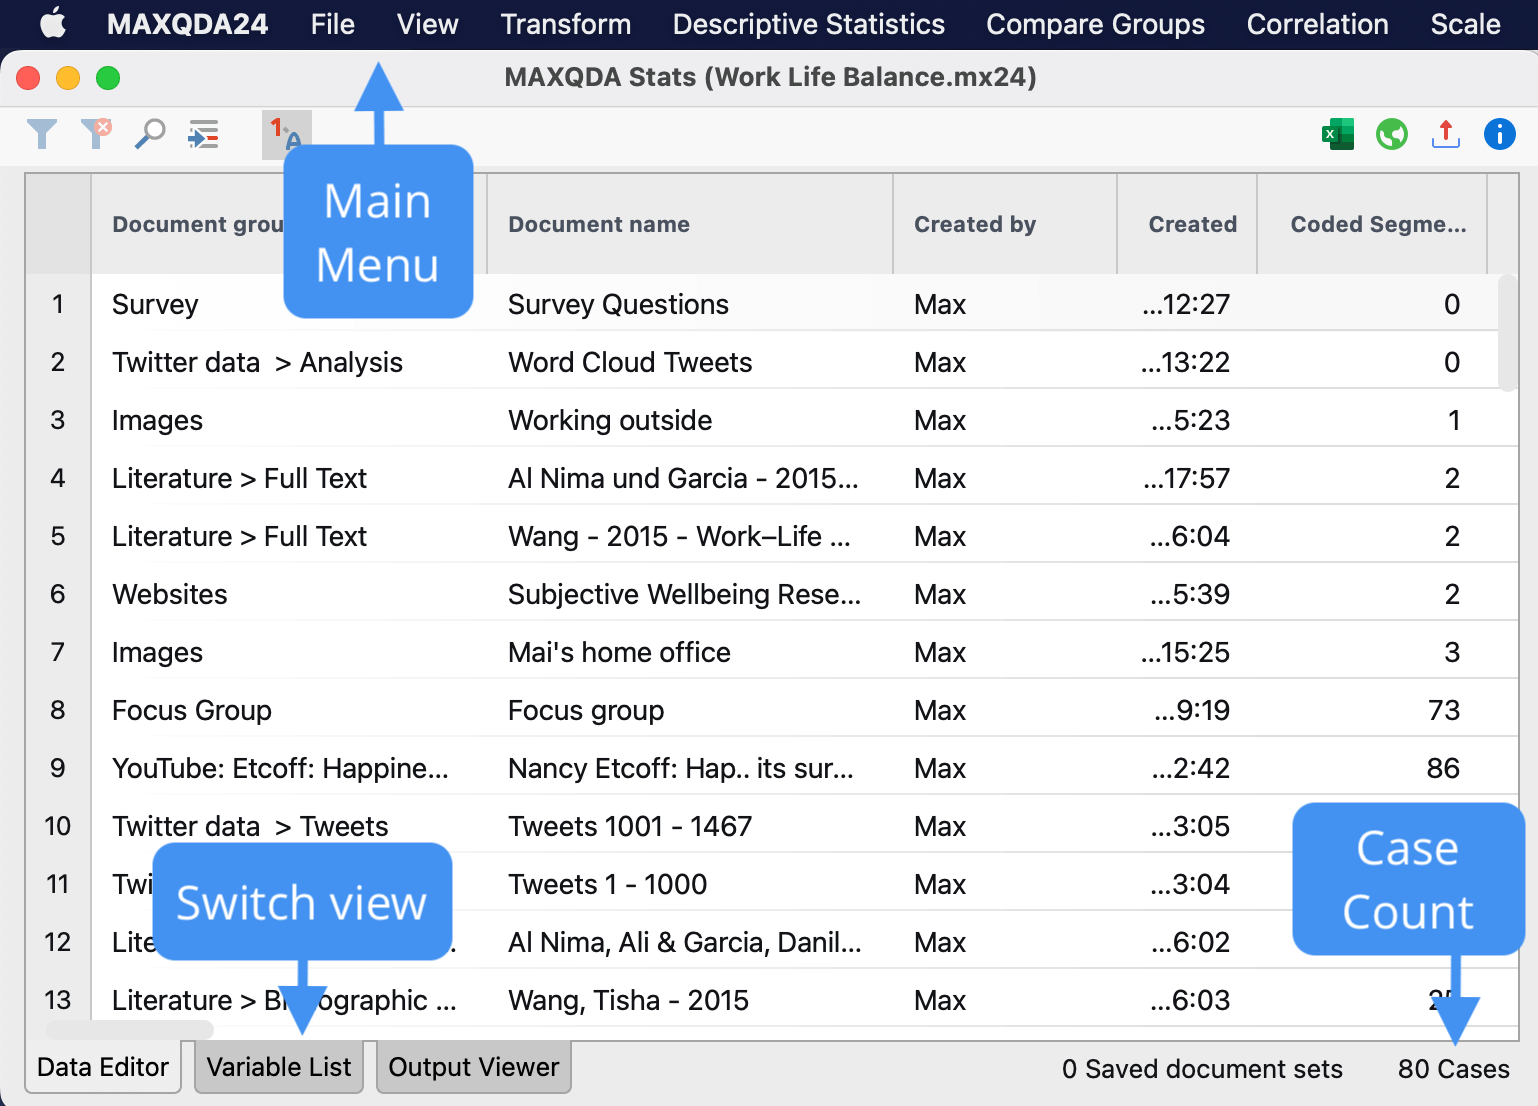
The MAXQDA Stats interface

MAXQDA Stats can be initiated with both the data of a MAXQDA project (document variables and code frequencies per document) as well as with external data (SPSS or Excel files). Upon clicking on the Stats tab, which can be found in the main ribbon bar menu as shown above, the MAXQDA Stats interface appears. Its layout can be seen below:

MAXQDA Stats has its own main menu which contains the following options:
File – this menu item serves to open files, create new files, and store external data
View – this menu item allows the user to switch between the Data Editor, Variable List and output viewer
Transform – contains all the functions for calculating and recoding variables
Descriptive Statistic – contains the functions for the creation of frequency tables and calculating descriptive statistics such as median, mean and standard deviation
Compare Groups – allows the creation of crosstabs and the implementation of one-way analysis of variance
Correlation – begins the calculation of correlation tables
Scale – provides access to the functions for creating scales
The user can easily switch between views using the tabs located in the lower left of the screen.
The Data Editor contains the cases in the rows and the variables in the columns. This is where the individual cases (analysis units) are entered and edited. If MAXQDA Stats is started for a MAXQDA project, the Data Editor for MAXQDA Stats will contain the same data as the Data Editor for document variables as the MAXQDA project, meaning each row corresponds to one document.
In the Variable List variable labels, missing values and other options for variables can be created.
The Output Viewer contains all the results tables and charts that were inserted in the Viewer in the course of the MAXQDA Stats session.
