Function of this model
Using the two-cases model, you can visualize the extent to which codes, e.g. Relevant topics, occur in two cases or only in one case. The frequencies of the codes can be produced per case and their memos can also be integrated.
With the two-cases model, you can contrast two documents, document groups, document sets or a mixture of these levels.
Model display in the map
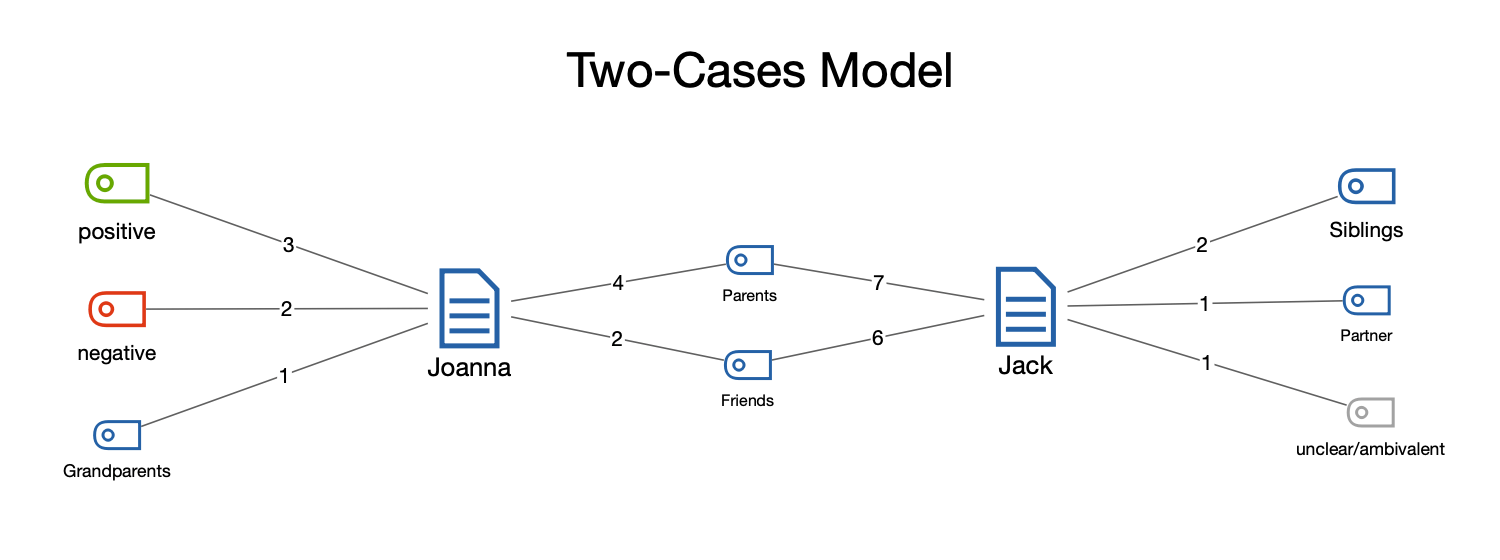
The following figure shows an example of this model:
- The two selected cases (documents in this example) are compared at a fixed distance.
- At the middle between the two cases you will see the codes that appear in both documents.
- The pages contain the codes that were used in only one case at a time.
- The connection lines indicate the frequency of code usage.

Creating a new model and model options
Select New Document Model > Two-Cases Model in the Start tab, and drag two documents, document groups or document sets from the "Document System" onto the map. The following options dialog window will appear:

A preview of the model is shown on the map, taking into account the selected options. Click the Use Model button to use the model as it is currently displayed.
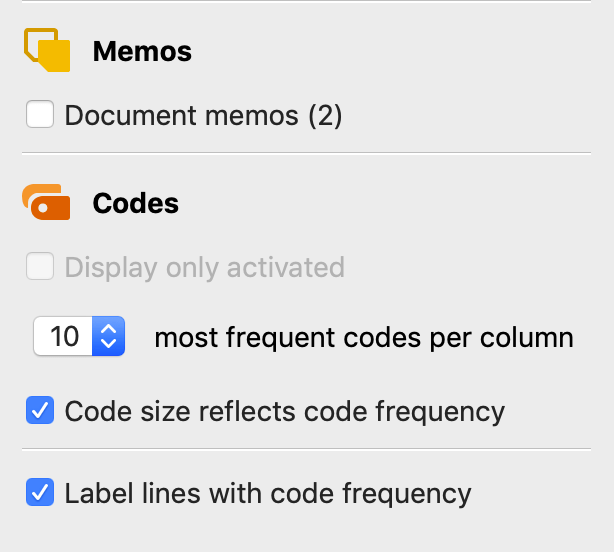
Memo options
Document/Document Group/Document Set memos - If this option is enabled, the two memos belonging to the cases from the "Document System" are integrated into the map.
Code options
Display only activated - When this option is selected, only the codes from the code system that are currently activated are taken into account.
X most frequent codes per column - The maximum number of codes displayed on the sides and in the middle of the map is equal to the number you select here. If the codes have the same frequency, the code above in the code system is preferred.
Code size reflects code frequency - Select this option to display codes with many coded segments larger than codes with few segments. MAXMaps uses three different sizes for the code representation: Codes whose frequencies are in the range of a standard deviation around the mean value are represented in an average size. Codes with more or less coded segments receive a larger or smaller symbol. If the code frequencies are close together, MAXMaps uses only the smallest or the smallest together with the mean symbol size.
Label lines with code frequency - This option ensures that the frequency with which a code has been used in a given case is indicated on the lines.
