With the help of the code coverage function, you can find out to what extent the document has been coded with a particular code. Code coverage comparisons can be applied to multiple documents, document groups and document sets. The tool compares coded symbols, including spaces, in texts, coded areas in images, and coded times in videos.
Starting the function
Follow these steps to define your code coverage:
- First, activate the documents and the codes that you want to include in the analysis. If you want to analyze all documents and all codes, you do not need to activate anything.
- Click on the Code Coverage function in the Analysis tab and select in the appearing menu whether you want to analyze (a) texts, tables or PDF documents (b) images, or (c) videos.

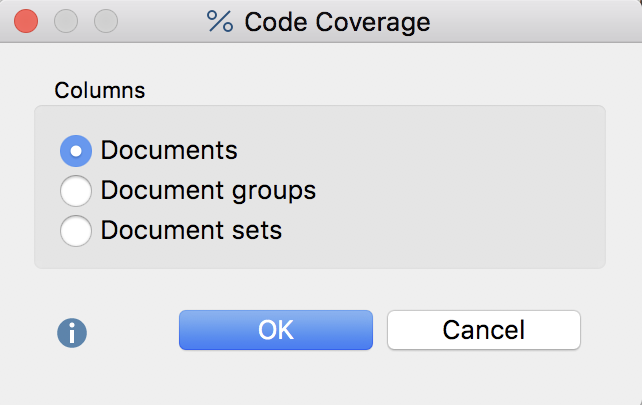
- The following dialog window will then appear in which you can choose to split the results by document, document group, or document set.

The results table for two coded videos, for example, could look like this:

The results table displays the documents, document groups or document sets in the columns, and the selected codes in the rows. In the cells, the extent of the document which is coded with a code with be given as a percentage. In the example above, you can see that 50% of video recording in "Class 6a" was coded with the code "group work", whereas in "class 6b" this percentage came only to 34%. The drop-down menu allows you to define what results are displayed in the cells:
Percentages: none – the absolute numbers are displayed, i.e. the coded characters including spaces (in texts), the coded area (for pictures) and the coded time (for videos).
Percentages of “coded“ – the result cells indicate what percentage of the coded length, area, time of the document was coded with the given code. The sum of the percentages will exceed 100% if the analyzed codes overlap each other at points in the document.
Percentages of entire text/entire image/entire video – the result cells indicate what percentage of the entire document was coded with the respective code. So here it does not matter how much of the text document, image or video was coded overall. The sum of the percentages exceeds 100% if the evaluated codes overlap each other at one or more points in the document.
Row percentages – the result cells indicate what percentage of all evaluated documents, document groups or document have been coded with each respective code. Each row then indicates how the coded segments are distributed as a percentage of the individual documents, document groups or document sets.
The three rows on the bottom end of the table are always displayed and contain the following information:
NOT CODED – provides the length/area/time of the document, document group or document set that has been coded with none of the currently displayed codes.
CODED – provides the length/area/time that has been coded with any of the currently displayed codes.
TOTAL TEXT / AREA / TIME – provides the total extent of the document, document group or document set.
Toolbar
A toolbar with the following functions is located at the top of the "Code Coverage" window:
![]() Only activated documents – restricts the display of the columns to currently activated documents.
Only activated documents – restricts the display of the columns to currently activated documents.
![]() Only activated codes – restricts the display of rows to currently activated codes.
Only activated codes – restricts the display of rows to currently activated codes.
![]() No color highlight – turns off color highlighting of the result cells.
No color highlight – turns off color highlighting of the result cells.
![]() Color highlight refers to columns – the column with the highest value is dark green, that with the smallest is white. The closer a value is to the highest value, the darker its green highlight.
Color highlight refers to columns – the column with the highest value is dark green, that with the smallest is white. The closer a value is to the highest value, the darker its green highlight.
![]() Color highlight refers to rows – the row with the highest value is dark green, that with the smallest is white. The closer a value is to the highest value, the darker its green highlight.
Color highlight refers to rows – the row with the highest value is dark green, that with the smallest is white. The closer a value is to the highest value, the darker its green highlight.
![]() – in this drop-down menu, select the values to be displayed. When starting the function, “percentages of coded" is automatically selected.
– in this drop-down menu, select the values to be displayed. When starting the function, “percentages of coded" is automatically selected.
![]() Show decimals – for easier readability of the percentages, decimal places are switched off by default and can be displayed via this symbol.
Show decimals – for easier readability of the percentages, decimal places are switched off by default and can be displayed via this symbol.
![]() Chart view – creates a frequency table with the calculated values for each column. The frequency table can be turned into a diagram to visualize these results.
Chart view – creates a frequency table with the calculated values for each column. The frequency table can be turned into a diagram to visualize these results.
Exporting results tables
The current view of the result table can be exported using the usual icons on top right of the window. When the highlight is turn on, this is also included.
![]() Copy current display as an image to clipboard – copies the currently visible table as a graphic to the clipboard so it can be pasted directly into a publications or presentation.
Copy current display as an image to clipboard – copies the currently visible table as a graphic to the clipboard so it can be pasted directly into a publications or presentation.
![]() Export – MAXQDA creates a spreadsheet as an Excel file (XLS / X format), as a webpage (HTML format) or as a text document (RTF format) after you have entered filename and location.
Export – MAXQDA creates a spreadsheet as an Excel file (XLS / X format), as a webpage (HTML format) or as a text document (RTF format) after you have entered filename and location.
Displaying results tables as a chart
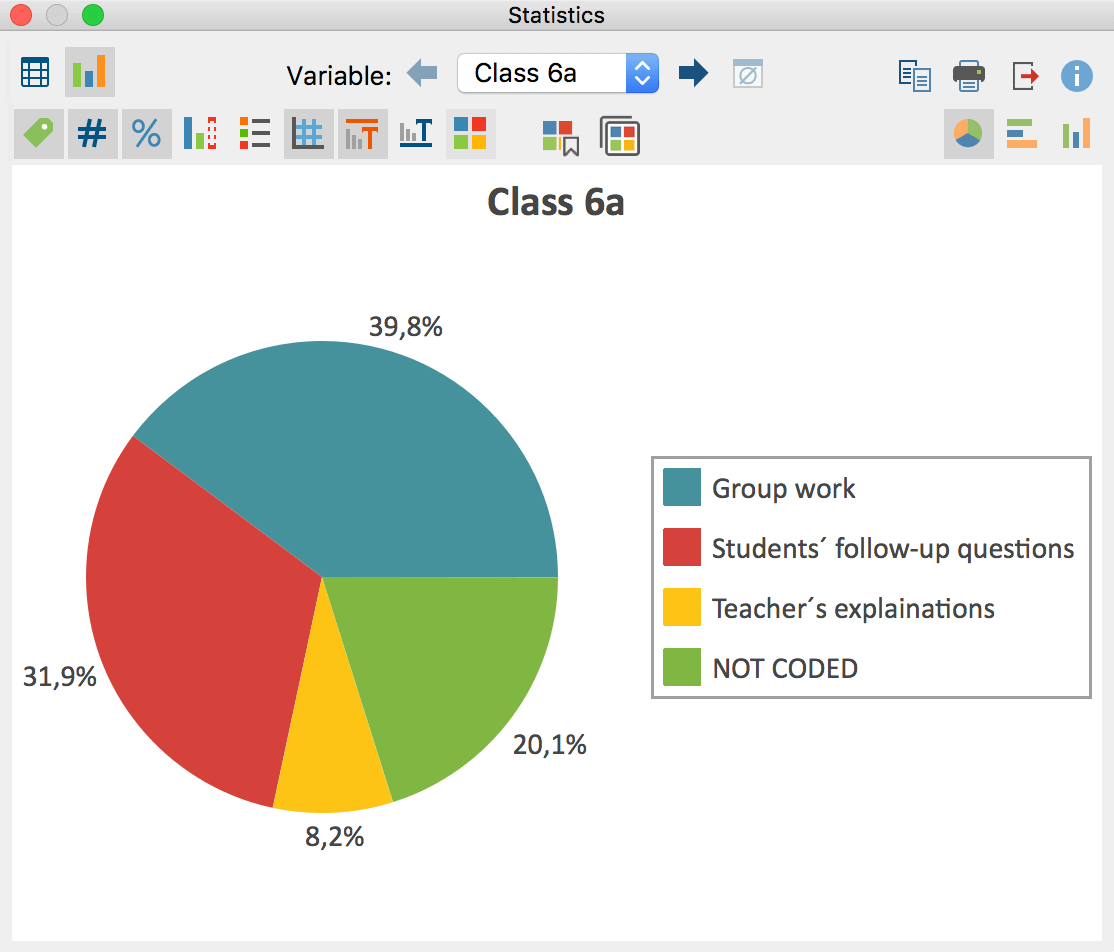
Your results can be displayed as frequency table or as a chart. In the "Percentage" column, the percentages are displayed relative to the total area, in the column "Percent (Valid)" relative to the encoded area.
Clicking on the diagram symbols above the frequency table show a vertical or horizontal bar chart, or a pie chart. By activating the missing values, the graphic figures show the percentages related to the total area.

Refer to section Frequency Tables and Charts for Subcodes for information on creating and customizing charts.
