MAXQDA lets you open several table overviews that list project data such as coded segments, memos or variables. In the Reports tab you can find many of these, the contents of which always refer to the whole project:

Overviews in MAXQDA can be customized as in Excel or other similar spreadsheet programs. For the following example, we’ll use the table view of the document variables in MAXQDA:
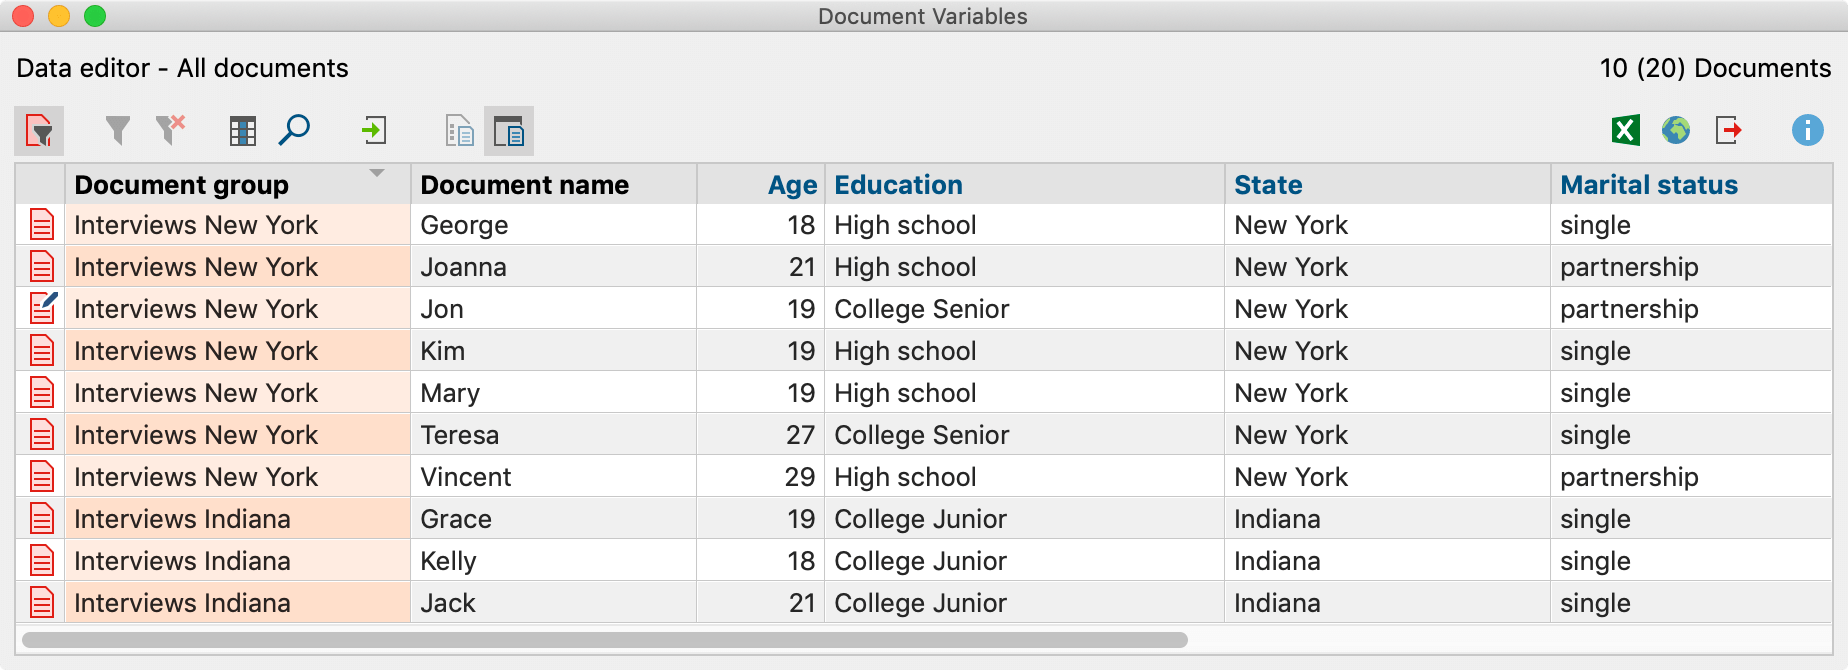
The heading of each column has the name of each variable, although the standard MAXQDA system fields are written in a different font color:
- Document group – the name of the Document group in which the document is found
- Document name – the name of the document
- Creation date – the date on which the document was imported
- Number of coded segments – the number of coded segments in the document
- Number of memos – the number of memos in the document
- Author – the user that was logged in when the document was imported
Adjusting column width and position
The width of each column can be changed by clicking and dragging the border between the columns. Double-clicking on the column header border to the right of the column resizes the column to its optimal size, so that the contents of each row can be fully seen.
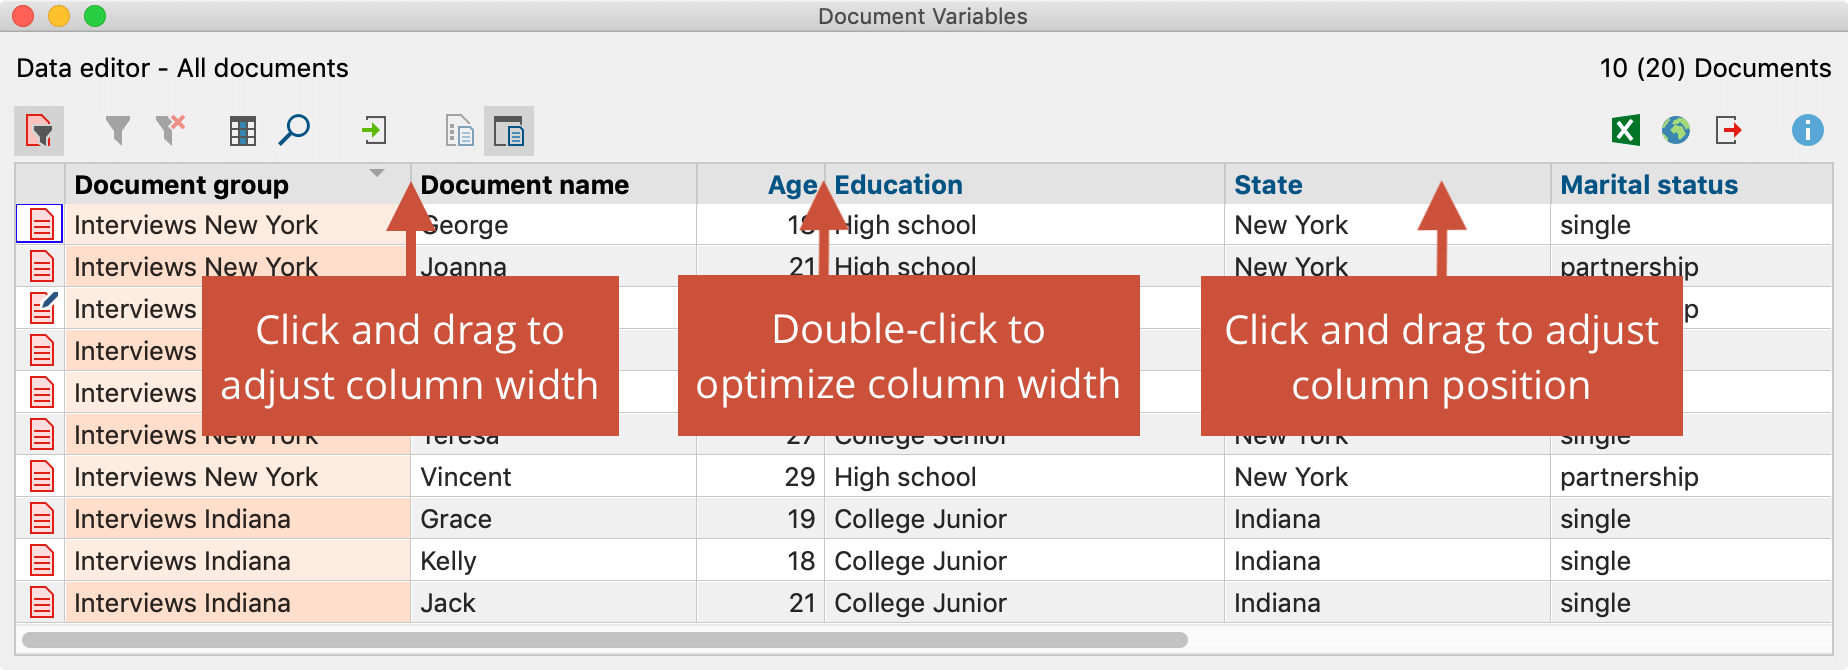
It is also very easy to change the order of the columns. You just need to click on a column header and drag it to the place you wish to have it.
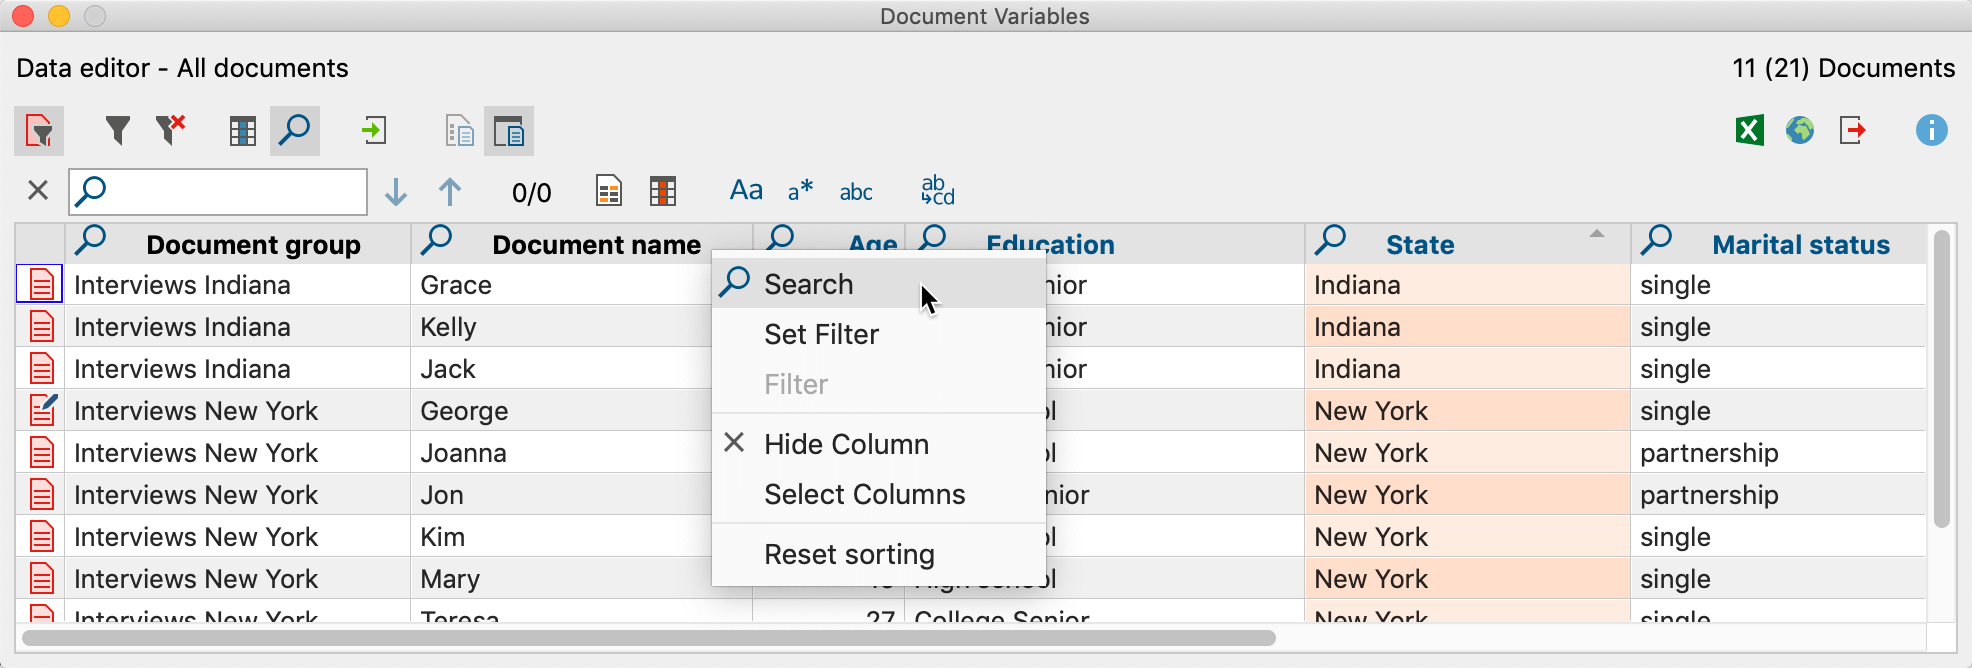
By right-clicking on a column header, the context menu appears for that particular column. This includes various options, including the option to hide the column or search within the column. The Select field option opens a window where you can select which of the columns should be viewed in the standard view.
Sorting tables
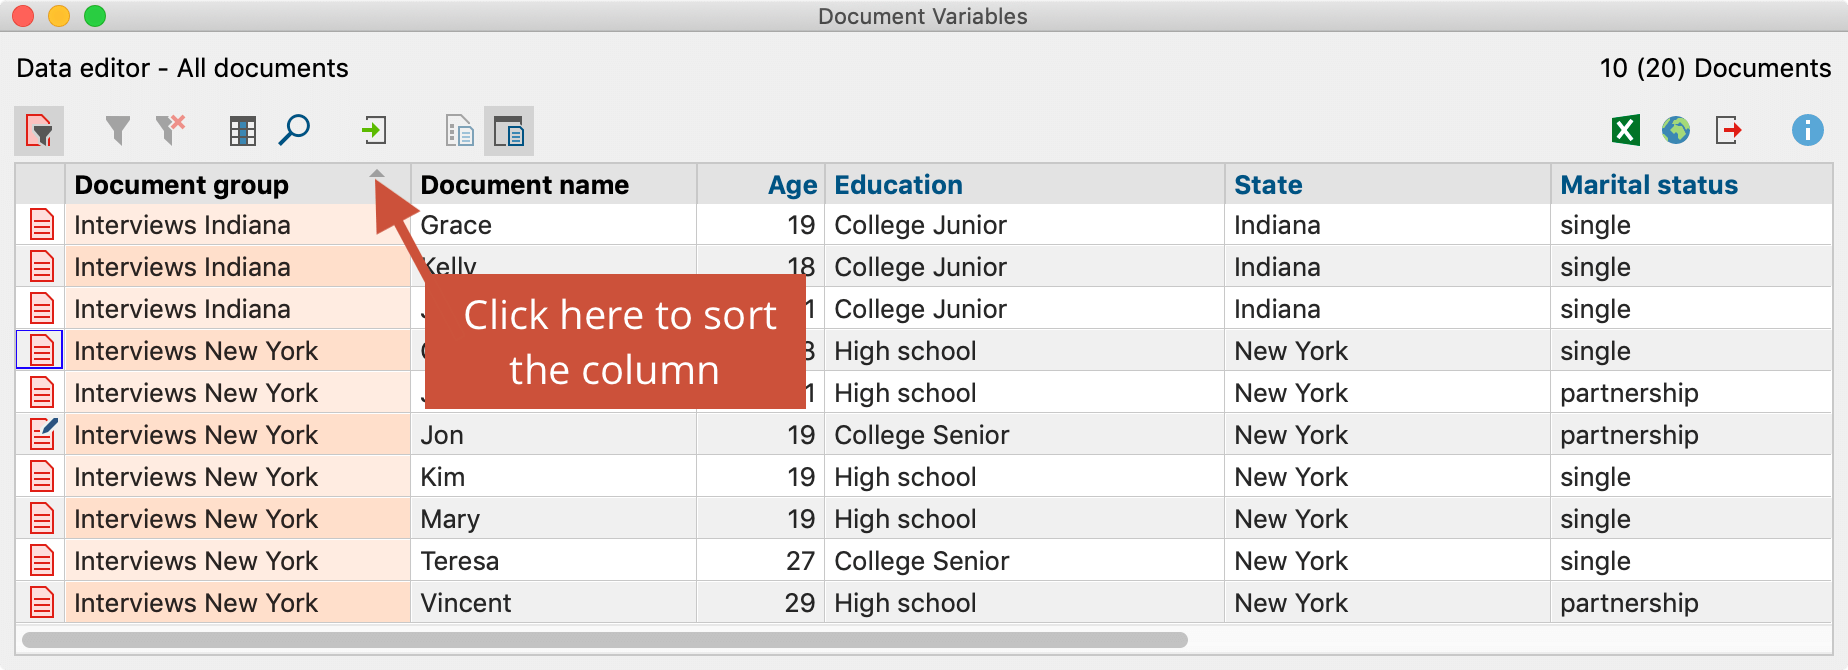
Tables can be sorted alphabetically or in reverse alphabetical order. Clicking once on the column header sorts it alphabetically; clicking a second time sorts it in reverse. A small triangle appears inside the column header of the column that is currently being used to sort the table and whether it is sorted alphabetically or in reverse alphabetical order.
In the editable cells of the table, you can enter or change a value by double-clicking on the cell and then typing the value.
Selecting rows in a table
The table contents can also be selected and copied into the Windows clipboard. The selection of one or multiple rows, or a section of the table, is done as follows: A single cell can be selected by simply clicking on it, and additional cells can be added to the selection by holding the Ctrl key (Windows) or Command key (Mac) and a section of the table can be selected by clicking the first and last rows to be included while holding down the Shift key. In MAXQDA, the selected sections of a table are highlighted in green.
You can also search for certain values within each column of tables in MAXQDA. You only need to right-click on the column in which you want to search and select Search. In string fields, the search will start with the initial character. If you wish to search for a certain word or phrase that does not have to appear at the beginning of the value, you can use the asterisk (*) at the beginning of your search.
Context menus for tables
All overviews in MAXQDA have context menus that can be called up by using the right mouse button. The number of options that appear in the context menu depends on the overview. It is usually possible to delete a selection (e.g. a coded segment or memo). In the Overview of Coded Segments, you also have the option to change the weight score of each segment. The most options are available in the document variables table.
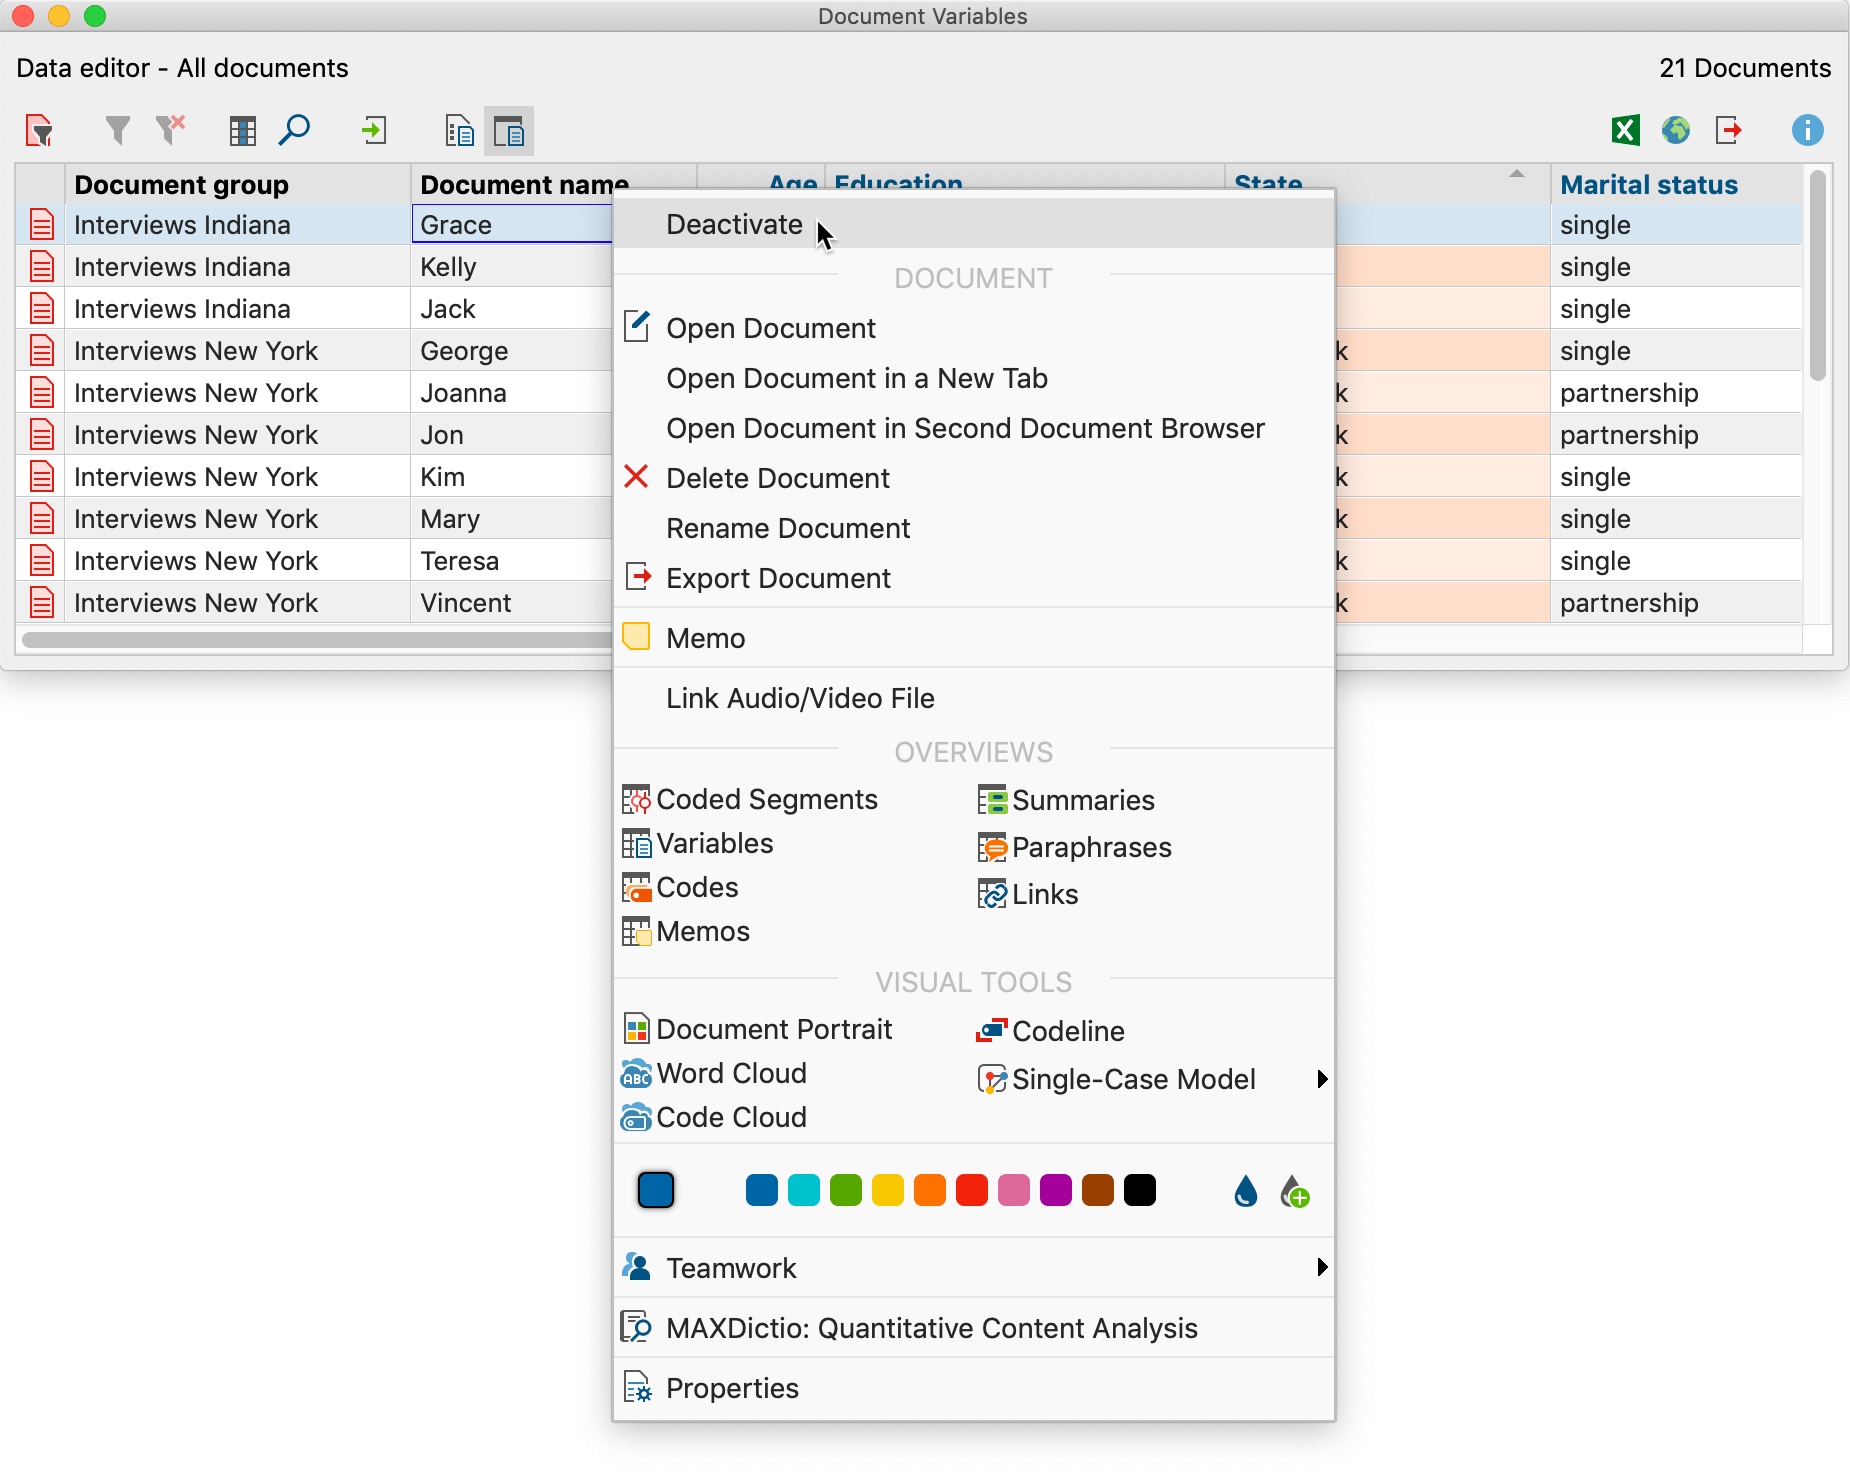
Table overviews with a detailed display
The Overview of Coded Segments differs from, for example, from the Overview of Variables in that it is divided into two parts. The lower section is used just as in other tables. The upper section serves as a detailed view. Here, the coded segment, or text or image segment itself that is selected in the bottom section appears. The same applies to the “Overview of Memos”: Here the detailed view of the memo will appear.
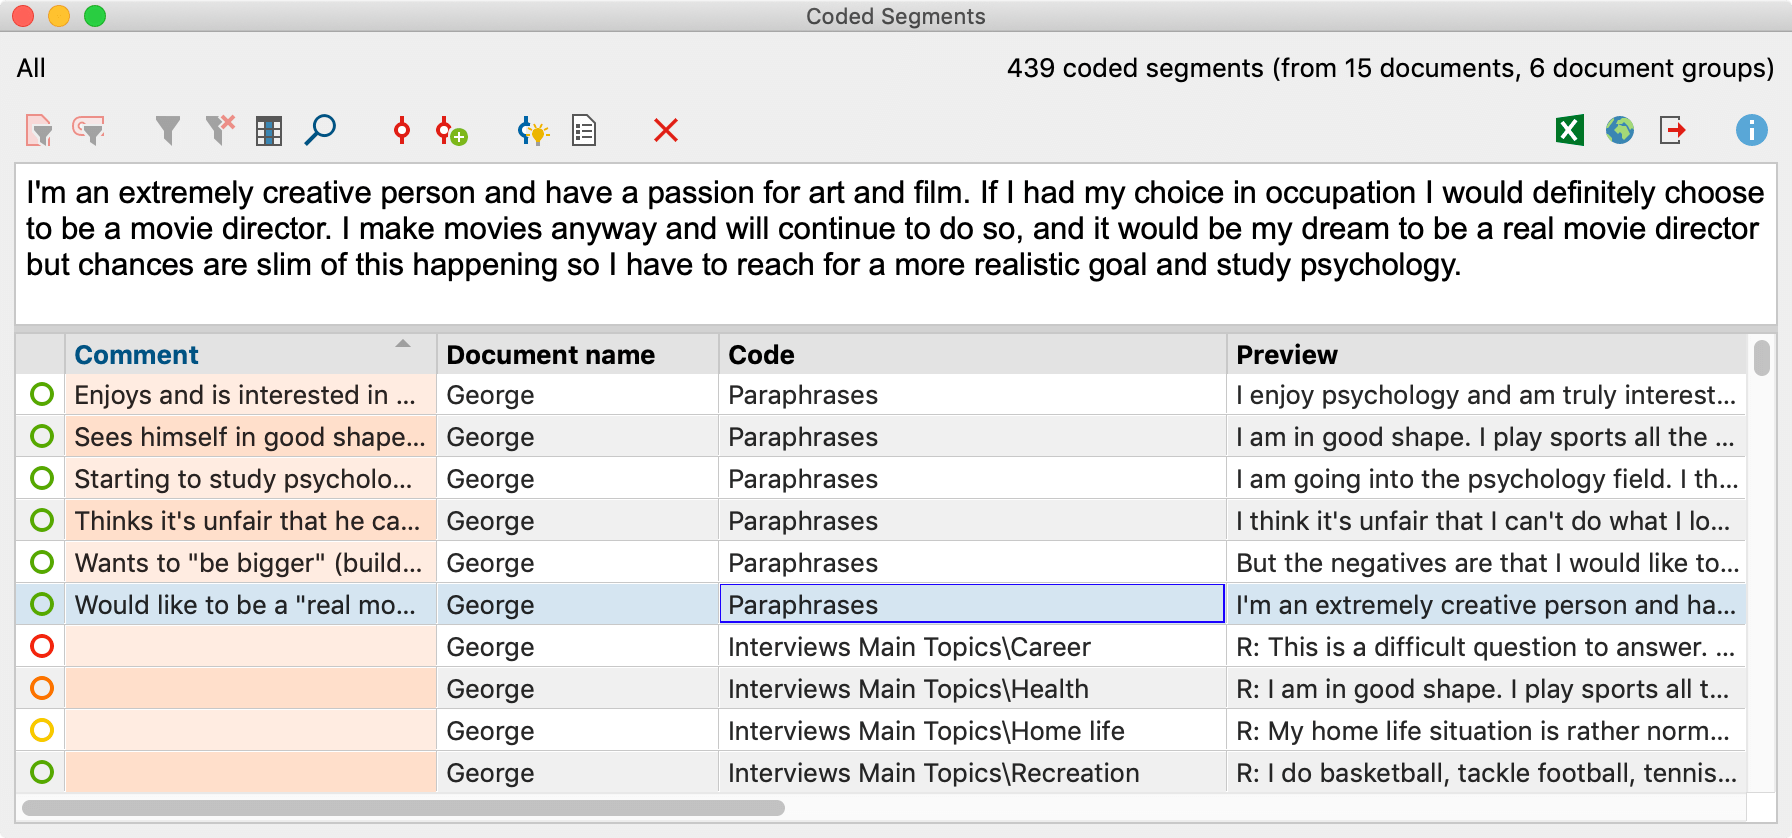
The toolbar in table overviews
There are many situations in MAXQDA where table overviews are used to display information, and they are similar in how they can be worked with, which is similar to the handling of tables in Excel. All table overviews have a toolbar offering quick access to frequently-used functions.
The overviews include various icons in the toolbar depending on their function and purpose. The following icons are found in nearly all of these toolbars:
![]() Only activated documents – Displays only the rows in which activated documents appear. The icon can only be clicked when at least one document is activated.
Only activated documents – Displays only the rows in which activated documents appear. The icon can only be clicked when at least one document is activated.
![]() Only activated codes – Displays only the rows in which activated codes appear. The icon can only be clicked when at least one code is activated.
Only activated codes – Displays only the rows in which activated codes appear. The icon can only be clicked when at least one code is activated.
![]() Switch on Filter – Turns the filter for the columns on and off. The icon can only be clicked when a filter has been set for at least one column. Set the filter by right-clicking on the column header.
Switch on Filter – Turns the filter for the columns on and off. The icon can only be clicked when a filter has been set for at least one column. Set the filter by right-clicking on the column header.
![]() Reset all filters – Deletes the defined filter for all columns of the table.
Reset all filters – Deletes the defined filter for all columns of the table.
![]() Search – Turns the search toolbar for the table on and off.
Search – Turns the search toolbar for the table on and off.
![]() Excel table – shows the current table in an Excel document. This does not happen within MAXQDA, but can be printed out or saved as a separate file.
Excel table – shows the current table in an Excel document. This does not happen within MAXQDA, but can be printed out or saved as a separate file.
![]() HTML table – shows the current table in an HTML document. This can also be saved or printed out, but is no longer connected to your MAXQDA project.
HTML table – shows the current table in an HTML document. This can also be saved or printed out, but is no longer connected to your MAXQDA project.
![]() Export – saves the content of the table in diverse formats including Excel (XLS/X) or Website (HTML) and opens the file. Unlike the two functions above, you can choose the file name and location. This exported file is also no longer connected to your project file.
Export – saves the content of the table in diverse formats including Excel (XLS/X) or Website (HTML) and opens the file. Unlike the two functions above, you can choose the file name and location. This exported file is also no longer connected to your project file.
Searching in table overviews
To search through a table, click the icon ![]() in the header of the overview. Another toolbar will then appear where you can enter a search term.
in the header of the overview. Another toolbar will then appear where you can enter a search term.
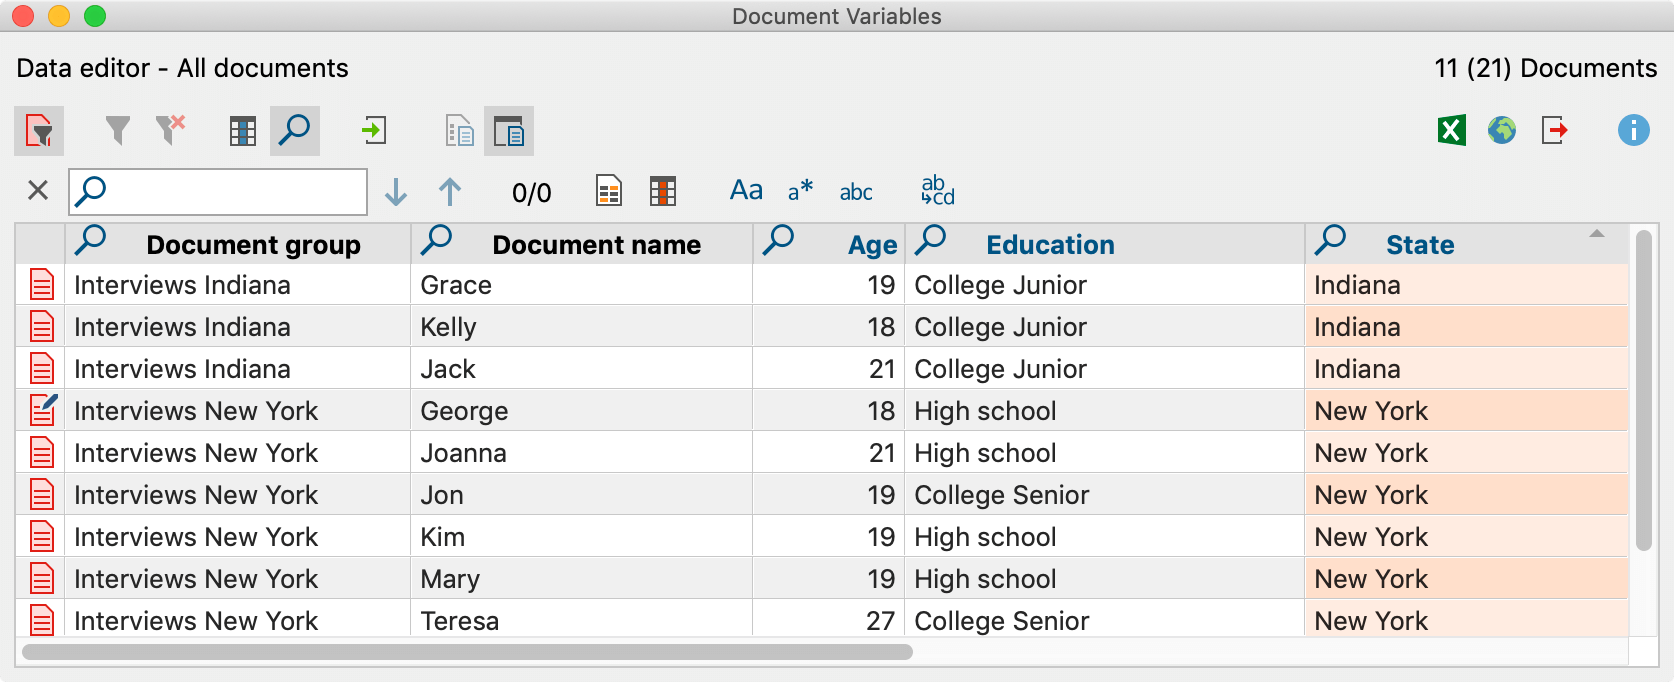
![]() Highlight rows with hits – Highlights the rows in which the search term appears.
Highlight rows with hits – Highlights the rows in which the search term appears.
![]() Choose search columns – Allows you to select the columns in which to search.
Choose search columns – Allows you to select the columns in which to search.
![]() Find & replace – Allows you to enter a term to replace hits. Only hits that the user has permission to change will be replaced. In the Data Editor for Document Variables shown above, the values of the user variables with blue headers can be adjusted, for example, but not the document names or the number of coded segments.
Find & replace – Allows you to enter a term to replace hits. Only hits that the user has permission to change will be replaced. In the Data Editor for Document Variables shown above, the values of the user variables with blue headers can be adjusted, for example, but not the document names or the number of coded segments.
Filtering table overviews
Table overviews can easily be filtered. For example, in the Data Editor you can display only the rows with documents containing more than 20 codes or whose names begin with “B”:
- Right-click on the heading of the column you wish to filter, and select the Set Filter option. (If a filter is already set for the column, this option is called Edit Filter.)
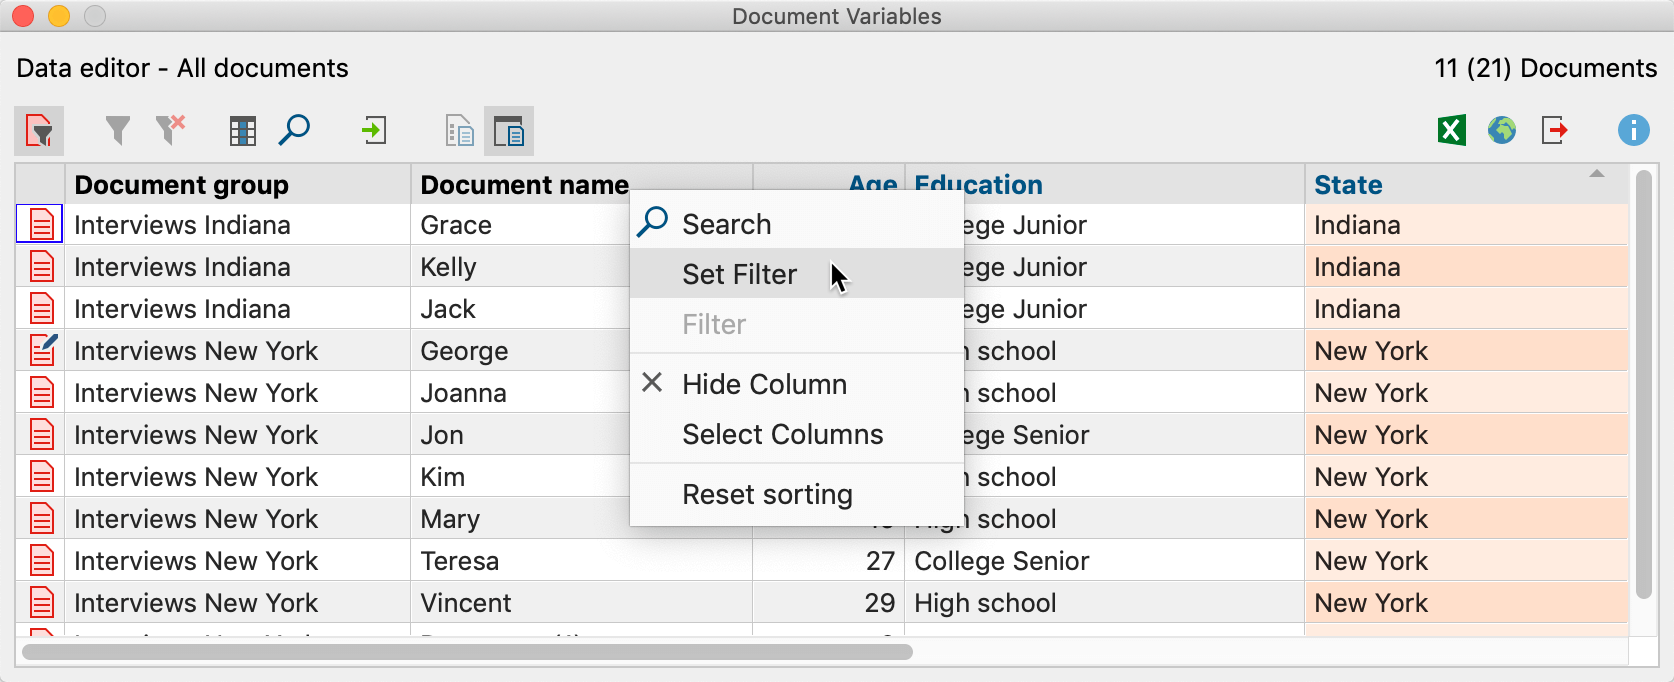
- Set the desired filter options in the window that appears.
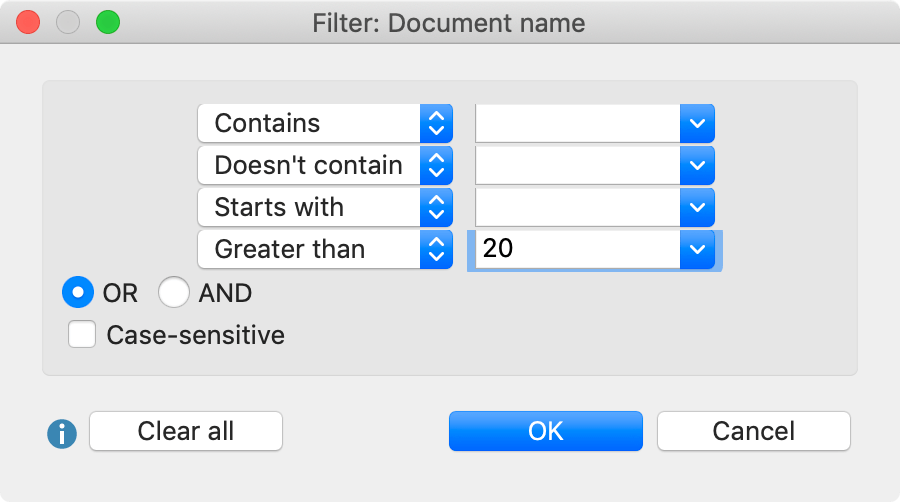
In all four input fields, you can define criteria to filter. The following criteria are available:
- Contains
- Doesn’t contain
- Starts with
- Greater than or Lesser than (applies to both numbers and the alphabet)
- Earlier than and Later than (available only in columns containing a date)
OR/AND: Here you can select the manner in which the four input fields are combined. With OR, the rows in which at least one of the criteria applies are listed. With AND, the rows in which all of the criteria apply are listed.
Case sensitive – When this option is selected, you can differentiate based on whether the text in the text column appears in upper or lowercase. In this case, if “interview” in lowercase appears in the filtered column, “Interview” beginning with an uppercase letter would not be taken into account.
After clicking OK, MAXQDA filters the table overview according to the defined criteria. At the top right MAXQDA indicates how many of the originally existing rows are currently displayed.

If you set a filter for multiple columns, they are combined with the AND function.
You can switch a filter for a table overview on or off at any time using the Switch on Filter ![]() icon, to toggle the view between all rows and filtered rows.
icon, to toggle the view between all rows and filtered rows.
If you wish to delete all defined filters in an overview, click on the Reset all filters ![]() icon.
icon.
