Evaluative categories in (qualitative) content analyses
In many research projects, forms of evaluative qualitative content analysis are used. The standard steps are to: (1) define evaluative categories, usually with ordinal variables, (2) code text segments, and (3) analyze the data descriptively and statistically. A good example of this form of analysis process is found in Philipp Mayring’s chapter on qualitative content analysis found in “A Companion to Qualitative Research” (Flick, et al., 2004), which describes scaled variations of structure content analysis.
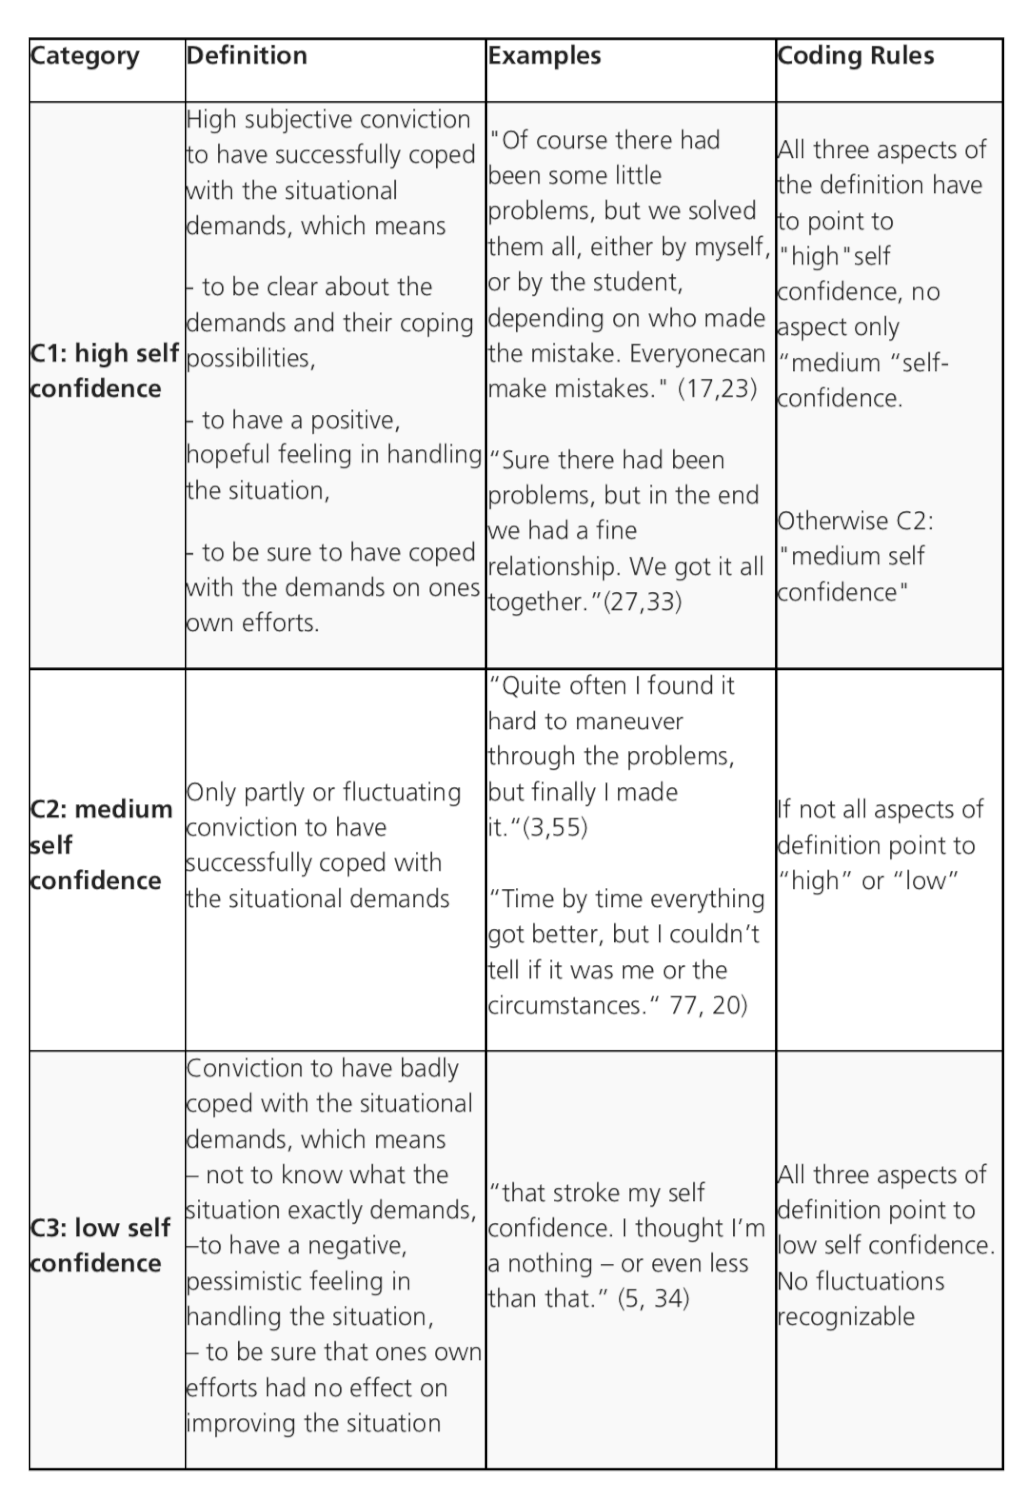
In one of Mayring’s detailed examples from a study on student teachers, a category called “self confidence” is created with three options: “high,” “medium” and “low” (see below). These categories were developed from the material – one can see from the following figure that the categories are not only precisely defined, but also empirically supported with the help of the anchor examples in the material.

The coding process, which is standard procedure for content analysis, has the researcher working through the entire data set and assigning evaluative codes to appropriate text segments that have to do with “self-esteem.” This means that every single text segment that connects to self-esteem will be assigned the code “high,” “medium” or “low” on the basis of the coding guidelines established.
At the end, each case (in the case of interviews, a case would be an interviewed person) can be analyzed as a whole and given a summary characterization as having “high,” “medium” or “low” self-esteem. Cases characterized as having high self-esteem can then be compared with those with low self-esteem. Code frequencies can also be compared and used in combination with other categories in crosstabs.
Principles of application in MAXQDA
The method for evaluative content analysis can be done in MAXQDA in the following way. First, the category “self-esteem” is created as a code with the subcodes “high,” “medium” and “low.” The definitions of these codes along with anchor examples can be created as code memos.
Now the material will be analyzed, meaning that each document is read line by line. The text segments that have to do with self-esteem are identified and then coded with the appropriate code (e.g. “high” self-esteem). After an entire text has been worked through in this way, the researcher will have one of the following situations:
- Text segments about self-esteem in this document were all coded with the same subcode (e.g. “medium” self-esteem). In this situation, the entire case can be said to have a medium level of self-esteem.
- Text segments about self-esteem in this document were coded with various subcodes, but one of those subcodes obviously occurs more often (e.g. three with “high” self-esteem and one with “medium” self-esteem). In this situation it makes sense to give the whole case that level of self-esteem that is coded most often.
- Text segments about self-esteem in this document were coded with various subcodes, and none of them clearly occur more often than the others (e.g. two with “medium” self-esteem and two with “high” self-esteem). In this situation, a quick categorization cannot be made, so the coded segments should be compared to one another by the coders, who then make a decision about which categorization is more appropriate.
- No text segments were coded with self-esteem subcodes, meaning the document does not contain any information about this theme. None of the subcodes can be used to categorize this document, and will need to be treated as a “missing” value.
The “Transform into a Categorical Variable” function
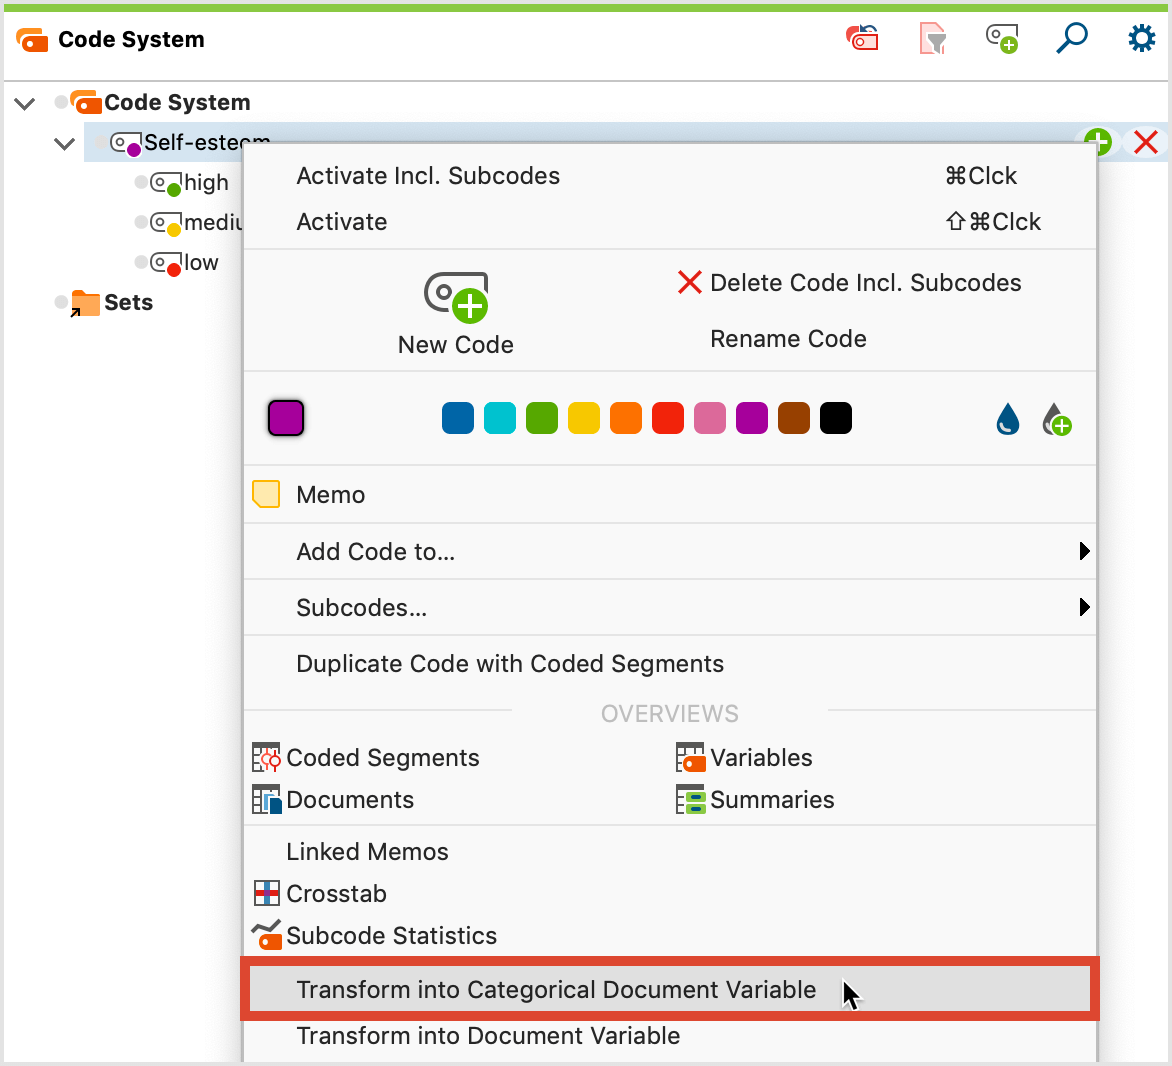
After coding the appropriate text segments, the “Self-esteem” code can be transformed into a categorical variable by right-clicking on the code and selecting the appropriate option in the menu that appears.

After this option is selected, MAXQDA performs the following actions:
- A new categorical variable is created in the List of document variables with the name of the code that it was created from (in this case, “Self-esteem”).
- All cases (documents) in the “Document System” are evaluated according to the rules explained above.
a) Each case is assigned the value of the subcode that occurs the most often.
b) If there are two or more subcodes used the same numbers of time, it is labeled “undefined.”
c) If none of the subcodes are used at all, no value is assigned. If the table is exported to a statistical software, empty values are usually treated as “missing.” - Immediately afterwards MAXQDA opens the "Data Editor for Document Variables".

Dynamic properties of categorical variables
In MAXQDA‘s List of document variables, the categorical variables have a special status. One recognizes them in the list, because they have a green square in the first column and are created from a “Code” as seen in the “Source” column; categorical variables are defined as text variables, and the texts are taken from the “Code System” (in this case “high,” “mid” or “low”).

Categorical variables are dynamic, which means they are updated automatically when new segments are coded in the documents. This is also the case for documents that are imported after the categorical variable has already been created; when one codes this new document, the variable label changes accordingly.
Categorical variables in the context of MAXQDA's mixed methods functions
Categorical variables lend themselves very well to use with MAXQDA’s mixed methods functions. With the Activate documents via variables function, for example, one can choose to activate only those documents with a certain variable value. This is helpful for answering research questions such as “How do student teachers with low self-esteem experience their situation in the school system? How do they approach disciplinary issues?”
The Crosstabs function offers an aggregated overview of the number of coded segments in certain categories in the “Code System” for each of the three self-esteem variables. The self-esteem characterizations are shown in the columns on the x-axis, and the selected codes are shown in the rows on the y-axis. Using the self-esteem example, the Crosstabs function could count the number of times that student teachers with low self-esteem talk about disciplinary issues in comparison to the number of times student teachers with high self-esteem talk about the issue. One can then easily call up the document segments counted in each cell in the “Retrieved Segments” window.
One can also use the Quote Matrix to see a detailed table of the document segments, each column holding those segments that occur in documents with a specific categorical value. In our self-esteem example, one column could hold those statements about a certain topic that come from student teachers with high self-esteem, and the other column could display those statements from teachers with low self-esteem.
The Typology Table uses categorical variables similar to the way the Crosstabs function does; a table is created with the categorical variable values in the columns. In this case, however, the variables are analyzed rather than the categories. One could look, for example, what percentage of people with high self-esteem are older than 30 years and what percentage are younger, or whether good grades in teacher certification exams seem to connect in any way to self-esteem, etc.
