Functions of this model
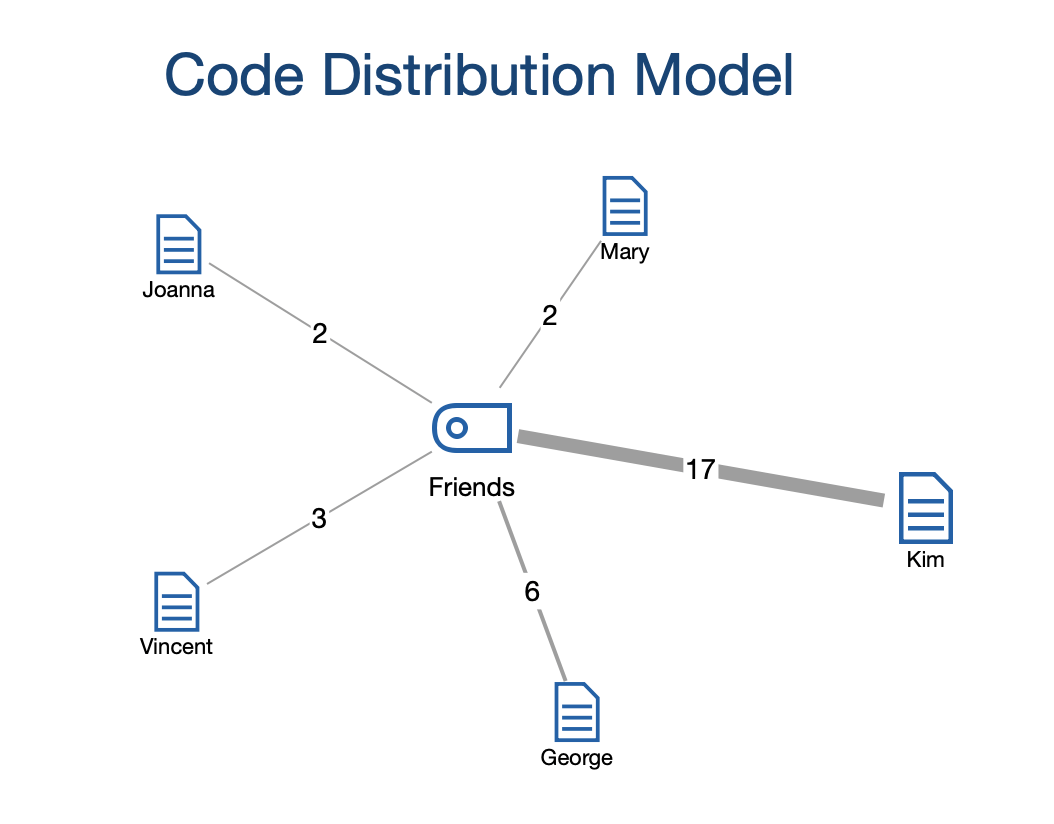
The Code Distribution Model is suitable for illustrating how often a selected code occurs in which documents.
Display in the map
The symbol of the selected code is placed in the middle and around it the documents in which the code was assigned are displayed in a circle connected by lines. If desired, the frequency of a code can be displayed on the connecting line. The code frequencies can also determine the line thickness and the size of the document symbol.

Creating a new model and determining its structure
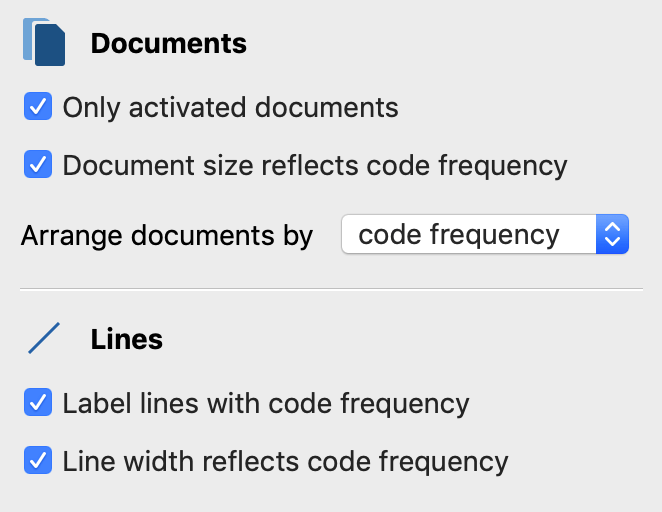
After you have selected the Code Distribution Model in the Start tab via New Code Model, drag a code from the "Code System" to the MAXMaps workspace. The following options dialog will appear:

A preview of the model is shown on the map, taking into account the selected options. Click the Use Model button to use the model as it is currently displayed.
Document options
Only activated documents - If this option is selected, only documents that are currently activated will be integrated into the map.
Document size reflects code frequency - Use this option to display documents with many coded segments larger than documents with few segments. MAXMaps uses three different display sizes: Documents with frequencies in the range of a standard deviation around the mean value are displayed in a medium size. Documents with more or less coded segments receive a larger or smaller symbol. If the code frequencies are close together, MAXMaps uses only the smallest or the smallest together with the mean symbol size.
Arrange documents by code frequency / document system - You use this option to determine the sequence of the documents. Sort by frequency starts on the right with the document with the most coded segments, sort by "Document System" with the document that is at the top of the list in the document system.
Line options
Label lines with co-occurence frequency - Shows how often the code was assigned in the linked document on the lines.
Line width reflects co-occurence frequency - If this option is enabled, the more segments are assigned to the code in the respective document, the thicker the connection lines will be drawn.
