The analysis of tweets based on coded segments can reach its limits if you want to analyze thousands of tweets. It's hard to keep an overview of the whole picture, simple automatic coding reaches its limits and manual codings are practically impossible. Analysis functions are needed that enable you to keep track of larger amounts of data and to make targeted comparisons between authors, etc.
For this purpose, MAXQDA offers a special analysis view for imported twitter data, with which you can evaluate tweets according to numerous criteria, such as: frequent words, hashtags, authors, countries and/or sentiments.
A prerequisite: Your project includes Twitter data
A prerequisite for using the Twitter analysis functions in MAXQDA is that you have already imported Twitter data into your MAXQDA project. You can recognize imported Twitter data in the "Document System" by their Twitter symbol. Twitter data imported with MAXQDA version 12 cannot be used for the analysis described below.

Follow these steps to begin a Twitter analysis:
- Select the function Analysis > Twitter > Analyze Tweets
- In the dialog window that appears select all Twitter documents that you would like to include in your analysis.
- Click on OK and the following analysis will appear:
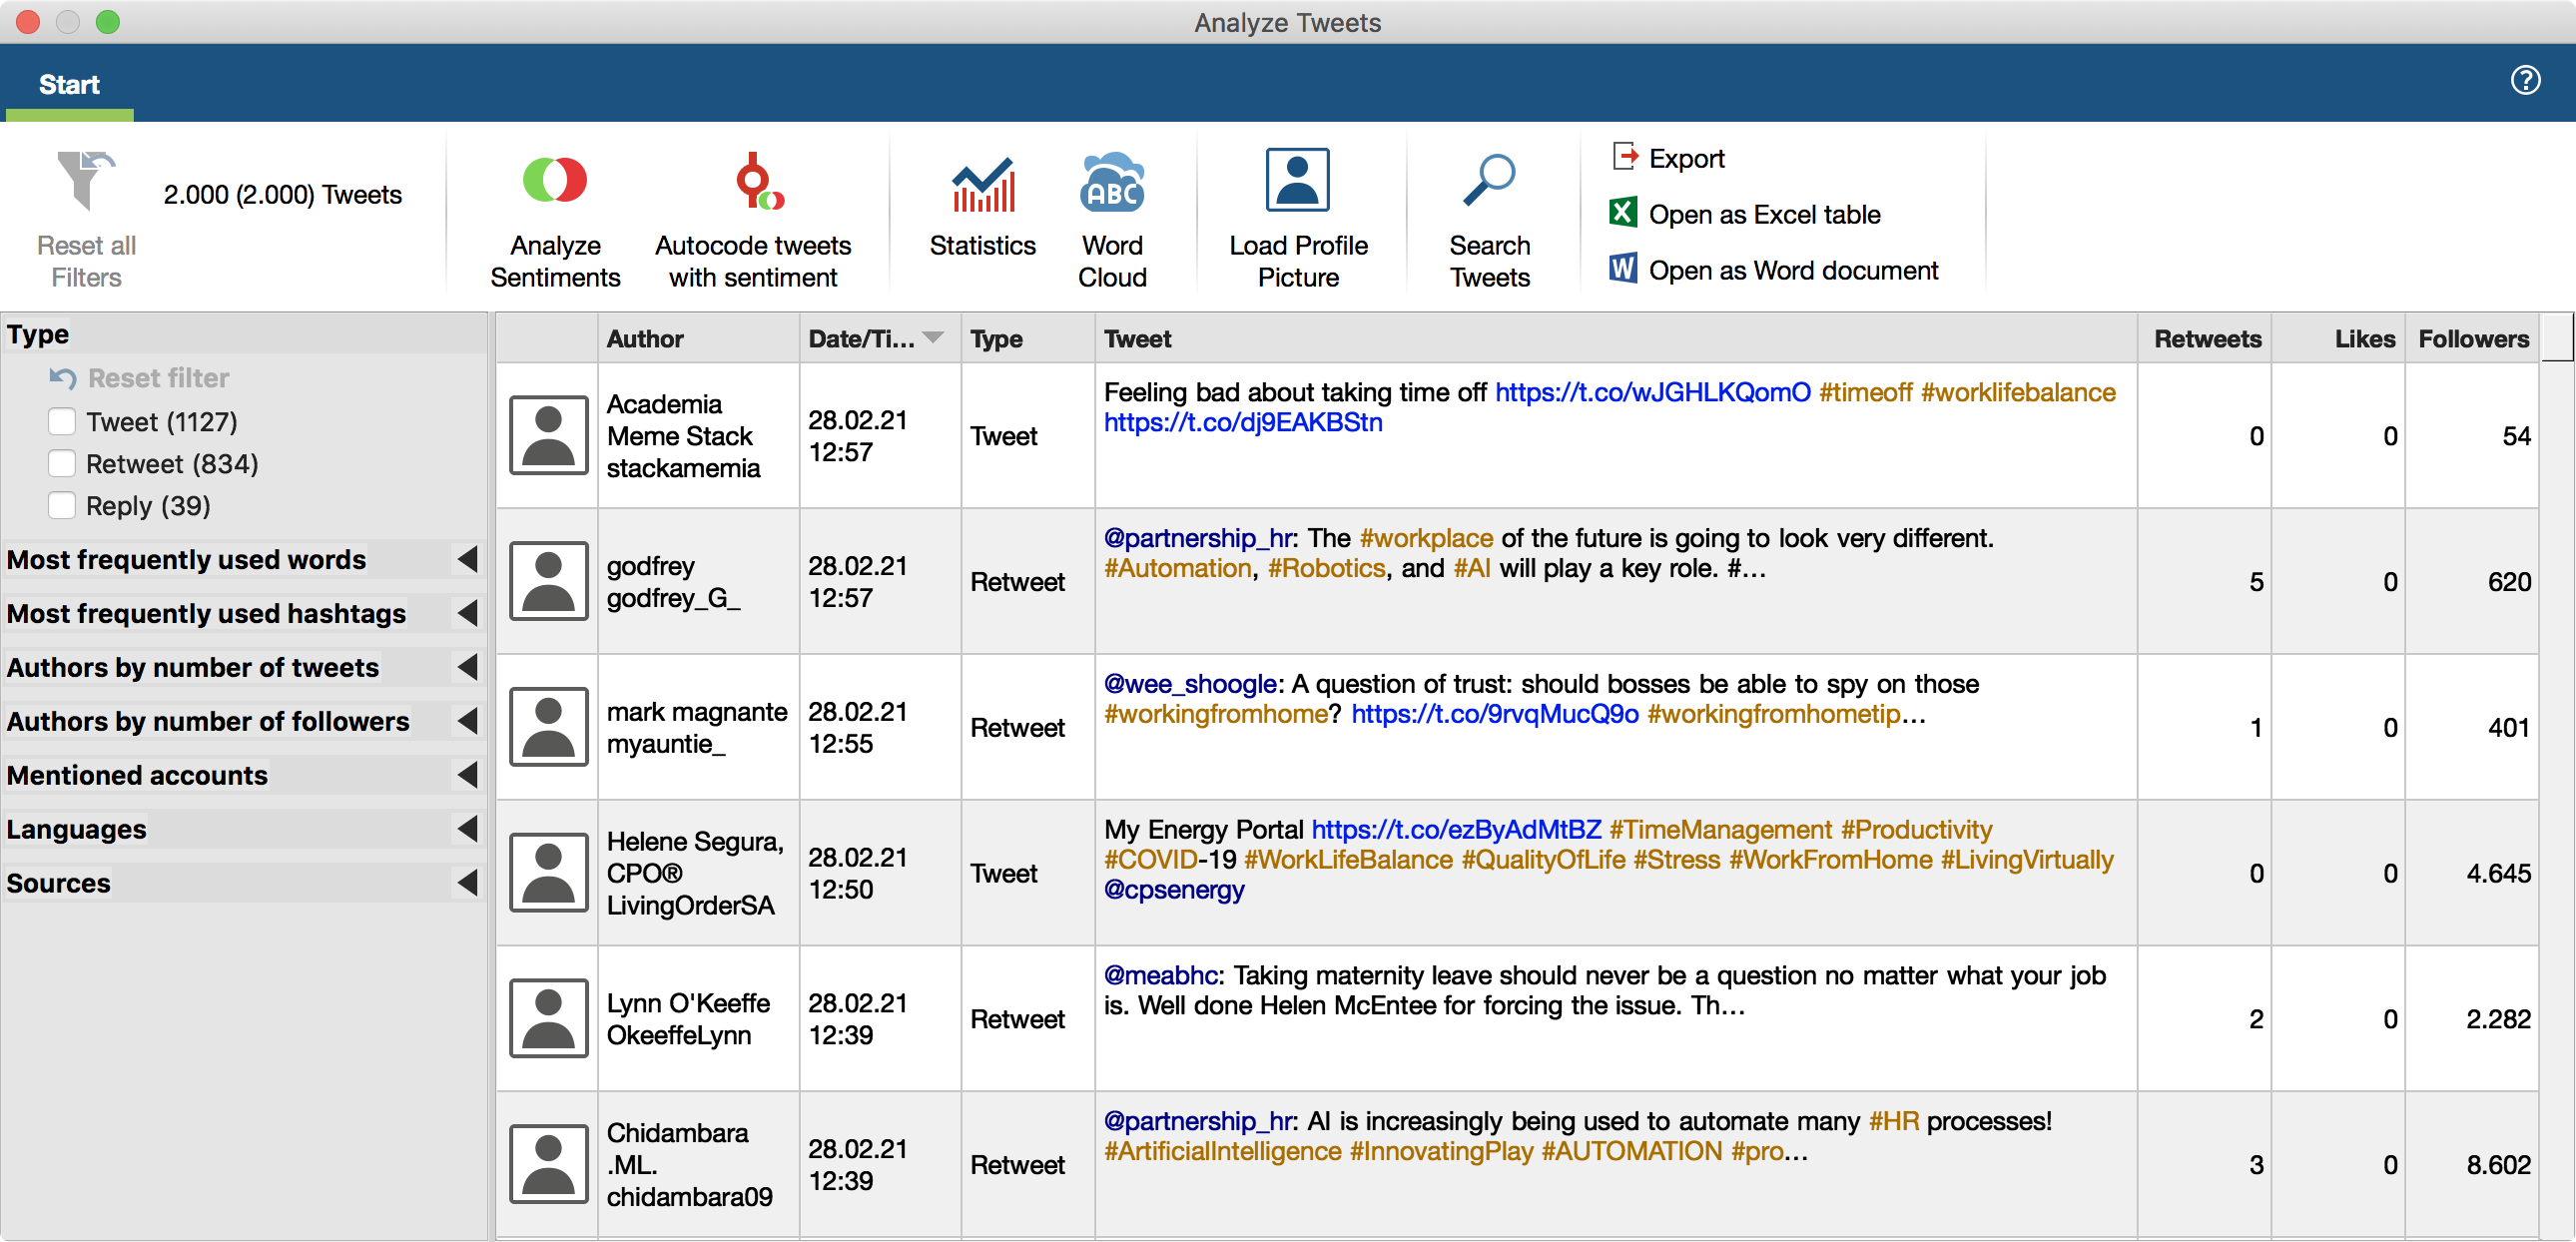
When opening the window, all analyzed tweets are listed in descending order by release date in a table. The table is structured as follows:
The first column contains the profile picture, the second the Twitter name and real name of the author. When you first open the window, no profile pictures will be displayed - you can display them via clicking on the Profile pictures icon. The pictures are loaded and gradually displayed. If an image has already been loaded for an author, it will be used; the image loaded will not be updated if it has changed in the meantime. Some authors have not posted an image on Twitter.
Type – indicates whether it is a tweet, a retweet, or a reply.
Tweet – contains the text of the tweet. Hashtags and mentioned Twitter accounts are highlighted in color. Click a link to view the linked website in your computer's internet browser.
Retweets - how often the Tweet has been retweeted. This number is an indicator of the tweet’s popularity.
Likes – the number of likes a Tweet received. This number is an indicator of the tweet's popularity as well.
Followers – how many followers the author had at the time they published the tweet. This number is an indicator of the author’s popularity.
Filter tweets
Using the filter panel on the left, you can filter the tweets according to several criteria. You can also expand and collapse the filter area by clicking on the filter header.
The number in brackets behind the filter always refers to the total number of all analyzed tweets on the basis of that filter. This means that it will remain constant, even if you turn on several filters. The current number of listed tweets is displayed at the top of the menu tab. 150 (2,000) means, that 150 of 2,000 tweets in total are displayed.
These filter areas are always available:
Types – always contains the three filter options "Tweet", "Retweet" and "Reply".
Sentiment allows filtering by the sentiment (negative, neutral, positive) expressed in a tweet. This section will appear automatically once you have determined the sentiment of each tweet by clicking Sentiment Analysis in the menu tab.
Most frequently used words – Lists the most common words in descending order. Internet links and mentioned accounts will be ignored. All the words currently contained in the stop list for the word cloud will also be filtered out.
Most frequently used hashtags – lists the most common hashtags in descending order.
Authors by number of tweets – lists the most active authors in descending order. Only the analyzed tweets are considered.
Authors by number of followers – lists the authors with the largest reach in descending order. Their number of followers is used as an indicator of reach.
Mentioned accounts – lists the most frequently mentioned accounts in descending order.
Languages – lists the most frequently used languages in descending order. (The language is identified by Twitter automatically).
Sources – lists the most frequently used devices and programs from which the tweets were sent in descending order.
Create word clouds and word frequency lists
You can create word clouds with the most frequently used words in the currently displayed tweets as well as a list of all the words contained in them:
- If needed, filter tweets according to selected criteria.
- Click on the word cloud icon to create a word cloud like the following:
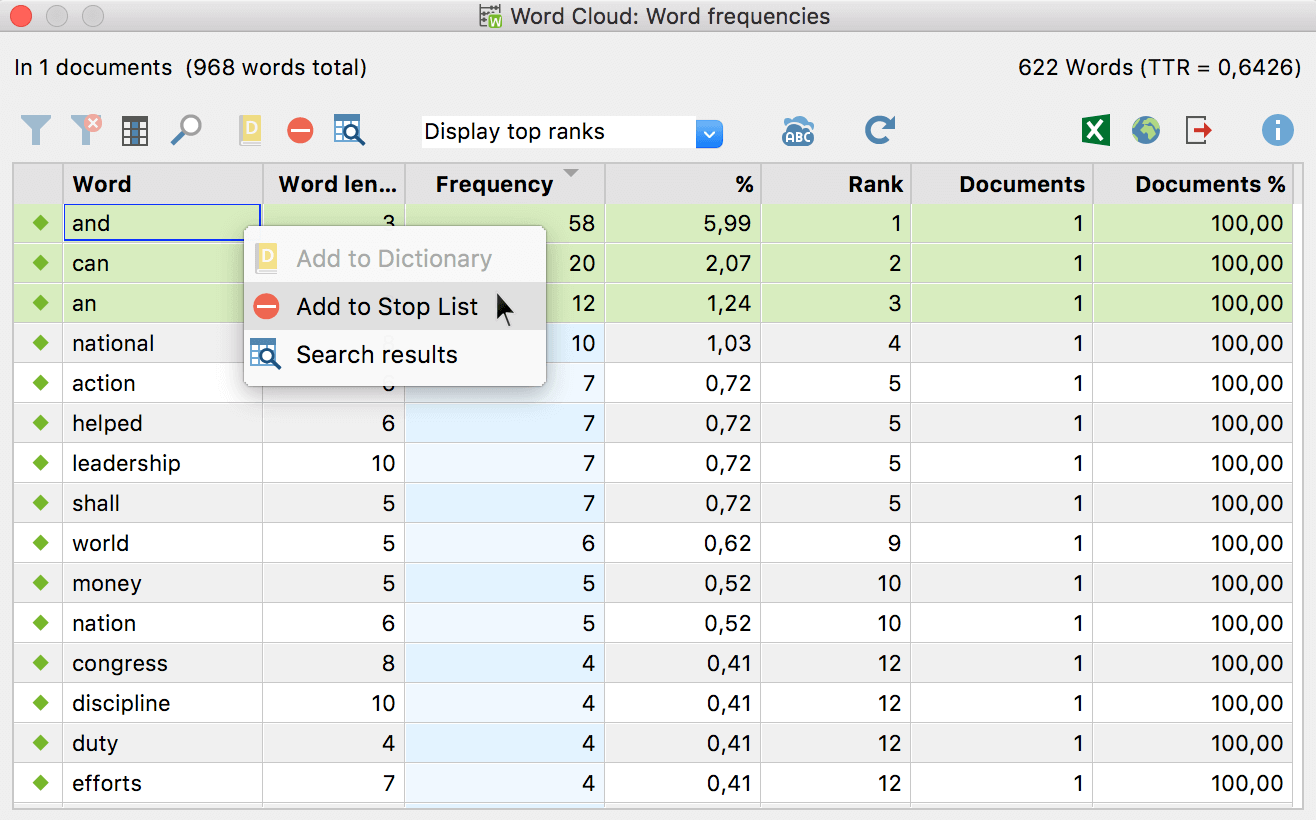
- To make your word cloud display only the most relevant words, you can transfer less important words into a stop list to exclude them. The easiest way to do this is to click on the Word frequencies icon it the menu tab Home to display the list of all the words that appear.
- The word frequency list is sorted in descending order. To transfer a word to the stop list, double-click the green icon in the first column. The green icon then changes to a stop symbol. Alternatively, select one or more lines with the mouse, and then click the Add to stop list symbol in the toolbar.
- Click the circular arrow in the toolbar to Refresh and apply stop list. The word cloud and word frequency list will then be regenerated, taking into account your new stop list.
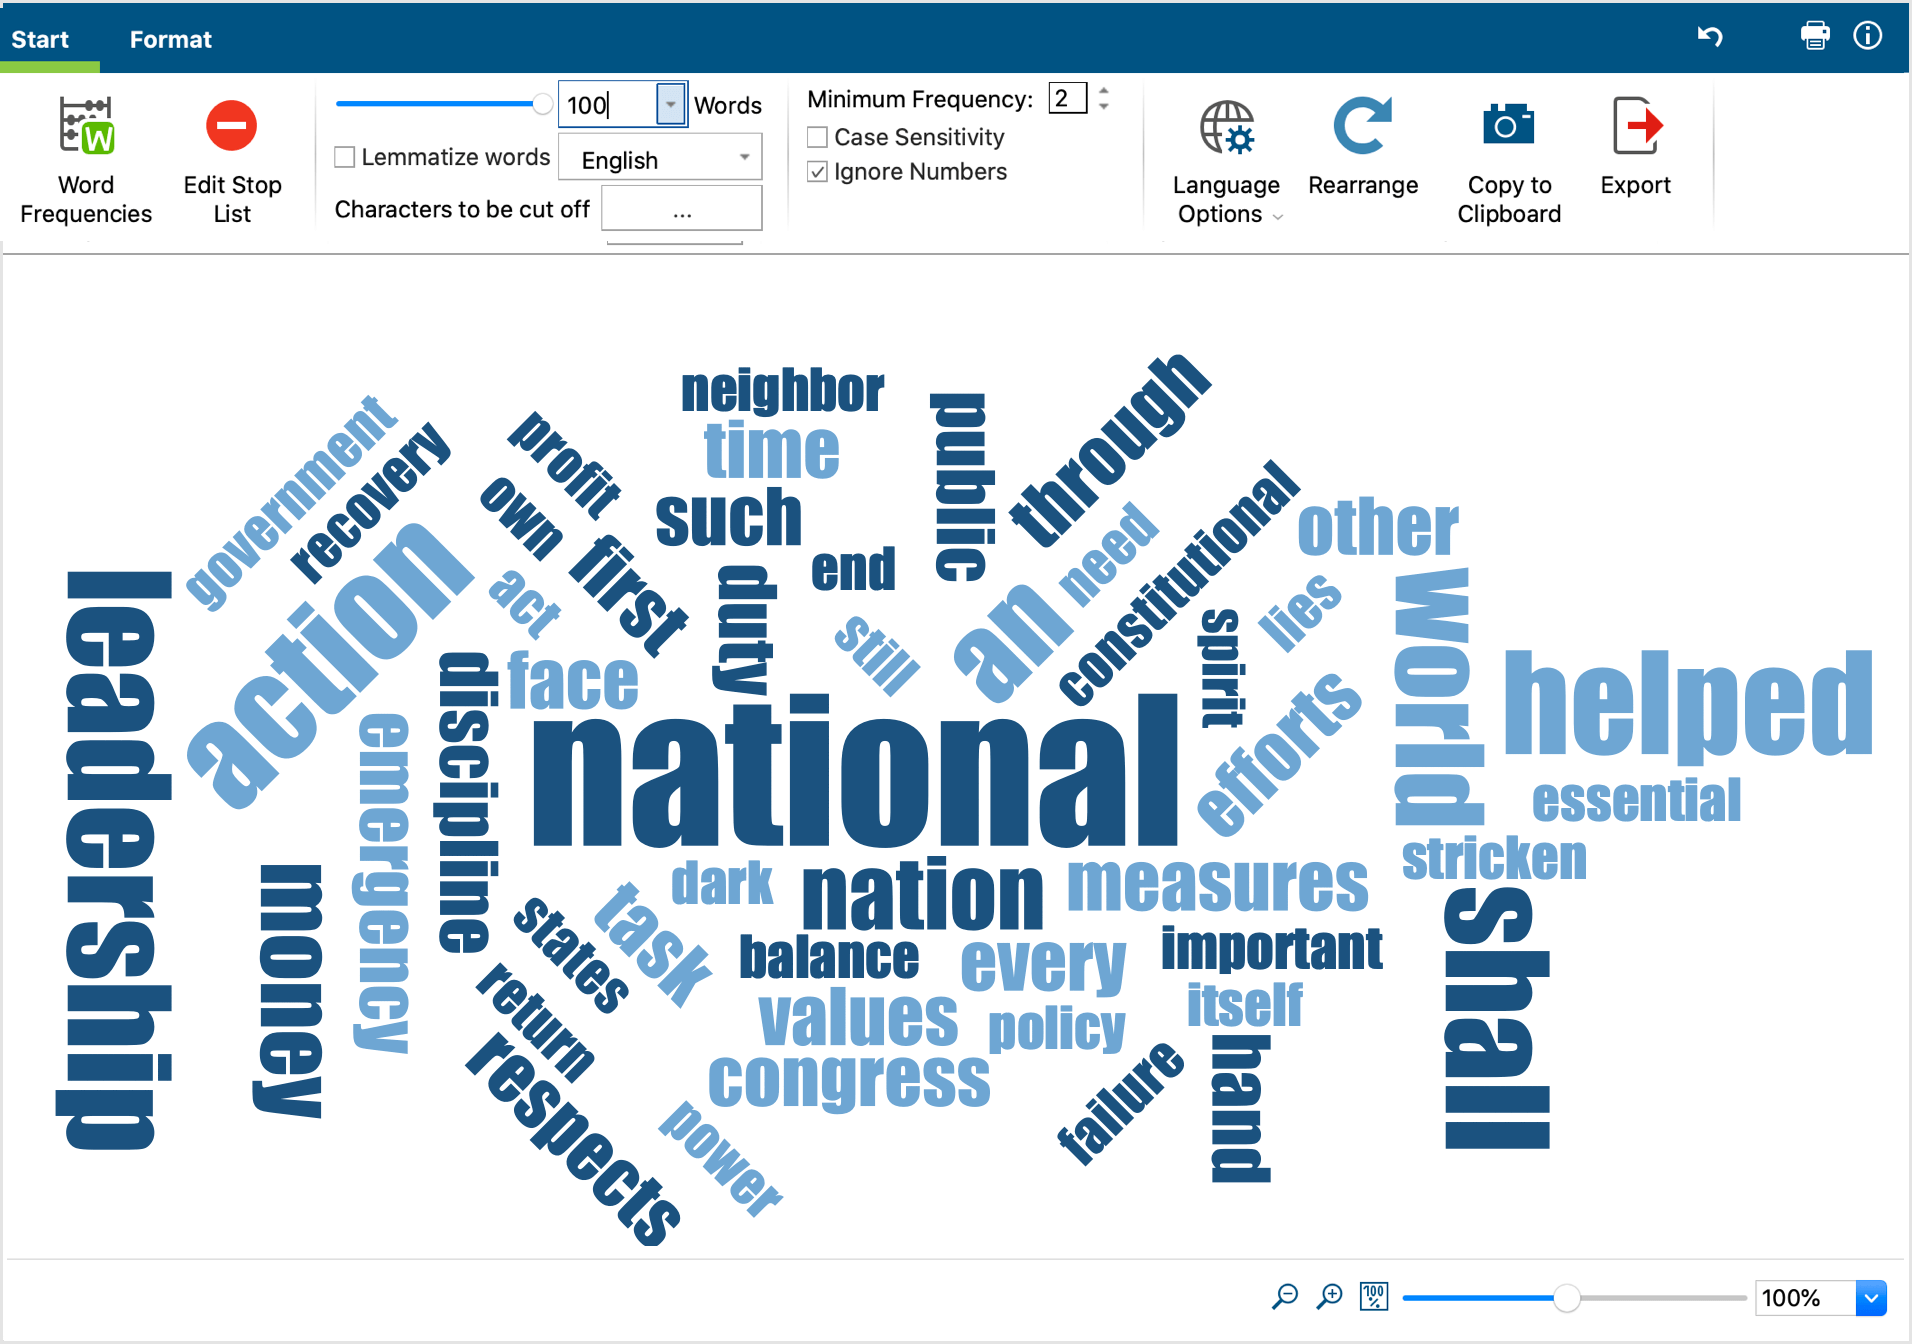
The filters for the tweets allow you to create and compare word clouds between different groups of authors.
Frequency analyses and charts
You can also create frequency tables and charts from the tweets under specific filters. Information on the reach of tweets (their followers) as well as their publication times and weekdays are added:
- Filter your tweets according to specified criteria.
- Click Statistics in the manu tab to request a frequency analysis.
- You can use the arrows at the top of the window to toggle between individual frequency tables.
- Click on the chart symbol in the upper left corner to display the table as a horizontal or vertical bar chart or pie chart. For more information refer to the Frequency tables and charts for subcodes
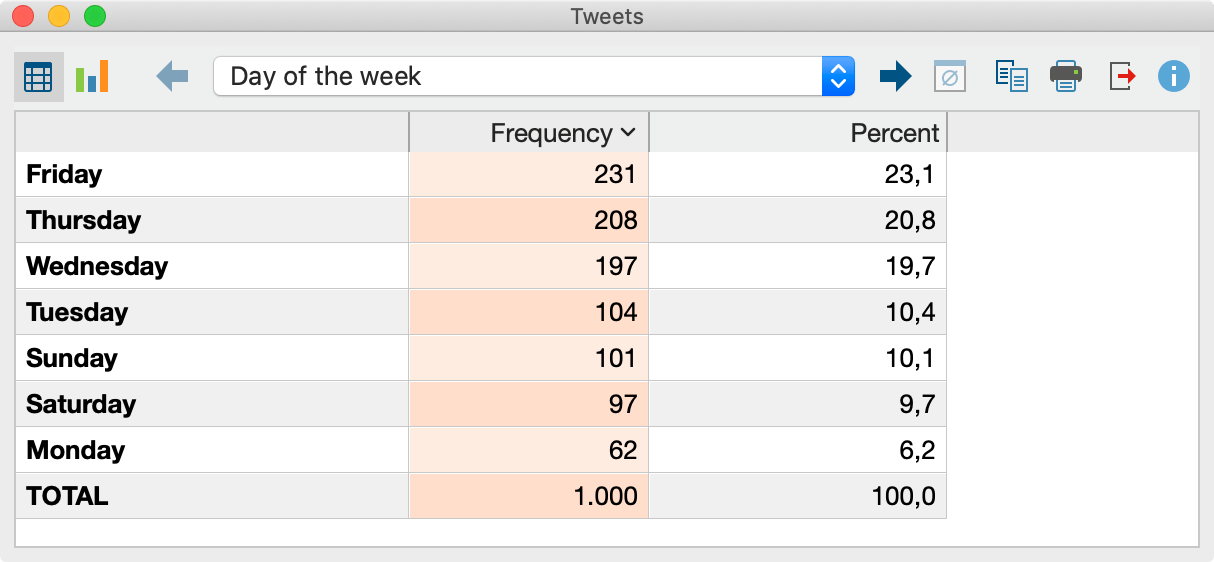
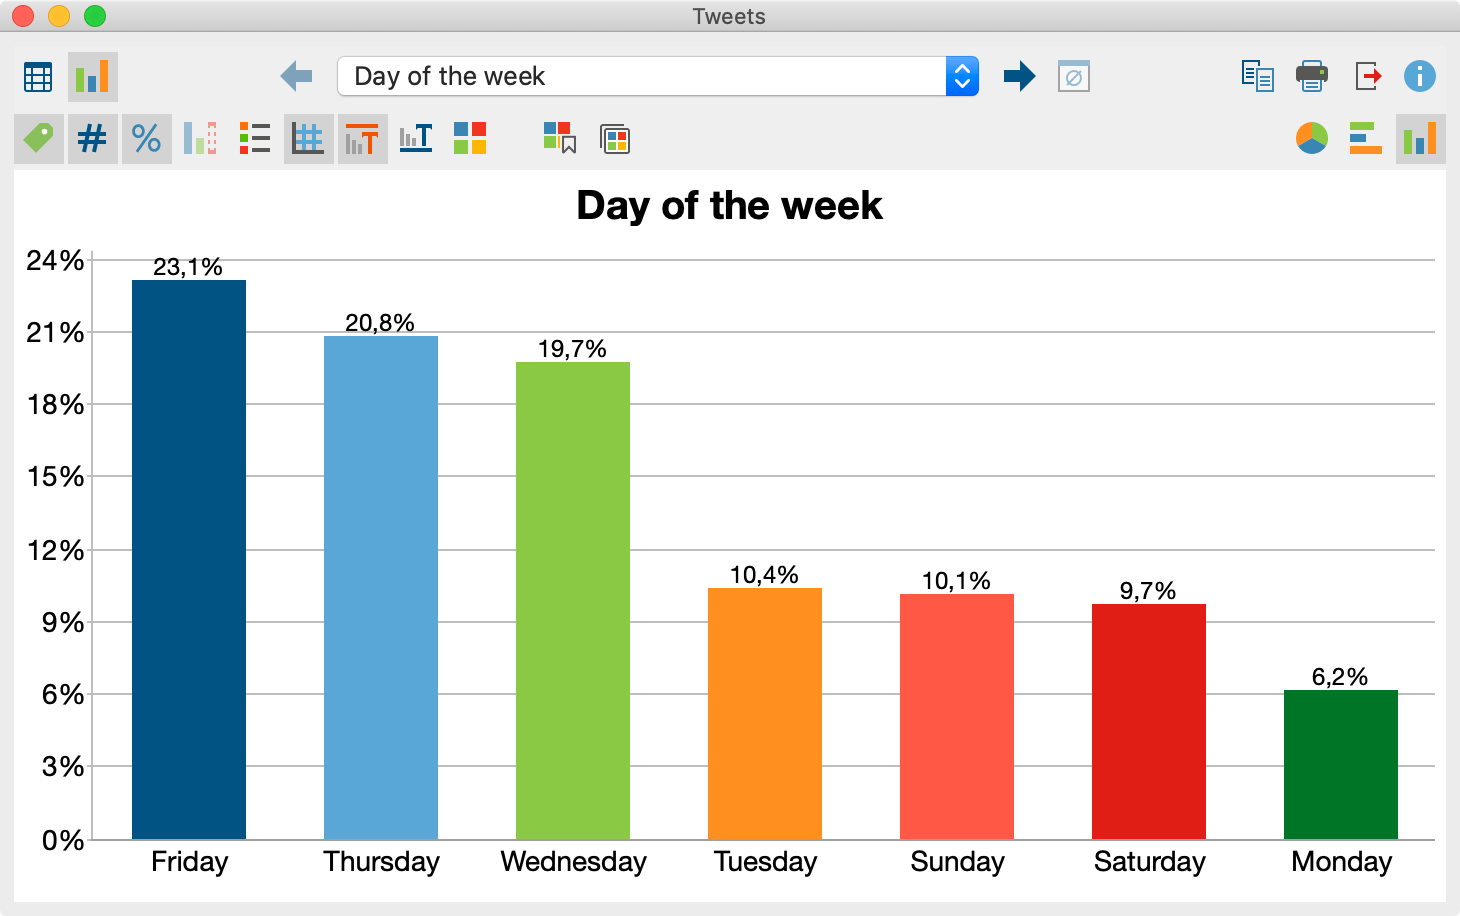
MAXQDA generates the following charts with associated frequency tables in the twitter analysis:
| Chart | Bars represent | Categories |
|---|---|---|
| Weekday | Number of tweets | Days |
| Time | Number of tweets | Hours |
| Type | Number of tweets | Tweet, retweet, reply |
| Most frequent words | Number of tweets | 15 most frequently used words (options for making this analysis case-sensitive and/or taking word cloud stop-lists into account). The category "Other" can also be displayed. |
| Most frequent hashtags | Number of tweets | 15 most used hash tags. The category "Other" can also be displayed. |
| Author by number of tweets (real name) / Author by number of tweets (Twitter name) | Number of tweets | 15 authors with the highest amount of tweets. The category "Other" can also be displayed. |
| Authors followers | Number of followers | 15 authors with the most followers. The category "Other" can also be displayed. |
| Source | Number of tweets | 15 most common sources. The category "Other" can also be displayed. |
| Retweets | Number of retweets | Specified categories from 0 to a 100+ |
| Likes | Number of likes | Specified categories from 0 to a 1,000+ |
| Followers | Number of followers | Specified categories from 0 to a 1,000,000+ |
| Sentiment (only available after using the function Sentiment Analysis) | Number of sentiment assessments | Specified categories from "negative" via "neutral" to "positive" |
Export tweets
The current listed tweets can be exported using the usual icons in the Home tab. The sorting of the table will be adopted.
![]() Export – Creates a table as an Excel file (XLS/X format), a Word file (DOCX format), a web page (HTML format) or in other (less common) formats.
Export – Creates a table as an Excel file (XLS/X format), a Word file (DOCX format), a web page (HTML format) or in other (less common) formats.
![]() Open as Excel table – Creates an Excel spreadsheet and opens it.
Open as Excel table – Creates an Excel spreadsheet and opens it.
![]() Open as Word document – Creates a Word document and opens it.
Open as Word document – Creates a Word document and opens it.
