This function offers yet another way to combine quantitative data and your codes or categorical variables. It is called a Typology Table, because it is able to calculate various variables and their percentages (means, standard deviations, etc.) for qualitative typologies.
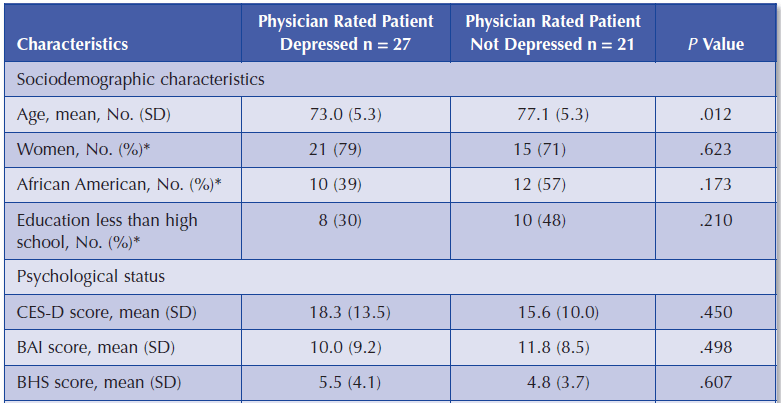
The table is set up similarly to the following example from Creswell and Plano’s book “Designing and Conducting Mixed Methods Research” (2011: 292):

This table shows a comparison between two types of patients, “Depressed” patients (27 persons) and “Not Depressed” patients (21 persons). The last column p-Value shows the statistic significance of the mathematical means. The first row "Age" shows the average age of both groups and the standard deviation in brackets.
The row “Women” contains the number of women and their percentage. This means that of the 27 depressed persons 21 are women, which is exactly 79% .
As we can see, the rows consist of variables, metric variables to be exact, and specific values of categorical variables – either text or numerical variables. The columns follow the pattern of Crosstabs, meaning the values of any categorical variables can be selected.

To create a Typology Table, proceed as follows:
- Select Typology table from the Mixed Methods menu tab.
- For categorical variables, all respective variable values are listed in the dialog window. For non-categorical (metric) variables, the variables themselves are listed. For easy differentiation, non-categorical variables appear in red. Check the variable values and variables you would like to include in the Typology table and to compare between groups.
- Select the Exclude missing values option when the missing values of non-categorical variables should be ignored. This will usually be the case.
- When you click Continue a second dialog window will appear in which you can define the columns of the Typology table, and where you can specify the elements that should be compared with one another.
- Create a variable condition (formula) for each desired column, for example “Depressive = Yes” and “Depressive = No”. The quickest way to do so is by double-clicking the variable in the variable column. When you click OK, MAXQDA will display the Typology table.
The Typology Table toolbar
At the top of the Typology Table you will find a toolbar that – besides the usual export options – offers the following fucntions:
![]() Highlight lowest value per row – for better interpretation of the results the value highest in row is highlighted in red.
Highlight lowest value per row – for better interpretation of the results the value highest in row is highlighted in red.
![]() Highlight highest value per row – for better interpretation of the results the value lowest in row is highlighted in green.
Highlight highest value per row – for better interpretation of the results the value lowest in row is highlighted in green.
![]() Refresh – updates display via recalling the function.
Refresh – updates display via recalling the function.
Interactive connection to source data
The typology table is linked to the data in your MAXQDA project interactively:
- Double click on a cell, that shows the number of documents (and no mean value), to activate these documents in the "Document System".
- Double click on a cell of of the first column, where the cell shows a variable value, to activate all documents that fit the clicked variable criteria.
