Definition: This joint display integrates a qualitative typology as one dimension with the quantitative data as another dimension.
This joint display is used to compare types that have been constructed from the qualitative data by statistical values such as mean, standard deviation, etc. The types are created based on the existence of codes in each document. The following table is a schematic representation of this kind of joint display:
| Coded with … | |||
| subcode A | subcode B | subcode C | |
| Variable 1 (numerical) | Mean (Standard deviation) | Mean (Standard deviation) | Mean (Standard deviation) |
| Variable 2 (categorical) | Total (%) | Total (%) | Total (%) |
| Documents | N (%) | N (%) | N (%) |
Each column holds all documents, in which the selected subcode occurs. It is therefore important that only one of the subcodes is assigned to each document. An example could be an evaluative qualitative text analysis where the code “self assurance” has the subcodes “low,” “medium,” and “high”. If one of the subcodes is assigned to each document, they can now be used to create this joint display.
This joint display is suitable for convergent (parallel), as well as explanatory and exploratory designs.
Creating a new display
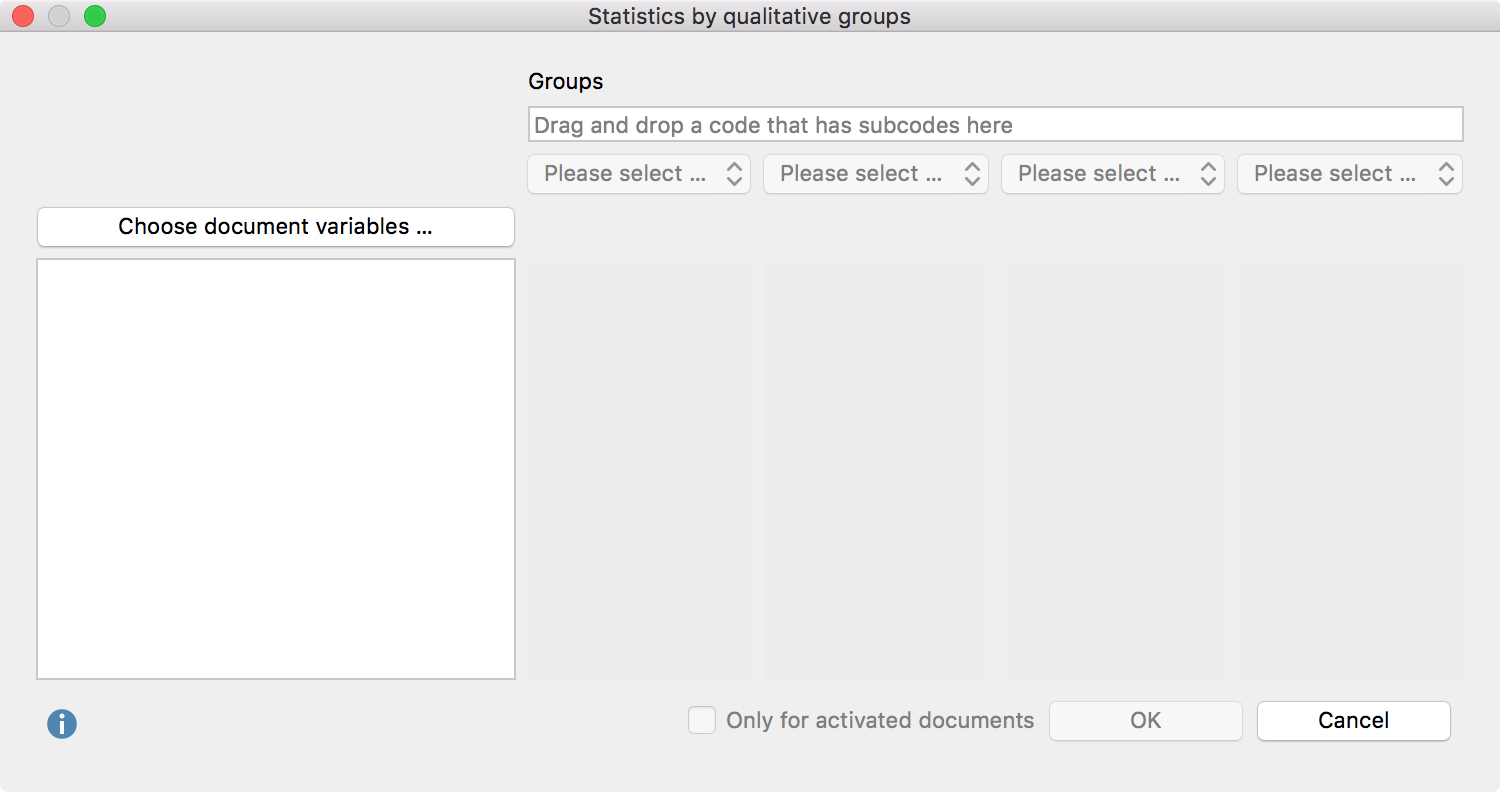
Navigate to the Mixed Methods menu tab and click the Statistics for QUAL Groups entry. MAXQDA will open the following window:

- Create groups by dragging a code that has subcodes (but no sub-subcodes) from the “Code System” window to the “Groups” field at the top of this window. Select up to 4 subcodes from the drop down menus below.
- You can limit the display to only include currently activated documents by checking the box next to Only for activated documents.
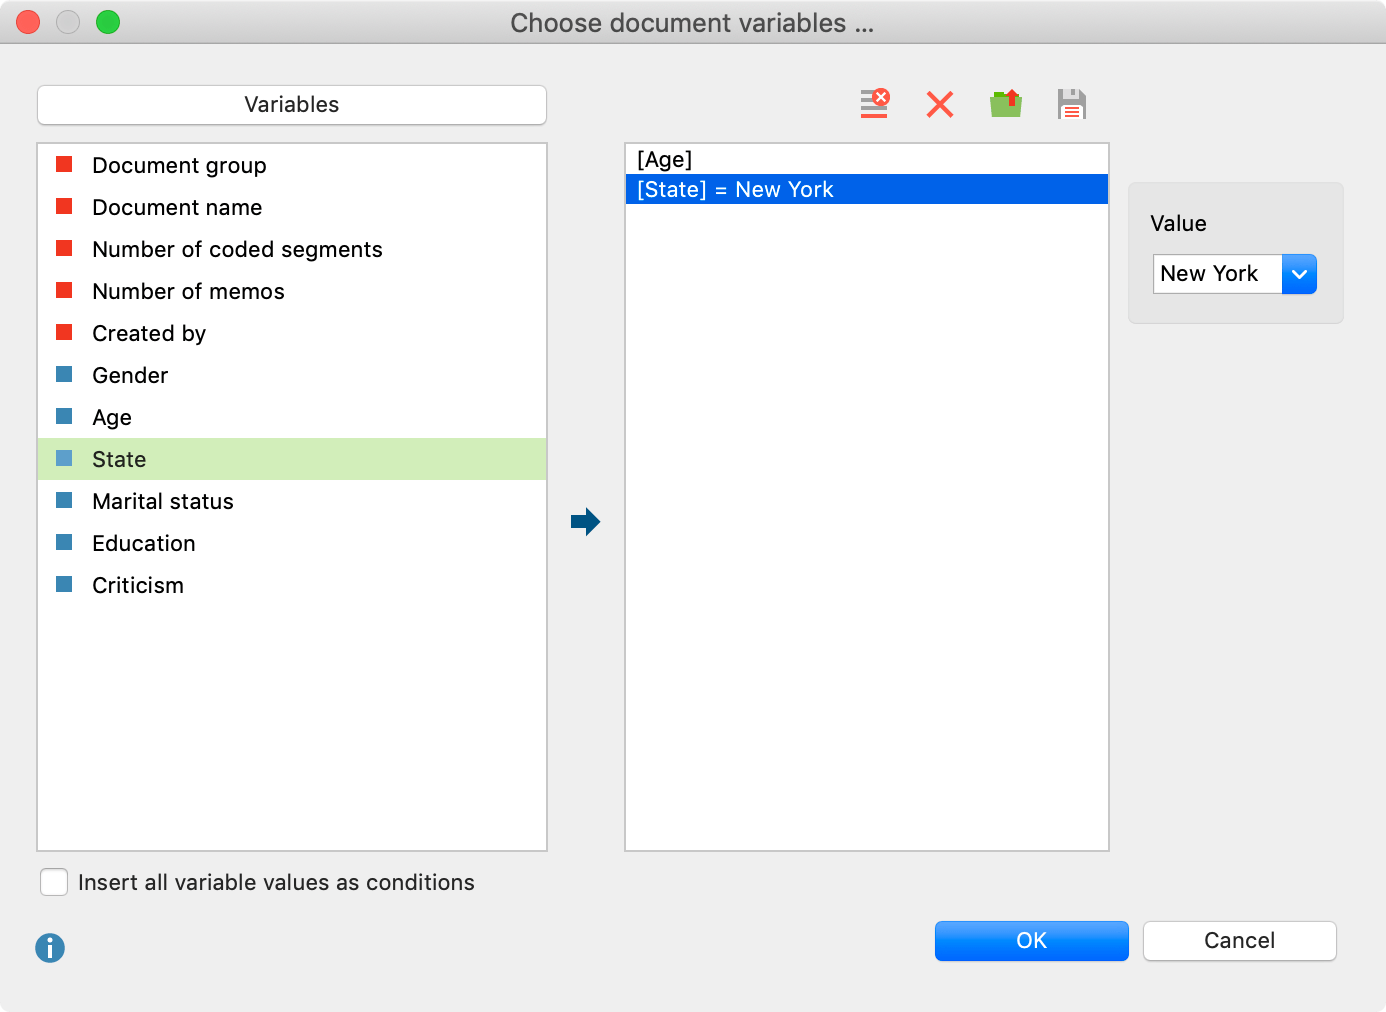
- Click the “Choose document variables…” button to call up the variable selection window. Select which variable values to include for categorical variables.

- Click OK to include your selection and click OK again to create the joint display.
The result of this display is equal to that of a typology table.
