This MAXQDA Upgrade is free for all MAXQDA 24 Users and requires a full download and installation. Unlike previous updates, this cannot be done directly within the software.
Download nowAs fall settles in and research agendas shift into high gear, there’s something new worth celebrating: MAXQDA is simpler than ever. No more version numbers. No more upgrade cycles. Just MAXQDA—continuously improved and always up to date for subscribers.
This release brings another two major updates designed to facilitate your research workflow: a brand-new Survey Analysis workspace that reimagines how you work with survey data, and a powerful new Mixed Methods QTT Worksheet inspired by Prof. John W. Creswell’s influential framework.
Continue reading to discover more about these new features, as well as other enhancements and improvements:
Survey Analysis Workspace
Your surveys, reimagined as unified stories
We’re excited to introduce our new Survey Analysis workspace, designed to enhance your data journey. This powerful feature makes it easier to explore your survey results and unlock their full potential.
If you’ve ever felt like your survey data was scattered across too many places—documents here, codes there, variables somewhere else—this one’s for you. The new Survey Analysis workspace reimagines how MAXQDA handles surveys, replacing the previous “Categorize Survey Data” feature with a unified approach that treats each survey as a single entity, giving you a clearer overview and helping ensure that no questions or responses slip through the cracks.
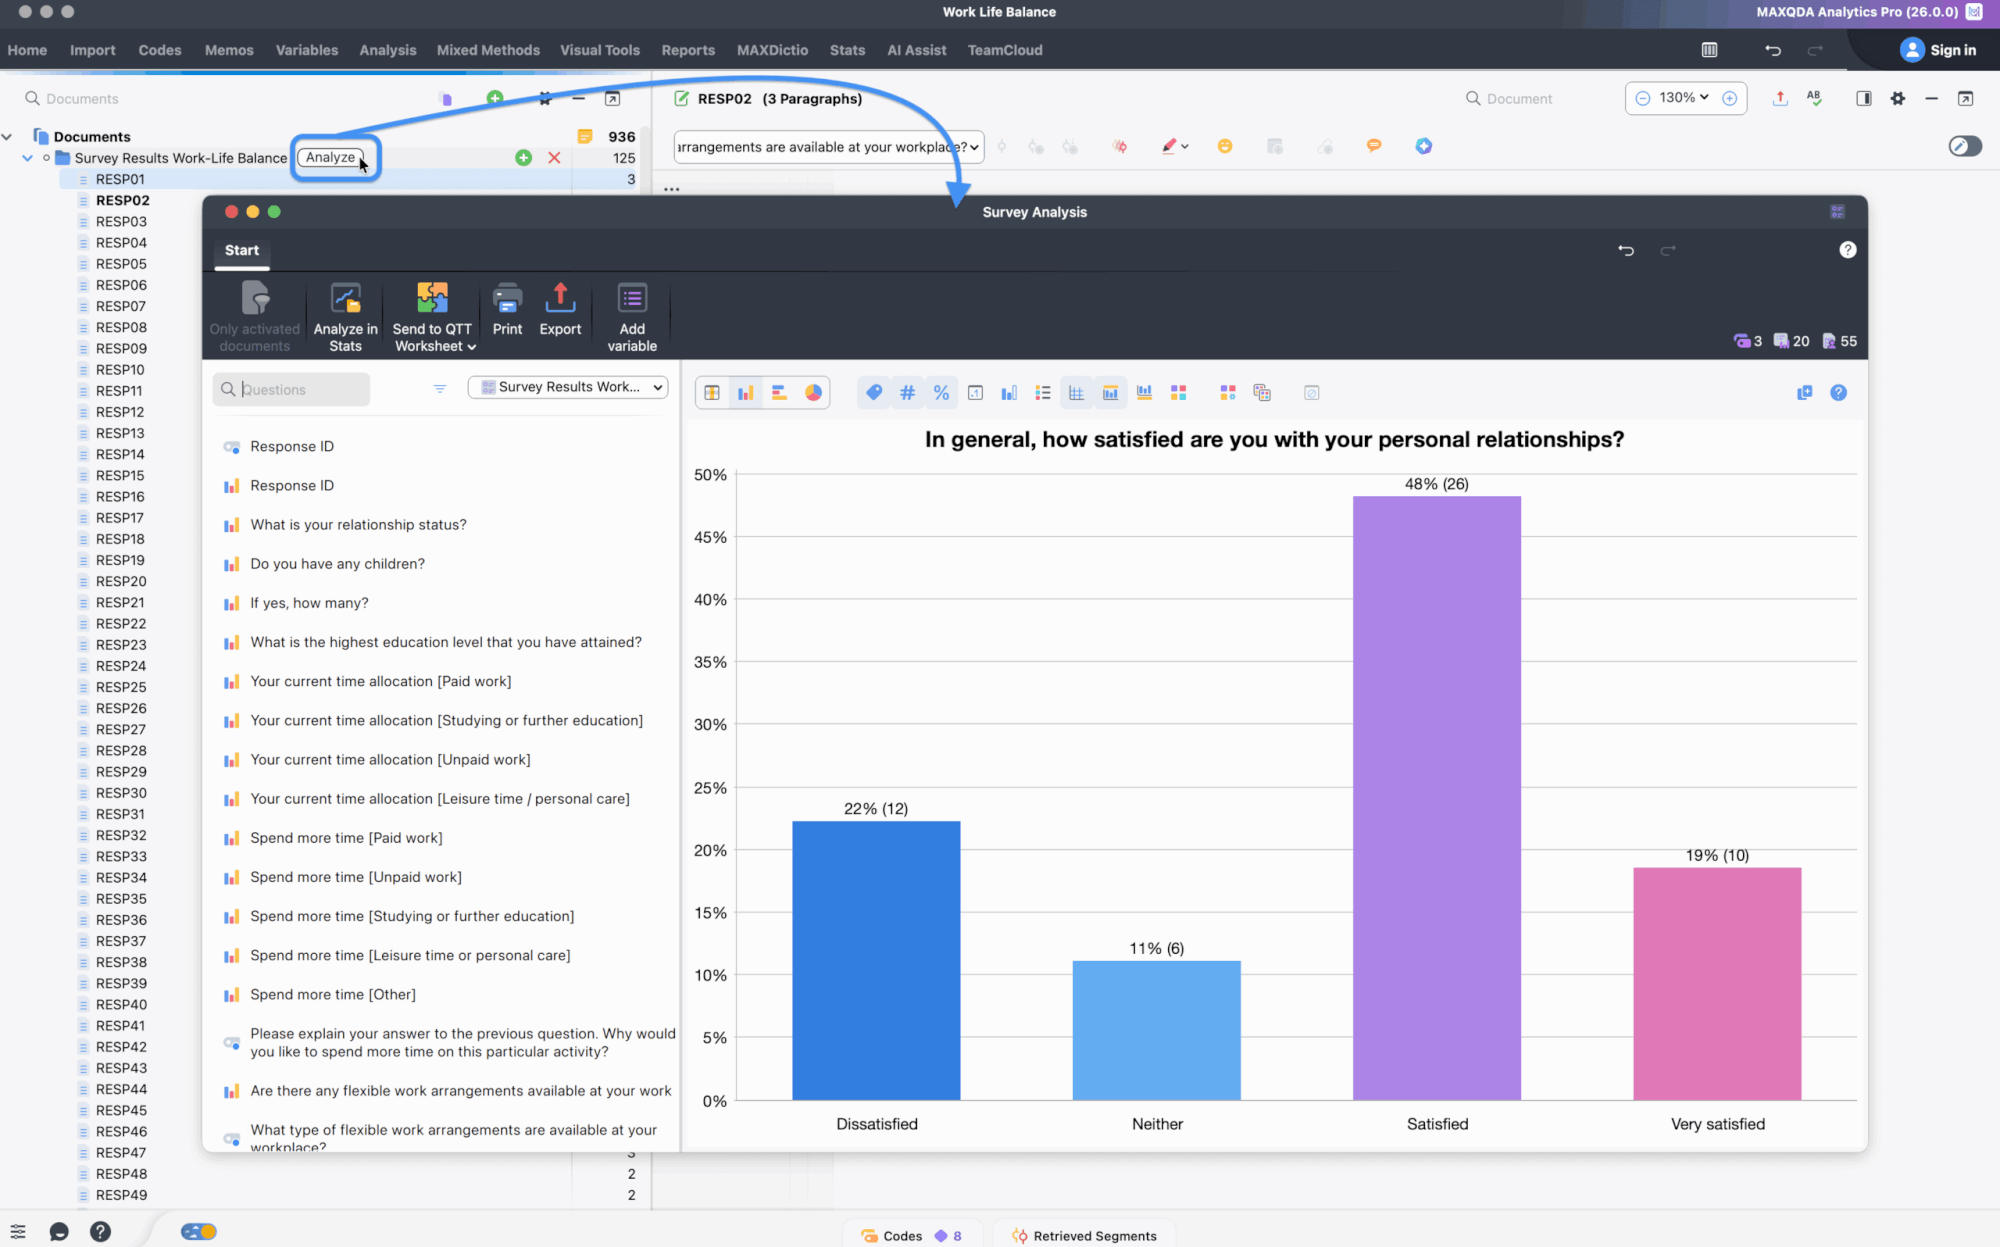
At the heart of this workspace is the new Questions Browser, which displays all your survey questions (both open- and closed-ended) in one convenient panel. Here’s what makes it powerful:
- Smarter organization under the hood: MAXQDA now automatically recognizes which documents, codes, and variables belong to each survey, so you can now easily manage multiple surveys within a single project file.
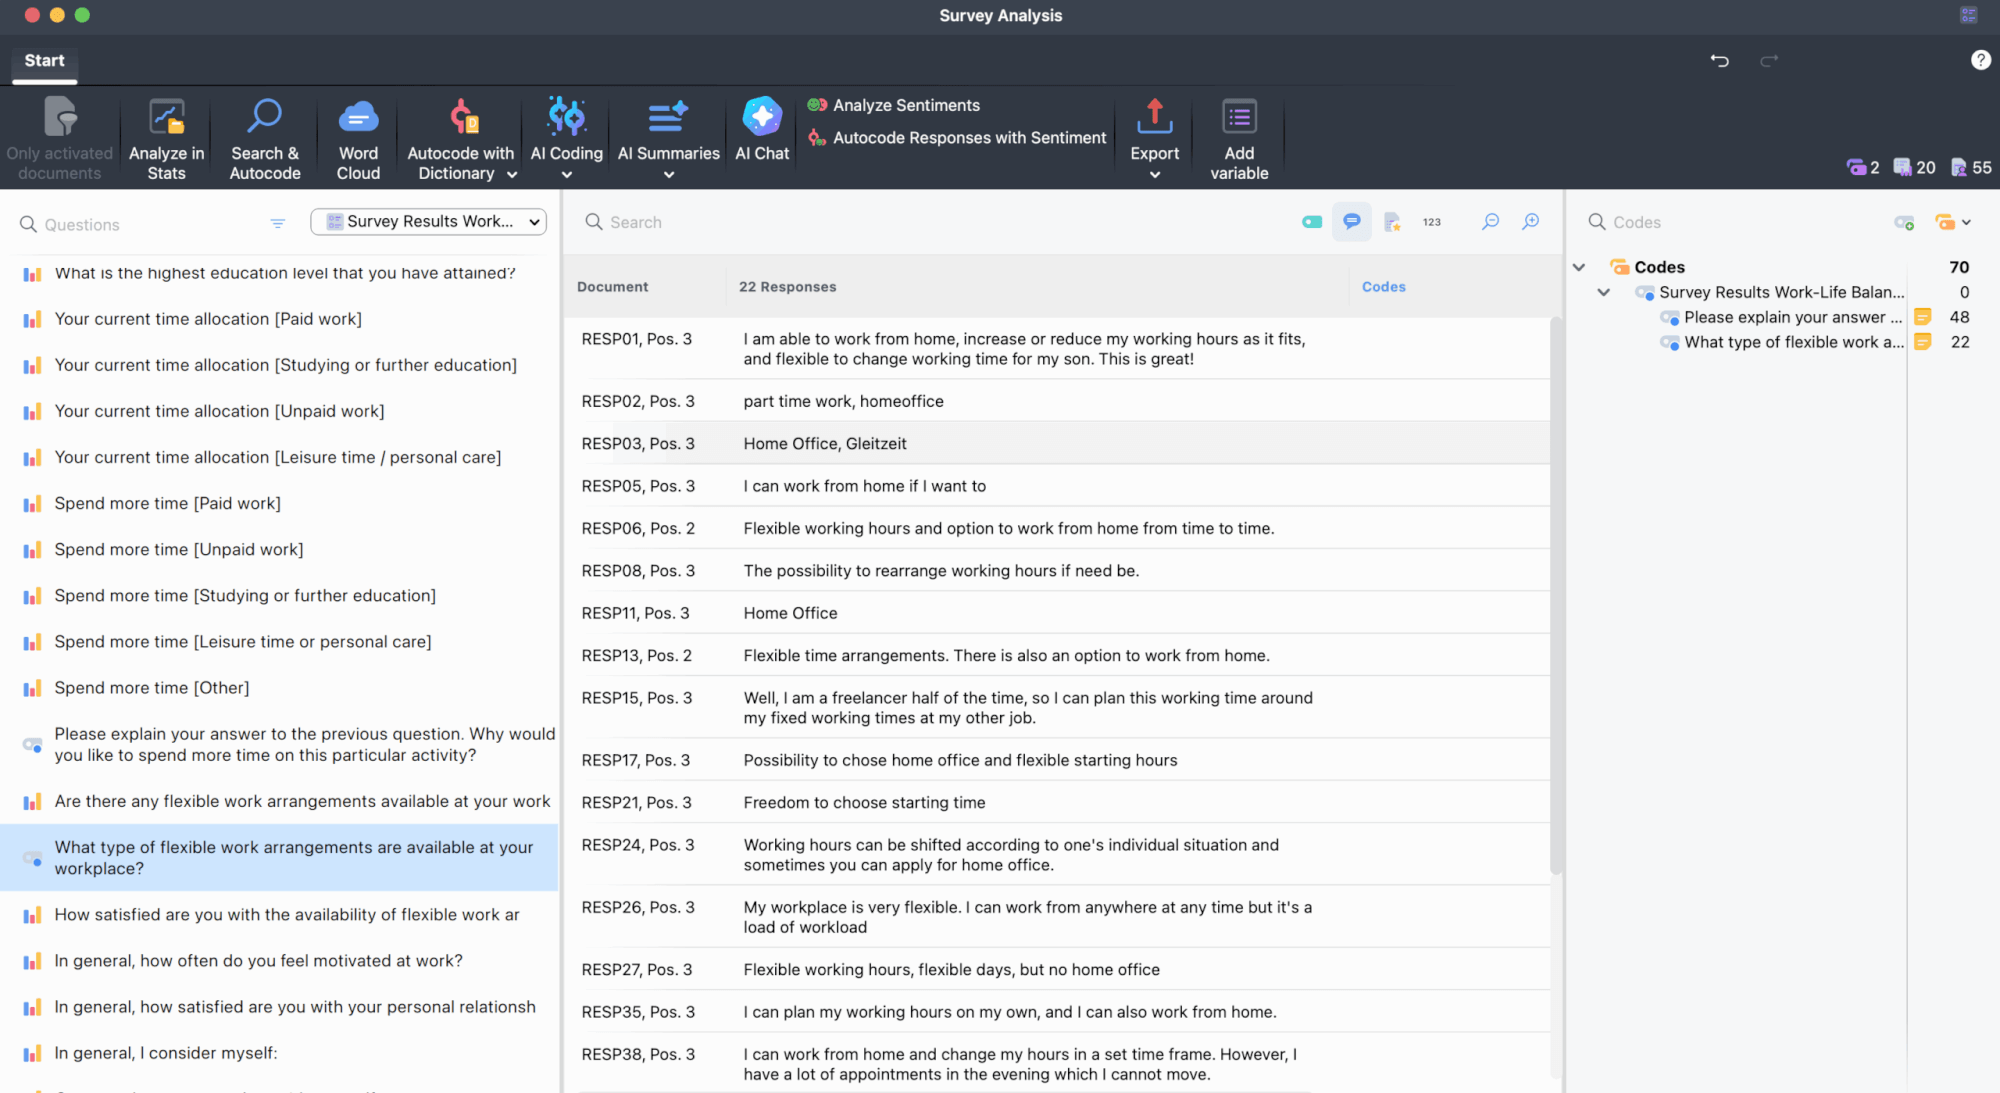
- Navigate all your questions effortlessly: The new Question Browser displays all open- and closed-ended questions in one panel, letting you switch between them instantly—no need to close and reopen the workspace for each question.
- Robust analysis tools readily available: Dive into sentiment analysis, conduct text searches, create engaging word clouds, explore AI functionalities, and utilize autocoding—all thoughtfully organized in an easy-to-navigate menu tailored for your survey workflows.
- Swift access to quantitative insights: Click on any closed-ended question to quickly pull up frequency tables and interactive charts, then effortlessly toggle back to qualitative responses, all within the same workspace.
🧠 Why it matters: This workspace transforms survey analysis from a fragmented process into a seamless experience. Whether you’re working with one survey or juggling multiple ones, you’ll spend less time hunting for data and more time analyzing it.
📍 Where to find it: Access the Survey Analysis workspace from the “Analysis” menu (where “Categorize Survey Data” used to be), by opening the survey directly from the document system, or by continuing with analysis directly after importing your survey data.
QTT Worksheet for Mixed Methods Research
Structure meets synthesis in one powerful workspace
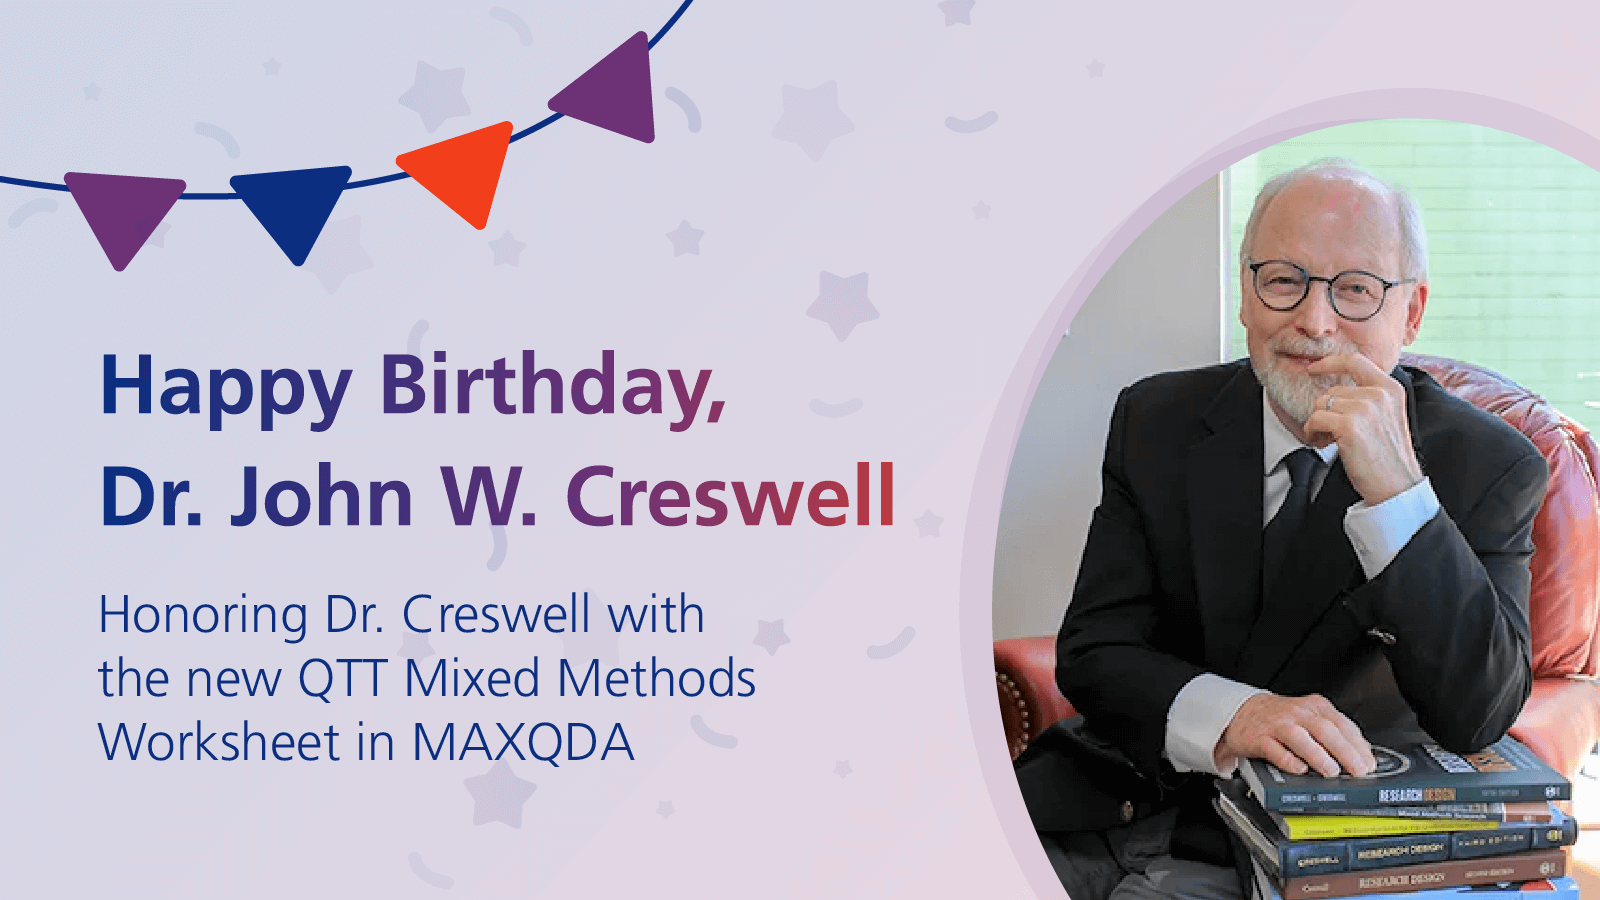
MAXQDA’s QTT (Questions – Themes – Theories) tool has been a favorite for synthesizing findings and analytical observations from various MAXQDA tools into a single location. Now, we’re expanding its capabilities with the new Mixed Methods QTT Worksheet, inspired by the influential framework developed by Prof. John W. Creswell.
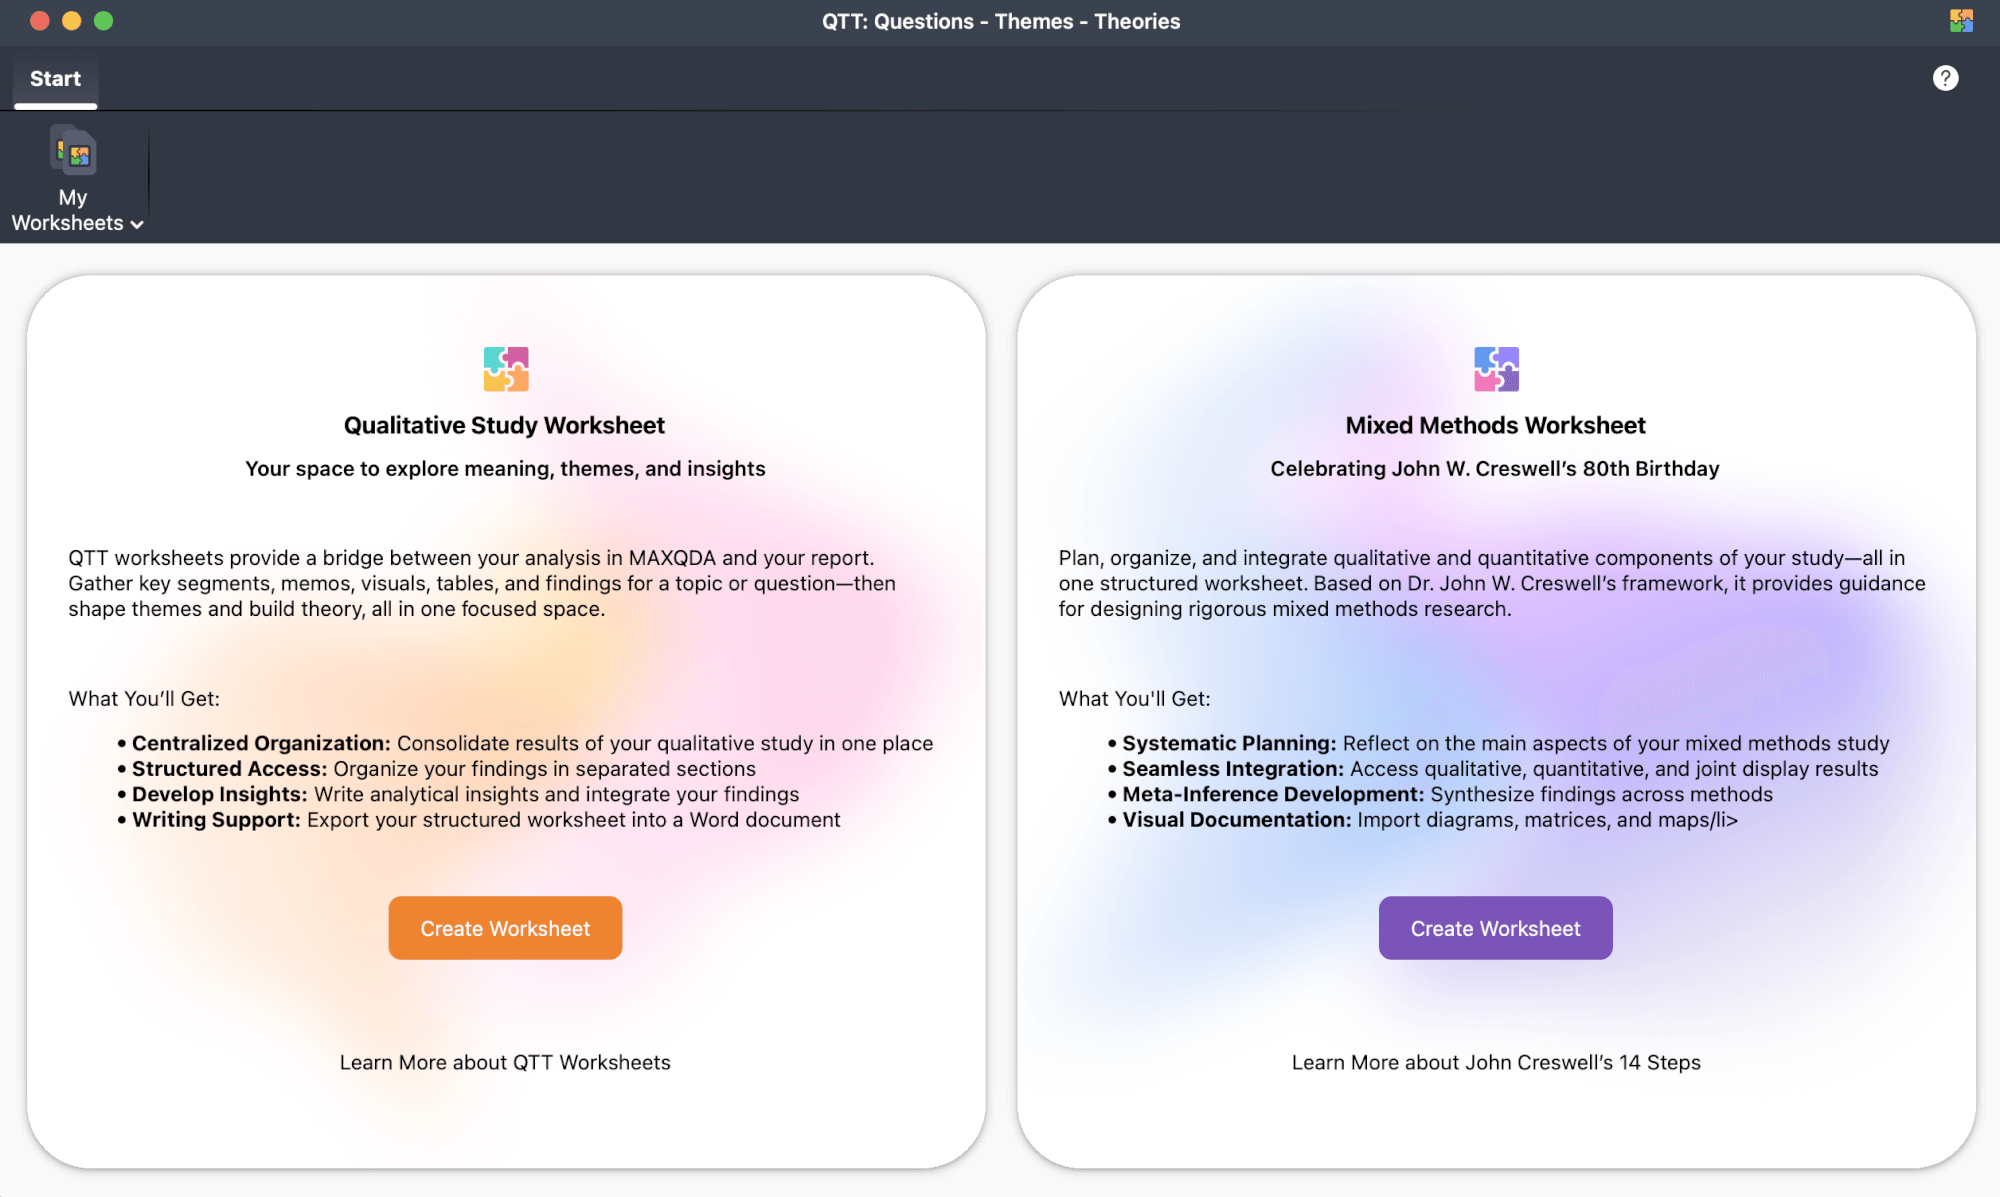
This new worksheet serves as your companion for research design, helping you systematically plan, organize, and integrate the qualitative, quantitative, and joint display components of your study. Built on Creswell’s 14-step framework, it helps ensure your research remains rigorous, transparent, and easy to communicate.
Beyond making the integration of diverse data sources clear and structured, the worksheet provides dedicated space to record findings and observations for each element and for your central research question, turning abstract integration into concrete documention steps.
Key benefits at a glance:
- Systematic Planning: Organize all aspects of a mixed-methods study in a single workspace, from initial questions to final meta-inferences.
- Seamless Integration: MAXQDA neatly groups data you send to your QTT worksheet into qualitative, quantitative, and joint display sections.
- Meta-Inference Development: Write, refine, and link observations that synthesize findings across your data sources.
- Visual Documentation: Gather diagrams, matrices, and concept maps directly from other MAXQDA tools into your worksheet for a complete analytical record.
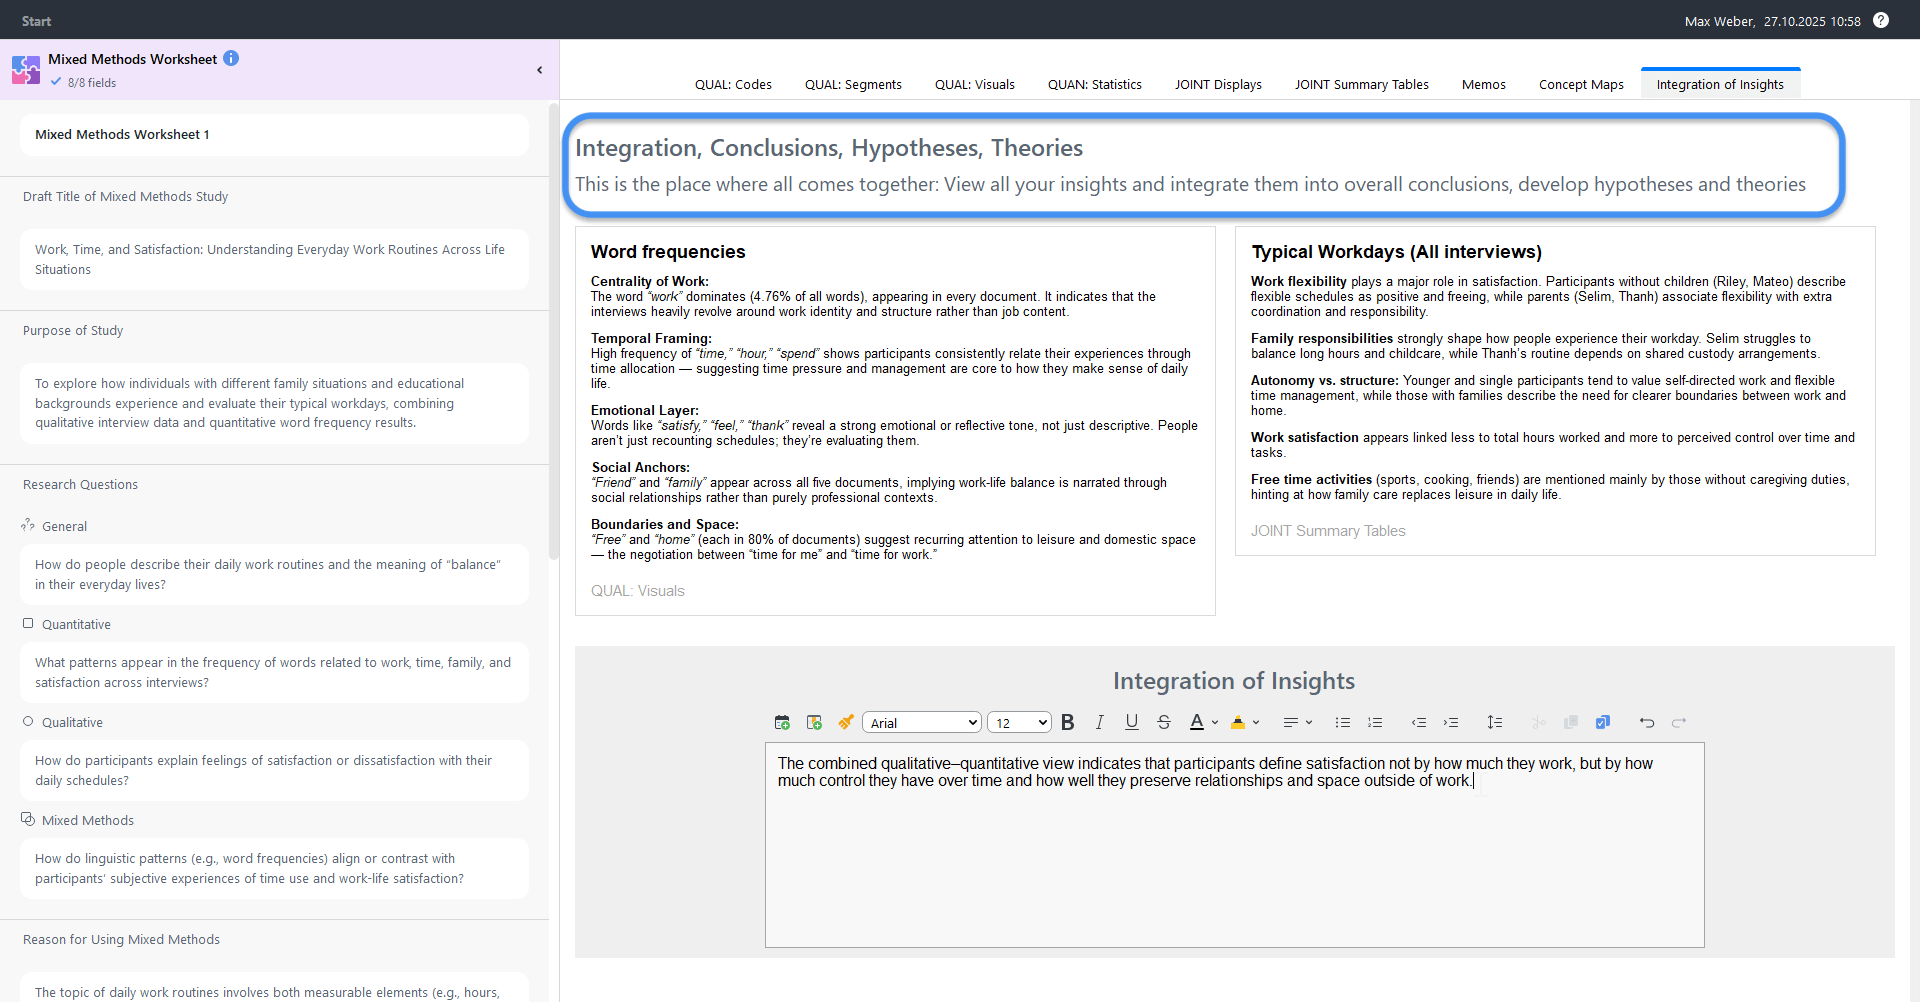
🧠 Why it matters: Mixed methods research requires careful coordination of multiple data streams. This worksheet removes the guesswork, providing a structured framework that keeps your integration process transparent and your findings defensible.
📍 Where to find it: Create a new QTT Worksheet from the Analysis menu and choose between a Qualitative or Mixed Methods worksheet.
Click the
Other Improvements Worth Noting
- Improved QTT Workspace Layout: QTT worksheets now feature a collapsible sidebar for project details and metadata. Collapse it when you need maximum workspace, expand it when you need to edit your research questions, study purpose, or framework, keeping your analytical space flexible and organized.
- Traditional Chinese Support: MAXQDA’s interface is once again available in Traditional Chinese (繁體中文).
- Faster Media File Handling: Optimized file access delivers smoother performance, especially when working with large media collections.
- Zoom Controls: New zoom-in and zoom-out icons in the “Document Browser” offer an alternative to keyboard shortcuts for adjusting document views.
- Expand/Collapse All: You can now collapse or expand all items in the code and document tree with a single click.
- Refreshed Code Color List Filter: The filter in the “Document Browser” now features a modern, streamlined design.
- Preserved Internal Links: Internal links within project files are now maintained when sharing projects with collaborators.
Prefer to See It in Action?
Here’s our 2025 November Upgrade at a glance:
This one’s probably for you if:
- You’re juggling multiple surveys and dream of neatly keeping them all in one project
- Your mixed methods “integration” lives in a messy Word doc you’re afraid to open
- You keep promising yourself you’ll properly structure your mixed methods workflow… next week
- You’re here for all the quality-of-life improvements that make research feel less like a marathon
Research That Flows
Whether you’re navigating the complexities of survey data or orchestrating a multi-method study, this upgrade is designed to meet you where you are. The new Survey Analysis workspace brings clarity to scattered data, while the Mixed Methods QTT Worksheet transforms integration from an abstract concept into a structured, manageable process.
Our latest MAXQDA Upgrade is about making your research feel less fragmented and more focused. Update today and experience what it’s like when your tools work as hard as you do.

