A tool similar to the CMB is the Code Relations Browser (CRB). The CRB is a visualization of the relationships between codes. A table shows how many document segments any two codes are attached to. The representation is similar to the Code Matrix Browser, but in this case, the little squares/circles stand for the number of co-occurrences of codes.
The CRB is constructed as follows: Codes form the columns and the rows. The symbols at the individual nodes indicate how many segments were coded with both the row's code and the column's code. The larger the symbol, the more segments there are.

You can open the CRB in different ways:
- By selecting Code Relations Browser in the Visual tools tab,
- with the keyboard shortcut Ctrl+Alt+R (Windows) or cmd+option+R (Mac)
Code Relations Browser options
After opening the Code Relations Browser an options window will appear, which allows you to change display options. Often, only the activated documents might be of interest, for example.

First, you have to decide which codes will be shown as rows:
All codes – All codes will be shown, the order being the same as it is in the “Code System”
Activated codes – Only the activated codes will be shown as rows.
A similar decision has to be made for the columns in the Code Relations Browser, with the added option of Choose top level code. Selecting this option will open another dialog window after pressing OK, allowing you to select as many top level codes as you want. The selected top level codes and their subcodes will be shown as columns in the Code Relations Browser.
Under Type of analysis you can decide which relations MAXQDA will show, as well as how often a code was used in a document:
Co-occurrence of codes – Only “real” overlaps of codes will be used, which means that a segment has to be coded with both codes and the codes need to overlap.
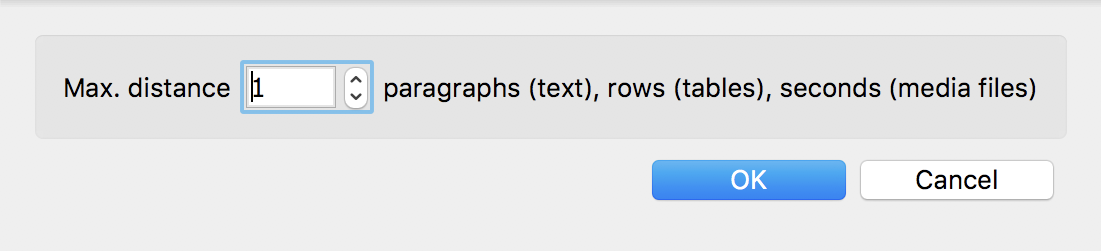
Near (codes) – Alternatively the Code Relations Browser can analyze how many encodings exist in which two codes are present at a defined distance from one another. After clicking OK, you can define the desired distance.
If you search with function "Near (codes)" and chose distance "0" you may find more hits than searching for Co-occurrence of codes. The function "Near (codes)" only evaluates if two codes are assigned somewhere in the same paragraph – not at the same segment.
Count hits per document only once – The Code Relations Browser counts the number of documents in which an overlap or proximity (near) of codes exists. It does not matter how many times the overlap or proximity occurs within a document.
Only for activated documents - This setting is used to restrict the display in the Code Relations Browser to the documents that have been activated in the "Document System".
Only for segments of the following codes - While the "Only for activated codes" function acts as a filter on the document level, you can limit the search for overlaps to coded segments in this area. If you drag a code from the code system into the field with this mouse, MAXQDA only interprets overlaps of coded segments between segments under this codes.
Code Relations Browser toolbar
At the top of the screen, you will find the toolbar with the following functions:
![]() Code map – Opens the code map.
Code map – Opens the code map.
![]() Quote Matrix – Export all coded segments in an Excel table.
Quote Matrix – Export all coded segments in an Excel table.
![]() Create hierarchical codes - If this option is activated, the codes are displayed in the hierarchical structure of the code system, even if the option "Only activated codes" is set, non-activated parent codes are also included to maintain the tree structure. If the option is deactivated, all codes are displayed on one level. If the "Only activated codes" option is activated, then only the activated codes can be displayed.
Create hierarchical codes - If this option is activated, the codes are displayed in the hierarchical structure of the code system, even if the option "Only activated codes" is set, non-activated parent codes are also included to maintain the tree structure. If the option is deactivated, all codes are displayed on one level. If the "Only activated codes" option is activated, then only the activated codes can be displayed.
![]()
![]()
![]() Names, columns: none/short/full – Determines display of document names in column headers.
Names, columns: none/short/full – Determines display of document names in column headers.
![]() Display nodes as squares.
Display nodes as squares.
![]() Display nodes as circles.
Display nodes as circles.
![]() Display nodes as values.
Display nodes as values.
![]() Co-occurrence of codes – Switches to an “overlap” type analysis.
Co-occurrence of codes – Switches to an “overlap” type analysis.
![]() Near (codes) – Switches to a “near” type analysis and displays a dialog window in which the maximum distance can be defined. (In table documents only the nearness of coded segments in the same column will be evaluated. Coded image segment will be ignored generally.)
Near (codes) – Switches to a “near” type analysis and displays a dialog window in which the maximum distance can be defined. (In table documents only the nearness of coded segments in the same column will be evaluated. Coded image segment will be ignored generally.)
![]() Count hits per document only once – The Code Relations Browser display will be based not on the number of coded segments but rather on the full document, meaning it will display only whether the code occurs in the document or not. For collapsed subcodes, the code frequency of the subcodes will be aggregated.
Count hits per document only once – The Code Relations Browser display will be based not on the number of coded segments but rather on the full document, meaning it will display only whether the code occurs in the document or not. For collapsed subcodes, the code frequency of the subcodes will be aggregated.
![]() Binarize view – Regardless of how many coded segments are present in a cell, this function displays only whether a coded segment is present or not; the symbol size is therefore unified. Even when a collapsed subcode with multiple encodings is present, only one will be counted.
Binarize view – Regardless of how many coded segments are present in a cell, this function displays only whether a coded segment is present or not; the symbol size is therefore unified. Even when a collapsed subcode with multiple encodings is present, only one will be counted.
![]() Sum – displays the sum of rows and columns.
Sum – displays the sum of rows and columns.
![]() Refresh – updates display via the Refresh function.
Refresh – updates display via the Refresh function.
![]() Open as Excel table – Displays the matrix with the code frequencies of the CRB in Excel. The columns and rows are reversed to allow an easier import into SPSS.
Open as Excel table – Displays the matrix with the code frequencies of the CRB in Excel. The columns and rows are reversed to allow an easier import into SPSS.
![]() Export – Exports the displayed matrix as values, meaning the number of coded segments per code and per document, in Excel or HTML format. The columns and rows are reversed to allow an easier import into SPSS. Export as a graphics file (Vector or Bitmap) is also possible.
Export – Exports the displayed matrix as values, meaning the number of coded segments per code and per document, in Excel or HTML format. The columns and rows are reversed to allow an easier import into SPSS. Export as a graphics file (Vector or Bitmap) is also possible.
What is actually shown in the Code Relations Browser?
Each symbol in the matrix represents the number of intersections of the two codes. The larger the symbol, the larger the number of intersections. If you choose to switch to the Near function, the symbols represent the number of times two codes exist near to each other (within a certain number of paragraphs, defined in your settings).
If you click on the Count hits per document only once icon in the toolbar, the symbols represent the number of documents that have at least one instance of an intersection or proximity between the two codes. It no longer matters how many times these intersections occur in each document.
How are symbol sizes determined?
How MAXQDA determines the symbol sizes is explained in detail in the Code Matrix Browser section.
Jumping from the symbol to the coded segment
You can jump to the document segments with overlapping codes by double-clicking on the node representing them. The “Overlapping” retrieval function will automatically be activated, bringing up the segments in the “Retrieved Segments” window. The CRB can remain open, so you can quickly go from one set of overlapping codes to another.
Exporting the CRB as an image file
The Export ![]() symbol allows you to save the current CRB display as a file, which you can then insert easily into a word processing file or Powerpoint slide.
symbol allows you to save the current CRB display as a file, which you can then insert easily into a word processing file or Powerpoint slide.
Click on the camera icon![]() to copy the actual view into the clipboard. Now you can open Word, PowerPoint, or other programs and paste the image into it by choosing Ctrl+V (Windows) or cmd+V (Mac).
to copy the actual view into the clipboard. Now you can open Word, PowerPoint, or other programs and paste the image into it by choosing Ctrl+V (Windows) or cmd+V (Mac).