The Crosstab function has some similarities to the Code Matrix Browser, except that documents are analyzed grouped by document variable. Social groups, such as men and women, or people with different personal background, etc. can be compared based on variable values. All of the variables that are in your project can be used to set up a group.
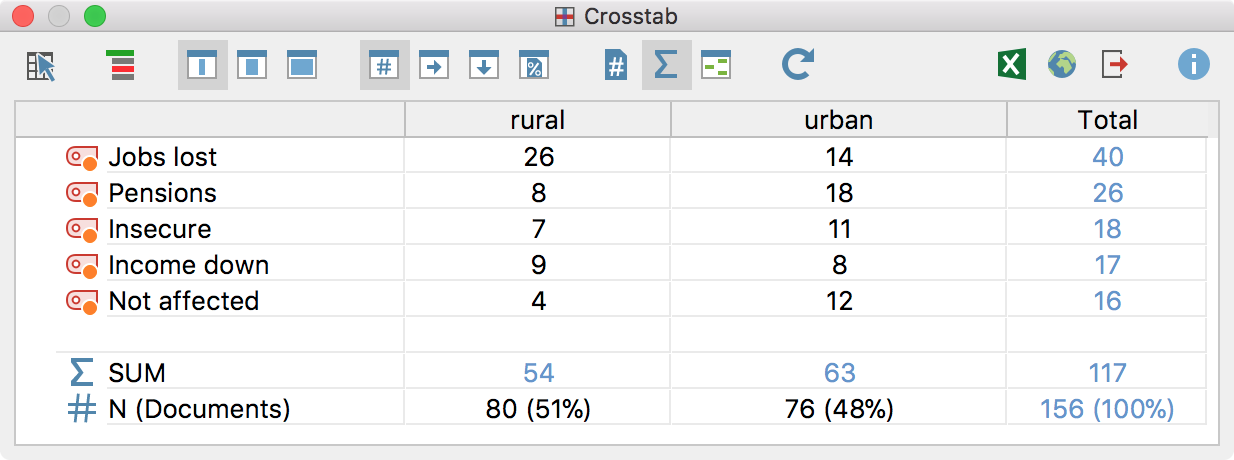
Crosstab is a visualization of the relationship between document variables and codes. The following example displays the number of times each code occurred in interviews in rural and interviews in urban areas.

Creating a Crosstab
Choosing your codes
As usual in MAXQDA, the selection of codes is done via activation. The selection should be completed before using the Crosstabs function, otherwise all codes will be displayed in the Crosstab.
Define columns
The definition of the columns is done by defining appropriate variable conditions (formulas) in the dialog window, which is similar to the Activate by Document Variables dialog window.
To do this, open the Crosstab function in the Mixed Methods tab.
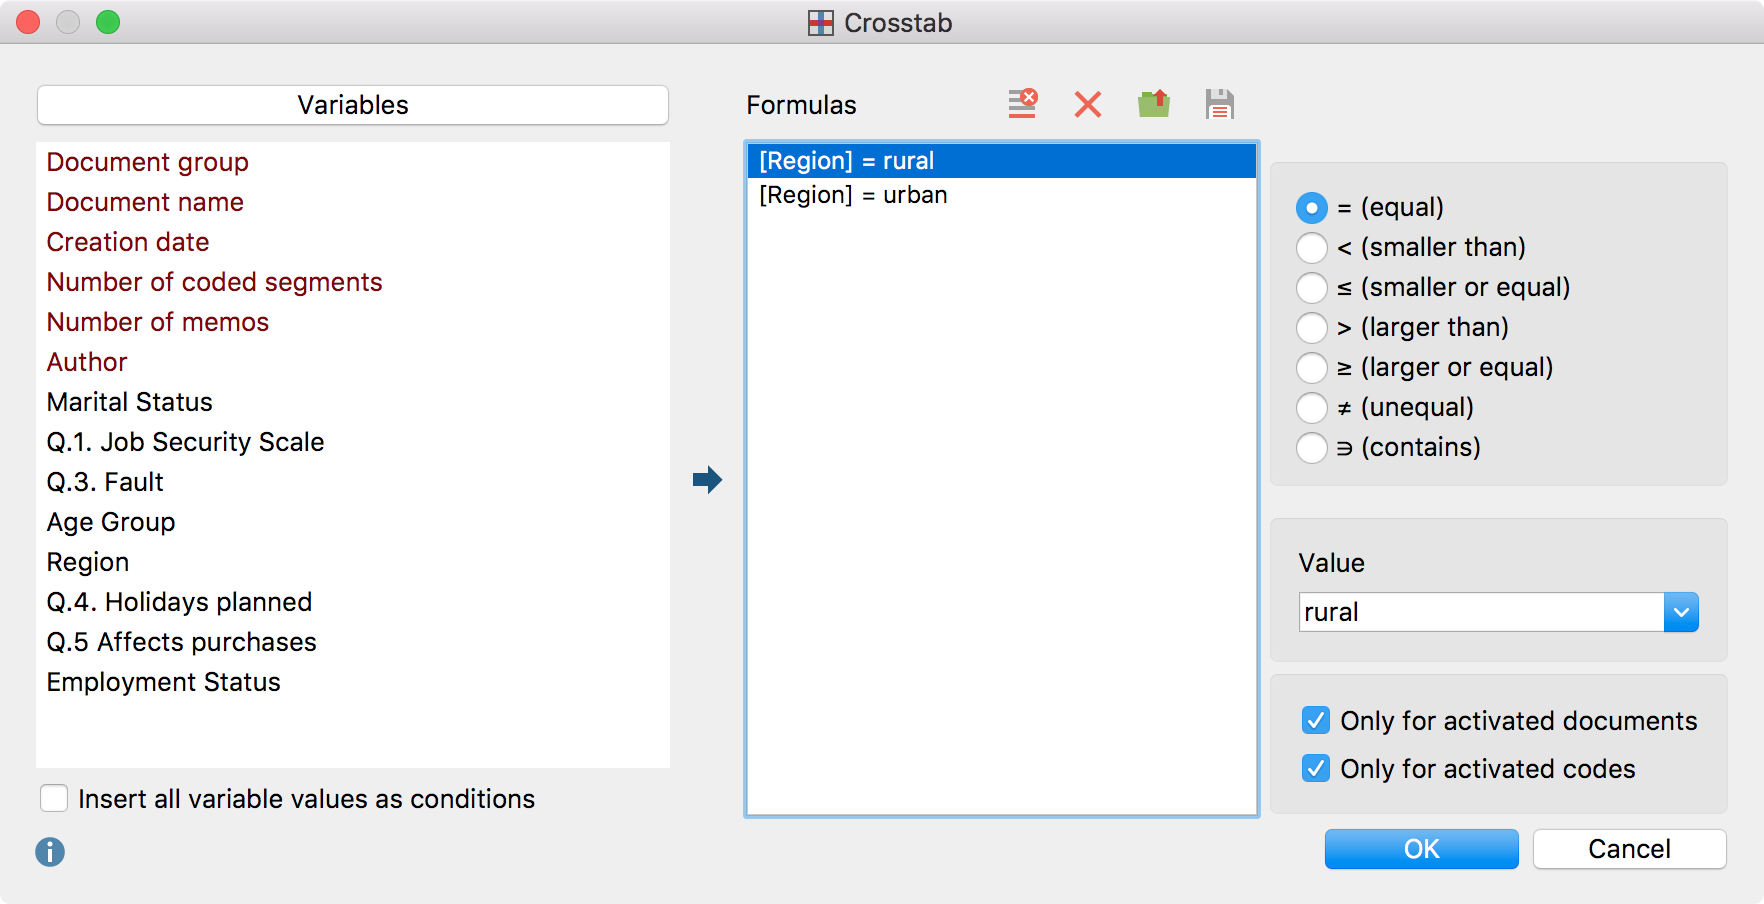
After activating codes and selecting Crosstab, you will have the option to create logical conditions that will be used to assign documents to each column. The window is broken up into the following sections:
- A list of all the document variables in the project.
- A section for the definition of logical conditions (formulas).
- Buttons for selecting operators and values.
- Buttons for opening and saving logical conditions (formulas).

All logical formulas must have the following components:
variable name / operator / value
If you have created a variable called “Region” and used the characters “urban” for urban regions and “rural” for rual regions, we would use the following formula in order to create one column of the Crosstabs to represent interviews from rural regions:
Region = rural
If you wish to record all occurrences of a variable in the table (e.g. region) as a column in the Crosstab, you would follow these steps:
- Select the option Insert all variable values as conditions.
- Double-click the desired variable in the left pane of the window.
MAXQDA then lists the formulas that you have set up in the middle pane of the window. In the example, it would look as follows:
[Region] = urban
[Region] = rural
The Crosstabs created in this way would look as follows:

Tips for defining columns
If there are many different possible values for a certain variable, you can choose to delete those that you don’t want to include in the visualization. If, for example, you had a variable “level of organization” with possible values “very high,” “high,” “medium,” “low,” and “very low,” you might only want to compare the two extremes. To do so, click on the element you wish to remove from the list in the Formula row and click the Delete ![]() symbol.
symbol.
You can also compare groupings based only on specific variable values by not checking the box to Insert all variable values as conditions. Instead, you would simply create a formula and add single values by following these steps:
1. Double-click on the desired variable in the list of variables to set it as a condition (formula).
2. Insert the appropriate variable value in the field on the right side of the window or choose it from the drop-down list. The drop-down list will have all the values that were assigned to the chosen variable. Choosing the value from the list helps you avoid any typos that would cause you to get false results.
3. Repeat the first three steps to set up each column of the Crosstabs.
When you click OK, the table will be displayed.
You can also save formulas, so that you can have quick access to them at a later time and don’t have to reenter them one by one. Just click on the Save button at the bottom of the dialog window. You can then give it a name and choose where you want to save it.
Files for saved formulas are saved by MAXQDA as .LOA files. To open a saved set of formulas, choose Open and navigate to the place you saved the .LOA file.
Functions in the toolbar
The Crosstab function can be accessed from the Mixed methods tab or from the context menu of a code.
The Crosstab toolbar at the top of the window offers the following in addition to the usual export functions:
![]() Interactive Quote Matrix – Displays the coded segments from the table in an interactive window.
Interactive Quote Matrix – Displays the coded segments from the table in an interactive window.
![]() Code Hierarchy – Displays code system with or without code hierarchy.
Code Hierarchy – Displays code system with or without code hierarchy.
![]() Number of segments – Displays absolute frequencies, meaning the number of segments of the respective codes for the variable form of the respective column.
Number of segments – Displays absolute frequencies, meaning the number of segments of the respective codes for the variable form of the respective column.
![]() Row percentage – The percentage share of the cell calculated across the row (horizontal percentage calculation).
Row percentage – The percentage share of the cell calculated across the row (horizontal percentage calculation).
![]() Column percentage based on the sum of coded segments (row “SUM”) – The percentage share of the cell calculated across the column (vertical percentage calculation).
Column percentage based on the sum of coded segments (row “SUM”) – The percentage share of the cell calculated across the column (vertical percentage calculation).
![]() Column percentages based on the number of documents “N (documents)” – The column percentage in terms of the number of documents in the column (the option Count hits per document only once will be selected automatically).
Column percentages based on the number of documents “N (documents)” – The column percentage in terms of the number of documents in the column (the option Count hits per document only once will be selected automatically).
![]() Count hits per document only once – The unit of analysis is set to Document. Each document is analyzed based only on whether the code has been assigned or not; the frequency with which a code occurs within a document is not taken into account.
Count hits per document only once – The unit of analysis is set to Document. Each document is analyzed based only on whether the code has been assigned or not; the frequency with which a code occurs within a document is not taken into account.
![]() Sum – displays the sum of rows and columns.
Sum – displays the sum of rows and columns.
![]() Highlight highest values – for better interpretation of the results higher values are highlightes in green.
Highlight highest values – for better interpretation of the results higher values are highlightes in green.
![]() Refresh – recalculates the values in the table.
Refresh – recalculates the values in the table.
Interactive connection to source files
The cells in the crosstab are interactively linked to the data material in your project. Double-click on a cell to list its segments in the "Retrieved Segments" window.
Crosstab suitability
Crosstabs are well suited for the analysis of sub-categories and their distribution in sub-groups of the sample. Imagine you have asked how students prepare for examinations, and the different options (e.g. reading books, working together with colleagues, etc.) are defined as codes. With the Crosstab function, you can compare various groups with each other. Are female students participating more in training groups? Do male students read more text? The options to view the values as row or column percentages make the interpretation of the data even easier.
