MAXQDA offers the opportunity to save background information on each focus group participant in the form of variables. Suppose you have divided participants into two age groups: With the Crosstab for focus groups, you can easily compare the thematic coding for these two groups. The Crosstab for focus groups functions essentially the same way as the “normal” crosstab: The codes form the columns and the groups of focus group participants form the rows, while the respective code frequencies are presented in the cells.
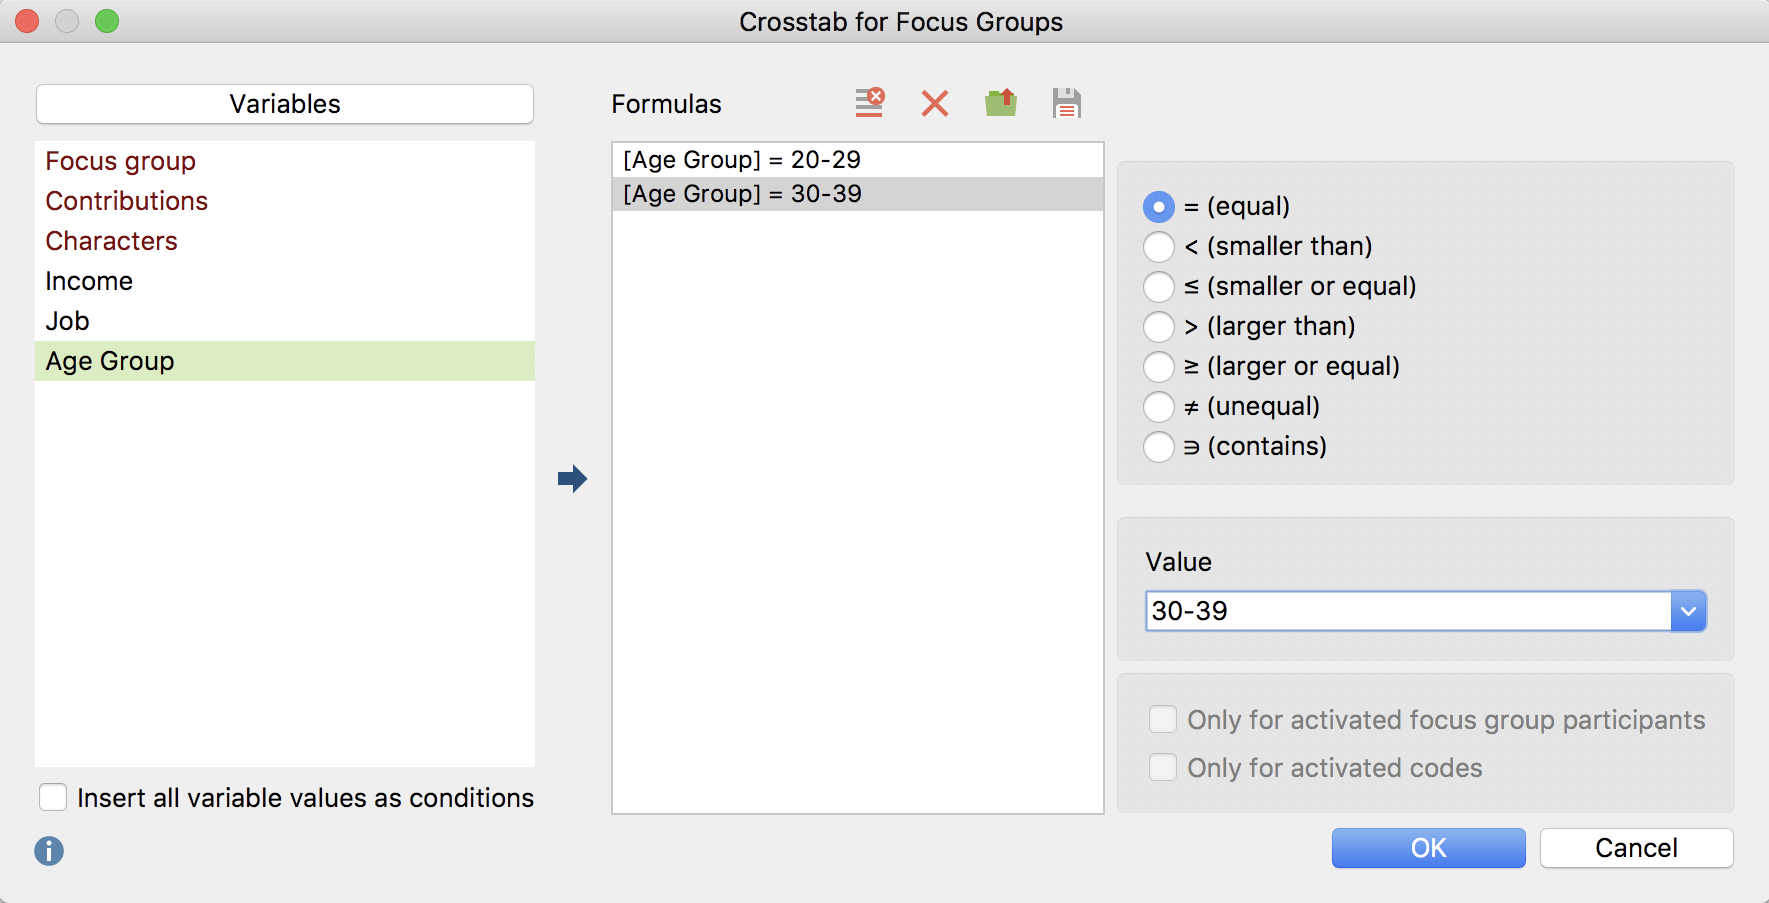
You can find the Crosstab for focus groups function in the Crosstab menu of the Mixed Methods tab. The following window appears, in which you can define the participant groups.

Each line in the middle column of the window forms a column in the final crosstab. In the image above, the option Insert all variable values as conditions has been selected and the variable "age group" has been automatically transferred to the middle pane with with a double mouse-click. MAXQDA has automatically inserted a row for both occurring values, "20 - 29" and "30 - 39".
The final crosstab appears as follows:

The example is read as follows: 33,3% of the 20- to 29-year-olds have been assigned the code “Financial issues”, and 100% of the 30 to 39-year-olds.
