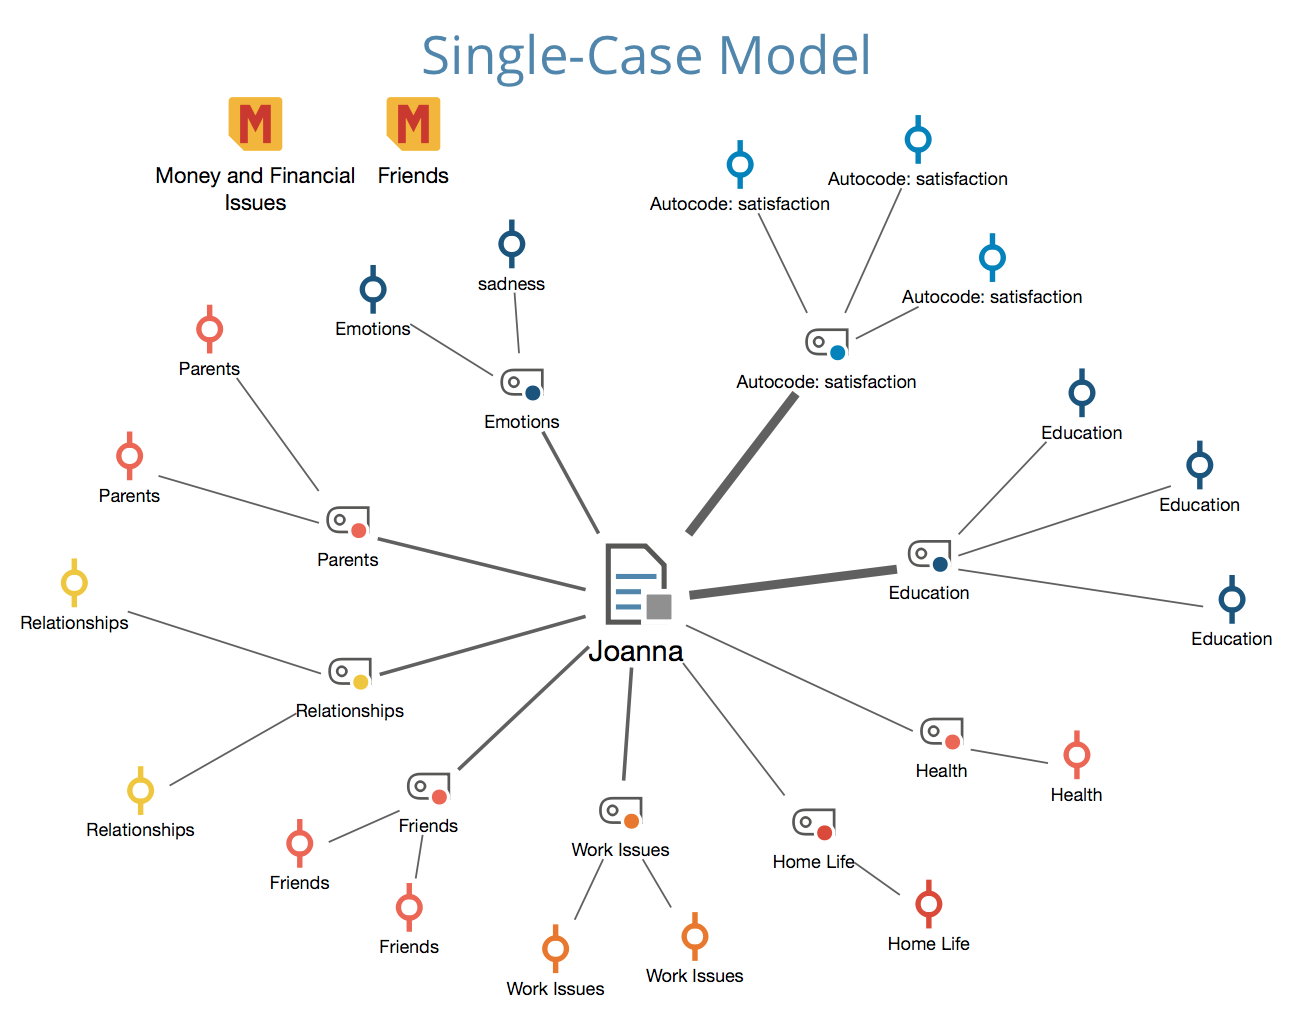
With the model templates, using the one-of-a-kind MAXMaps tool to visualize connections and patterns in your data set is made even easier. During the research process, it is often the case that one focuses on a single part of the material: on a specific text, code, code overlap, or on a specific hypothesis or theoretical aspect addressed in a memo. The new models offer quick, accessible solutions for these situations, and they can be tweaked to fit your specific data set and research focus. MAXQDA uses your settings and data to create an appropriate diagram in MAXMaps. This map can be edited, added to, or rearranged as you see necessary. It produces results that you can literally see: the graphics quality is superb, and with using a vector format for export (like SVG or EMF), you can even print out your maps as large posters for presentations.
These models are available:
Single-Case Model
All relevant data attached to a document is illustrated in the map. This includes all appropriate memos, codes, and coded segments. The Single-Case Model can be created for documents, document groups, document sets and focus group participants. There is also a version with hierarchical code placements available.

Two-Cases Model
This model visualizes which codes occur in both of the selected documents, document groups or document sets, and also which codes only occur in one of the cases.
Single-Code Model
This model is very similar to the One-Case Model, except that a code is the focus rather than a document. The coded segments and memos attached to the code are included in this model along with any memos that are linked to the code.
Code Theory Model
This model is especially helpful for the development of theory. It automatically displays all memos (with their ideas and hypotheses) attached to a specific code.
Code-Subcodes-Segments Model
A code and its subcodes are placed on the map. Each code or subcode is connected to their coded segments. This model is also available in an hierarchical version.
Hierarchical Codes-Subcodes Model
A code and its subcodes are placed on the map. The hierarchical levels of the subcode are displayed like the levels of a building.
Code Co-Occurence Model
This model illustrates the associations and intersections between selected codes. The model can be made more complex by including the subcodes in the visualization.
Creating a new model
To create a new model, follow these steps:
- Click on New Model in the Start tab of MAXMaps and selected a model from the dropdown menu.
- MAXQDA creates a new blank map with the name of the model as a title and will display a short tutorial on how to insert MAXQDA objects: Depending on whether you are creating a case-oriented or a code-oriented model, you will now need to drag objects from your "Document System" or "Code System" onto your map. For this it may be necessary to move the MAXMaps window a bit to the side.
- In the dialog window that appears you can then define options for creating your model.
Models make it possible to explore your data in a unique way. All elements of the map are synchronized with the data of the MAXQDA project in Sync Mode, i.e. merely moving your mouse over certain objects in the model will preview the contents of the symbolized memos or codings. Double-clicking on the symbol of a coded segment will take you directly to the corresponding position in the document.
