A Summary Table is an overview table of summaries and document variables for selected documents and codes. It serves as a compilation of the summaries for selected topics. Summary Tables are a useful tool for presentations and publications.
To create summary tables and to view the summary tables that you have already created, click the ![]() Summary Table icon in either
Summary Table icon in either
- in the Analysis tab
- on the toolbar of the Summary Grid window.
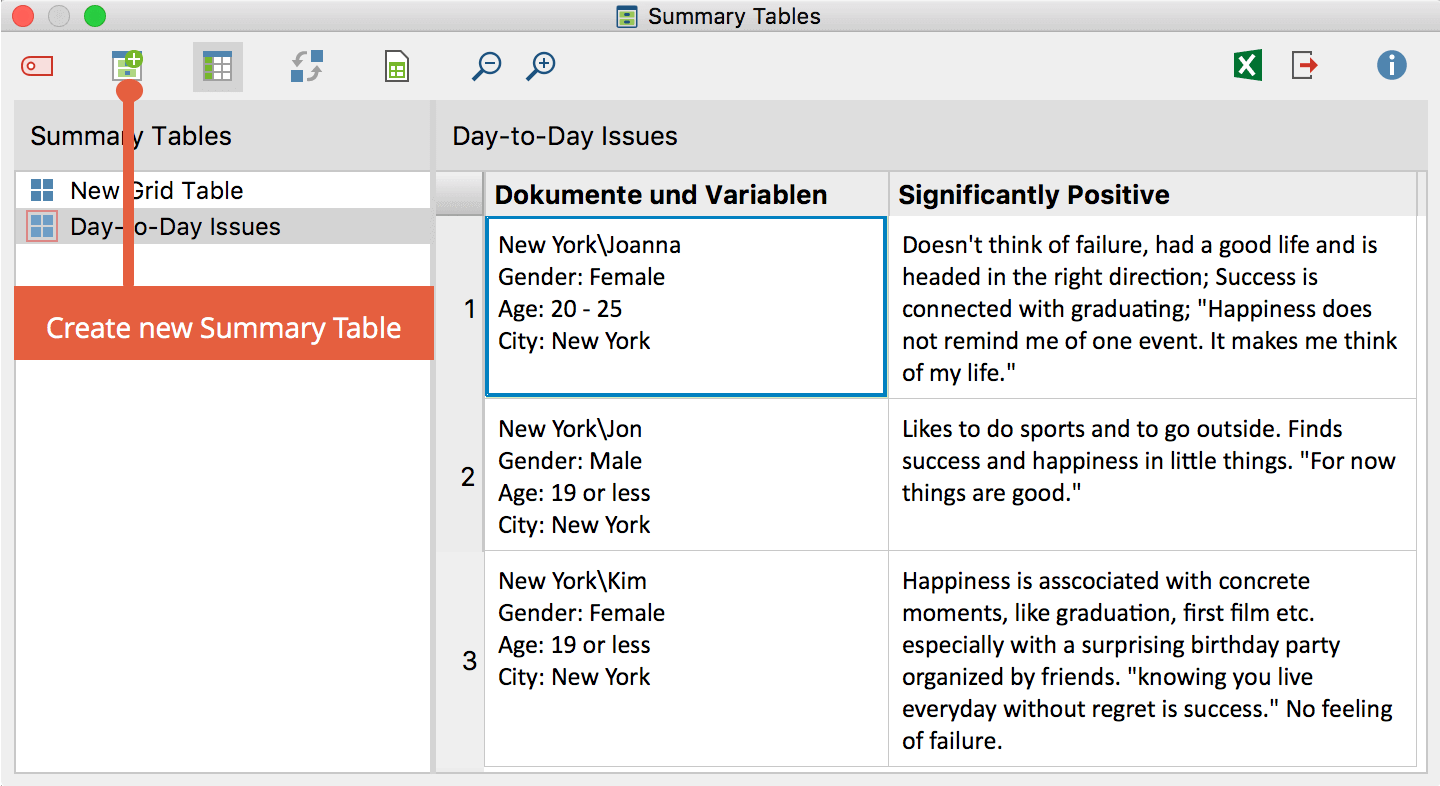
This will open the Summary Tables window. On the left side you find a list of the Summary Tables you have already created and in the window on the right you can view the Summary Table that is currently opened.

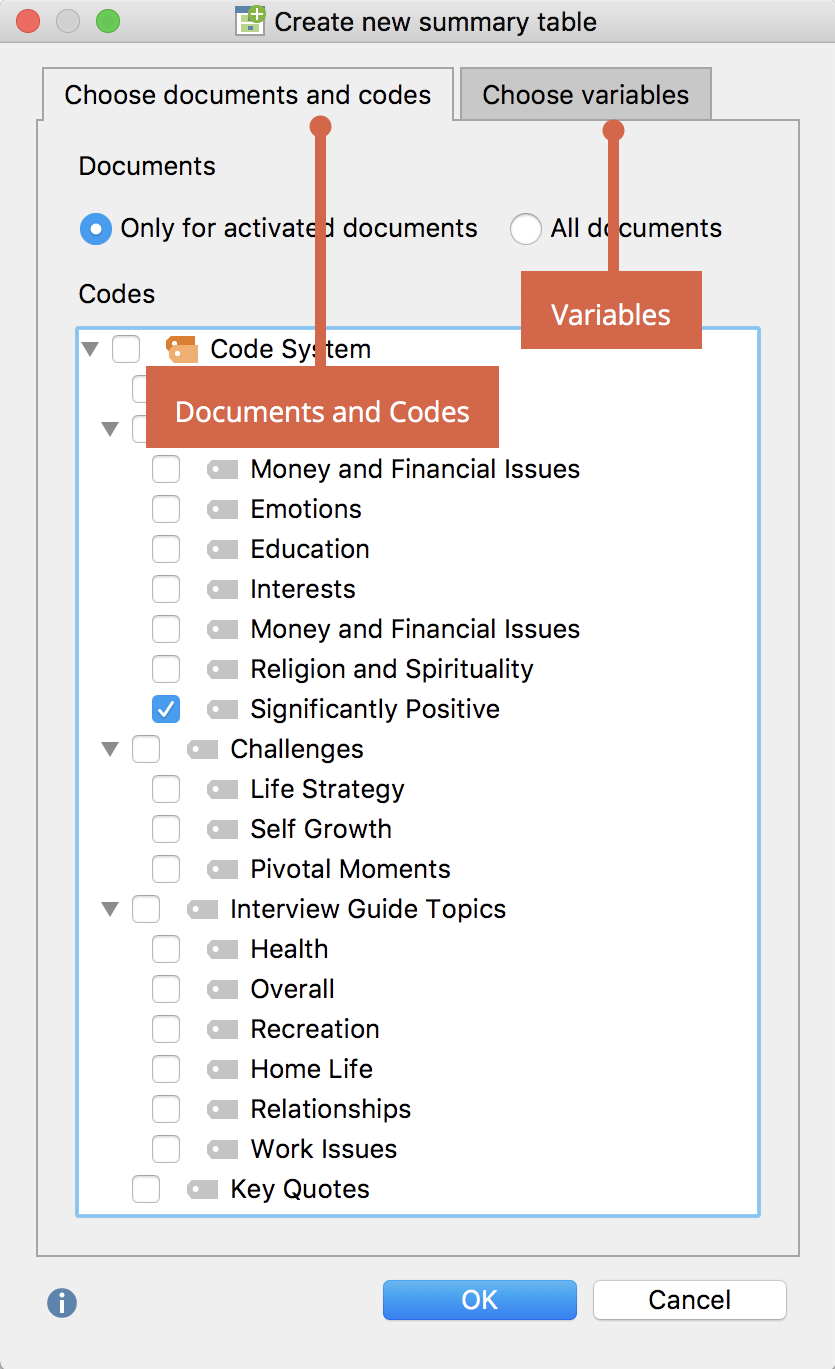
To create a new Summary Table, click the button ![]() in the toolbar. A dialog window will appear that offers three options:
in the toolbar. A dialog window will appear that offers three options:
- You can decide whether to include all documents or only activated documents. This defines the rows of the Summary Table.
- You can select any number of codes, to be displayed in the columns of the Summary Table.
- You can choose which document variables should be output as supplementary information. All variables that are placed in the “Variables for first column” pane will appear in the first column with the document name. All variables that are placed in the “Variables in own column” pane will appear in their own columns after the codes.

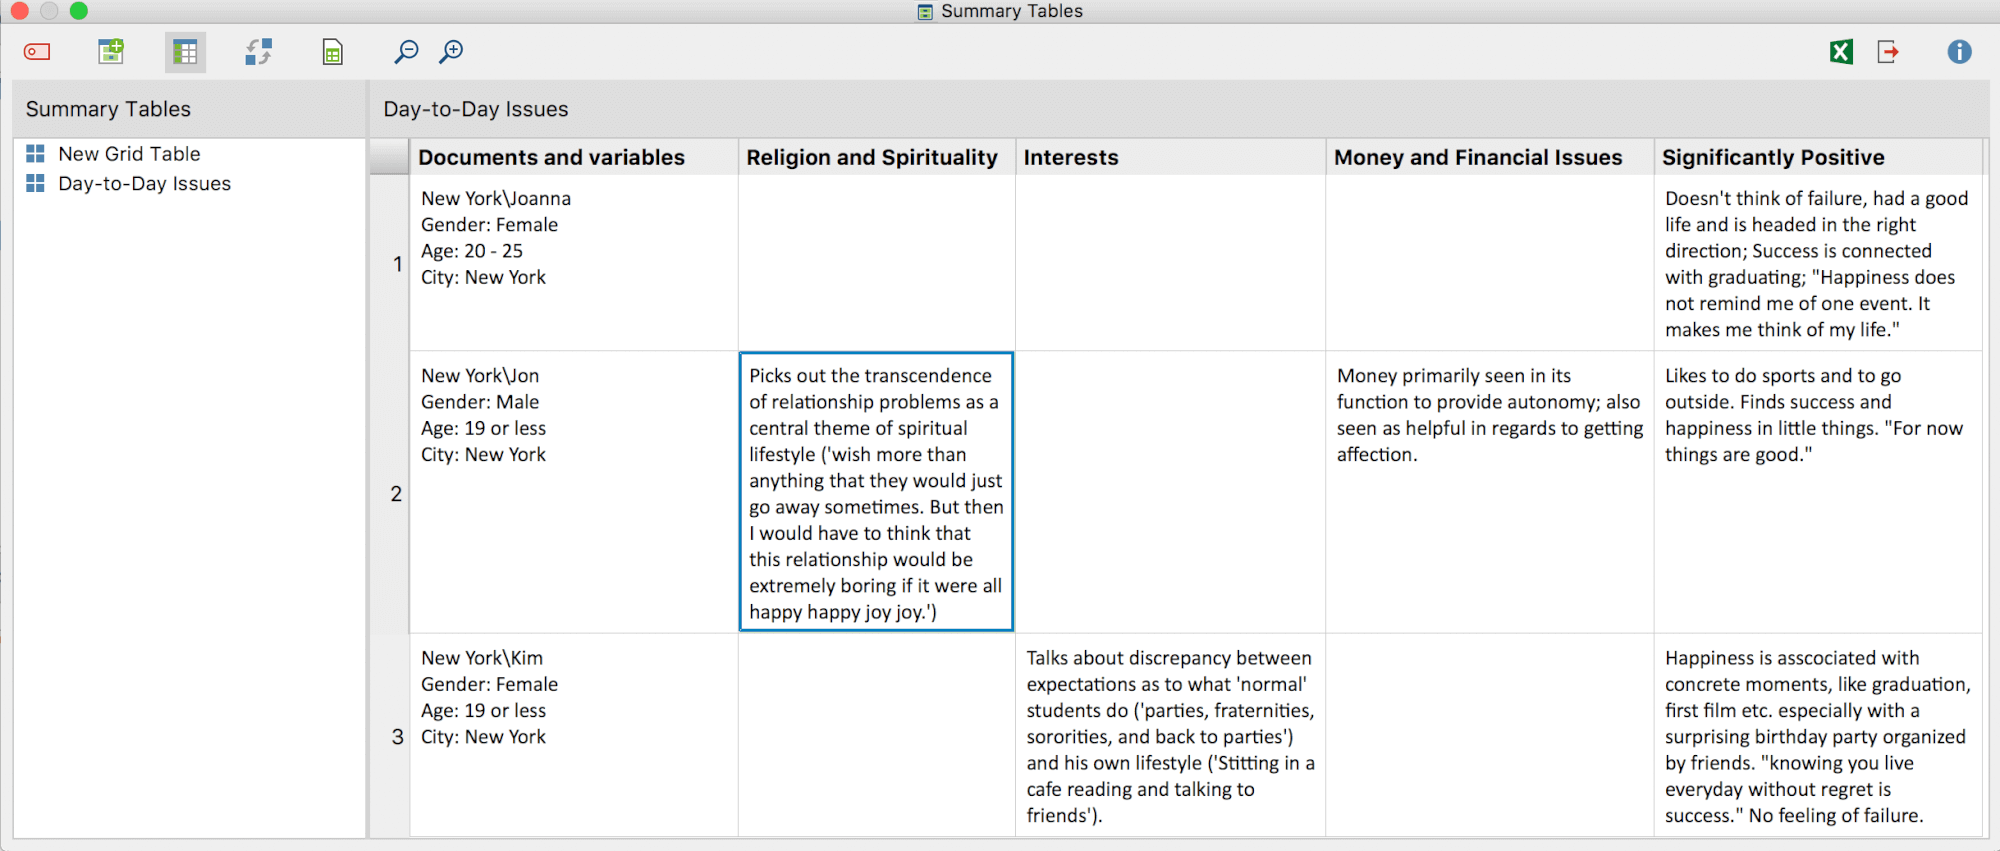
By clicking OK, the table will be created according to the parameters you have chosen:

The Summary Table lists all summaries for the selected codes.
In the first column of the Summary Table, you can see the document group and document name. In addition, the variable values of the variables chosen are displayed underneath each document. This enables you to receive further information about a certain case in the Summary Table.
All table functions of MAXQDA are available:
- You can change the order of columns by clicking and dragging with the mouse.
- You can hide or display columns (right-click on the column header and choose Select fields).
- You can order columns alphabetically by clicking on a column header.
The table is in plain text format, so the entire table is formatted with the same font.
Each cell of the Summary Table is connected invisibly to the assigned coded segments. These can be viewed in the window “Retrieved Segments” by right-clicking in the cell of the Summary Table and choosing “Display associated coded segments.”

Transforming a Column of the Summary Table as a Document Variable
Let’s say one column of your Summary Table contains short and similar summaries for a topic in an interview study. This analytic work can be easily used as a document variable in MAXQDA, e.g. to activate interviewees where you have written the same summary: Right click on the column heading and choose Transform into document variable. MAXQDA will now create a new document variable that contains the summaries as values and will be named as the column. If the variable already exists, MAXQDA will add a number to the name. Please note that the values will be shortened to 63 characters. The column in the Summary Table remains.
Swap Rows and Columns of a Summary Table
You can use the icon ![]() in the toolbar of the Summary Table to rotate the view by 90°, which means you swap the rows and the columns for display. The documents will be displayed in the columns then and the codes (and the variables displayed in an own column) in the rows.
in the toolbar of the Summary Table to rotate the view by 90°, which means you swap the rows and the columns for display. The documents will be displayed in the columns then and the codes (and the variables displayed in an own column) in the rows.
Opening, Deleting, Duplicating and Renaming Summary Tables
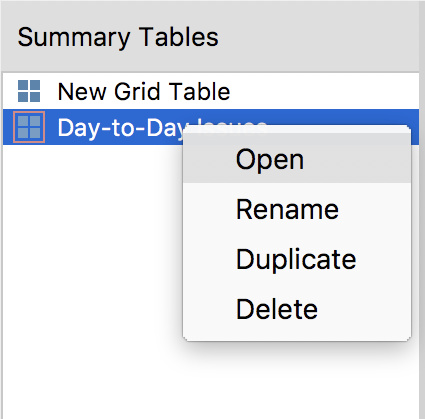
To open an existing Summary Table, double-click on the name of the Summary Table in the left panel. You can also right-click on the name of a table to open a context menu that allows you to open, rename, duplicate or delete the table.

Insert summary table as a table document in the "Document System"
The displayed summary table can be stored as a table document, so that you can then evaluate the data with all of MAXQDA functions. To do this, click the ![]() Insert summary table as a table document icon in the "Document System" that appears in the toolbar.
Insert summary table as a table document icon in the "Document System" that appears in the toolbar.
