Function of this model
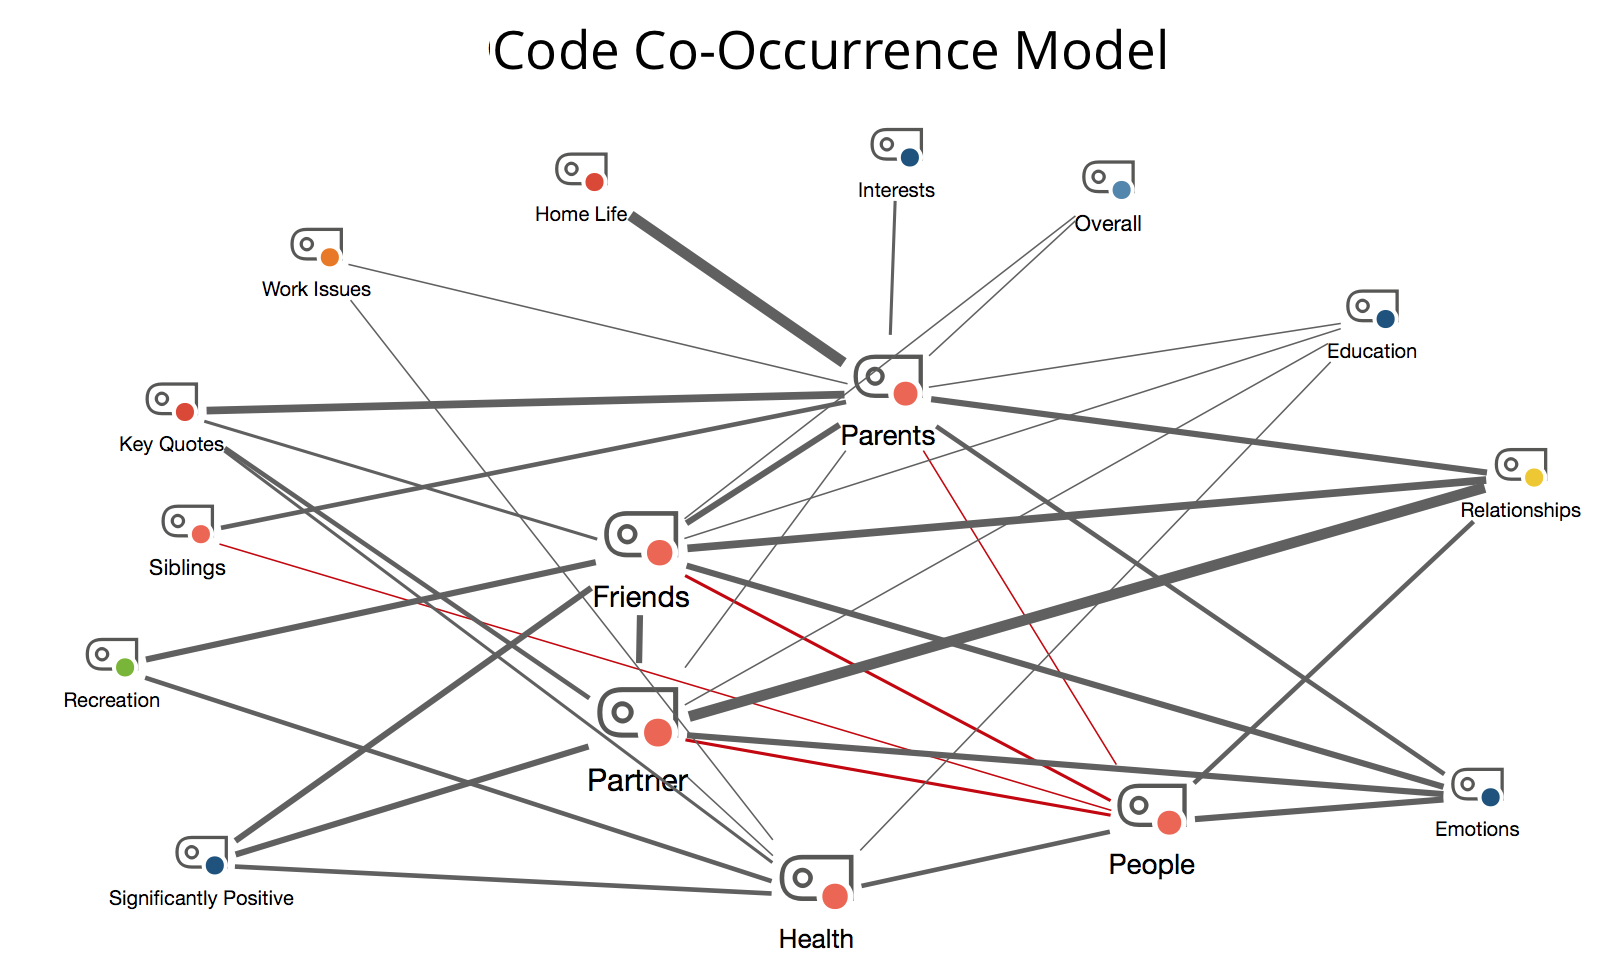
The "Code Co-occurrence Model" records the co-occurrence of codes. Co-occurrence in MAXQDA is understood as the overlap or common occurrence of two or more codes for a particular segment. The subcodes of the selected codes can also be included in this model.
Model display in the map
The selected codes are placed in a circle on the map, the co-occurring (or overlapping) codes will appear around it. These codes are connected with a black line to the code(s) with which they co-occur. The thickness of the lines indicates the frequency of the co-occurrences. If the two codes overlap many times, the line connecting the two will be thicker. Codes are connected to their subcodes with red lines, while co-occurring codes are connected by gray lines.

Creating a new model and determining its structure
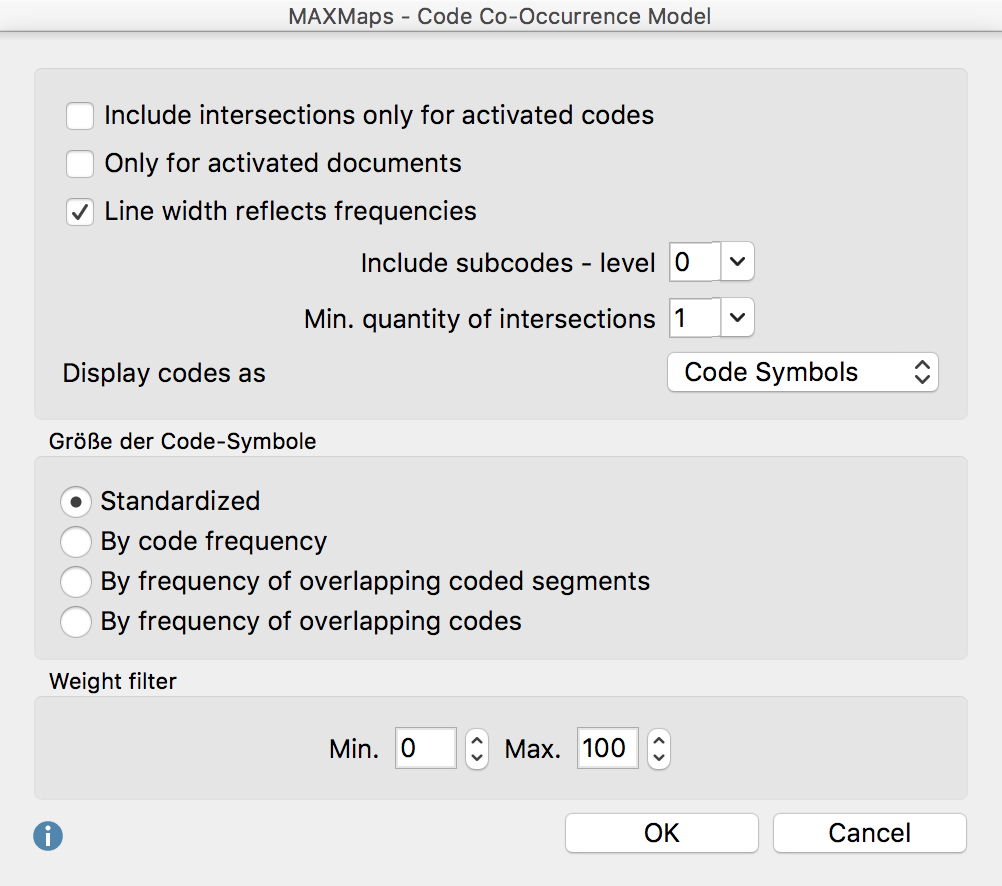
Once you have selected the Code Co-occurrence Model via the New Model menu of the Start tab, drag one or more codes from the “Code System” onto the map. The following dialog window will appear:

Code/Subcode options
Include co-occurrences only for activated codes - The map can be restricted to currently activated subcodes.
Only for activated documents – When creating the model and determining the code sizes, the selected option only takes into account currently activated documents.
Line width reflects frequencies – If you select this option, the connecting lines to codes with many coded segments are drawn thicker than with codes with fewer coded segments.
Include subcodes – level – You can also decide how many levels of subcodes are displayed (0 = no subcodes; 1 = only the first level of subcodes; 2 = two levels of subcodes).
Min. quantity of co-occurrences - If the number set here is not reached, the connecting line is not drawn. So only connecting lines between codes are shown, which have at least as many co-occurrences (or overlaps) as defined here.
Display codes as – The symbols can be displayed as circles or as code symbols in the map. The display of the codes can be subsequently changed via the Properties window.
Code symbol size - Here you can select whether all codes should be displayed in the same size or whether the size should be determined by the number of coded segements or co-occurrences. The Frequency of overlapping coded segments option evaluates how many times that code overlaps with other codes on the map. The Frequency of overlapping codes option on the other hand evaluates how many times the code overlaps with other codes, irrespective of how many coded segments overlap each other.
Options for coded segments
Weight filter - By choosing a range of weight scores, you can limit your map to coded segements of particular relevance. If you set the range to between 80 and 100, for example, then only overlaps will be displayed in your map in which the weights scores of coded segments are in this range.
