When assigning codes to qualitative data, it is recommended that certain criteria be set. You assume, for example, that coding is not arbitrary or random, but rather that a certain level of reliability will be reached. The MAXQDA Intercoder Agreement function makes it possible to compare two people coding the same document independently of each other. In qualitative research, the purpose of comparing independent coders is to discuss the differences, figure out why they occurred, and learn from the differences in order to improve coding agreement in the future. In other words, the actual percentage of agreement is not the most important aspect of the tool. This percentage is, however, provided by MAXQDA.
It is always the goal of qualitative analysts to achieve as high a level of agreement as possible between independent coders. It is not, however, focused on getting to a standard coefficient that is statistically necessary as in quantitative research. Rather, the focus is on a practical improvement of the coding quality. For this reason, one doesn’t focus on the coefficient or percentage of agreement (i.e. the percentage of matching code assignments). Instead, qualitative researchers want to address and edit the code assignments that do not match, so that they can move on with more accurately coded material.
The intercoder agreement procedure
Checking the intercoder agreement involves the following:
- Two coders process the identical document independently and code it according to mutually agreed code definitions. This can be done on the same computer or on separate computers. Of course, it is important that both coders cannot see what the other person has coded.
- The two identical documents coded by different coders must be contained in the same MAXQDA project. The documents must have the same name, but must be in different document groups or document sets!
The following procedure is recommended:
- Create a project with the documents to be coded. The documents must be contained in one or more document groups; or, alternatively, one or more document sets.
- Make sure that the necessary codes are included in the "Code System".
- Make a copy of the project file and pass it on to the second coder.
- Both coders write their names behind all document groups or document sets.
- Both coders independently code the data and add new codes if necessary.
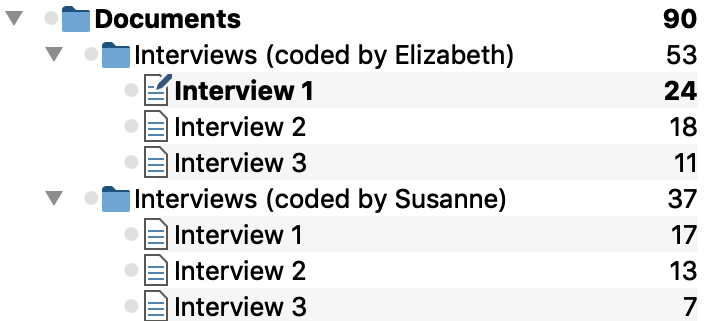
- Use the function Start > Merge Projects to merge both projects into one. The "Document System" will look like this:
- Now MAXQDA's Intercoder Agreement function can be used to compare the code assignments.
- Once the comparison is complete, these added documents can be deleted.
Opening the Intercoder Agreement function
You can start the procedure via Analysis > Intercoder Agreement to check whether two coders agree or disagree in their assignment of codes.

The following dialog box will appear, in which you can adjust the settings for checking the intercoder agreement.

- Select the document group or document set with the document assigned to Coder 1 in the upper drop-down menu and the document assigned to Coder 2 in the lower drop-down menu.
- You can limit the analysis to the currently activated documents and/or codes by selecting the appropriate options.
- In the lower area you can choose between three alternative analysis levels:
Option 1 (document comparison level): Code occurrence in the document
The criterion is the occurrence or absence of a code in the document (i.e.: code occurs vs. code does not occur). This option can be useful, for example, if you are working with relatively short documents, such as free text responses to a survey, and with a large number of codes.
Option 2 (document comparison level): Code frequency in the document
The criterion is the frequency of the occurrence of the code in the document; more precisely, the match (agreement) frequency of the assignment of the code.
Option 3 (segment comparison level): Min. code intersection rate of X% at the segment level
The system checks whether the two coders "agree", that is, whether they match in their coding of individual segments. This option is the most advanced of the three and is the most commonly used option for qualitative coding. A percentage value can be set to determine when two coded segments are considered to match.
Since texts in qualitative analysis processes are not often subdivided into fixed text units, the system checks the correspondence for each segment coded by the two coders (Analysis: Segments of Both Documents). This means that each coded segment is analyzed for a match. Alternatively, you can choose to analyze only the segments of document 1 or the segments of document 2. This can be helpful, for example, to test the extent to which one coder matches a reference example for code assignments.
Results for option 1 "Code occurs in the document".
MAXQDA generates two tables, the "code-specific results table" with the analyzed codes and the "result table" with detailed information on each compared document.
The code-specific results table
The "code-specific results table" lists all evaluated codes and indicates for how many documents the coders match in their assignment of the code:

The example table indicates on the top right that a total of 6 codes were analyzed. There was disagreement (indicated by a stop sign in the first column) only for the code "Resource scarcity ...", and only within one document (indicated by the column "No Agreement"). The numbers in the Agreement, No Agreement, and Total columns refer to the number of documents.
The "Percentage" column indicates how high the percentage agreement is in relation to the respective code. The <Total> line is used to calculate the average percentage agreement - in the example, it is 94.44%.
The detailed result table with evaluated documents
The result table lists all evaluated documents and thus provides detailed information on the agreement of individual documents.

The table has the following structure:
- The first column displays a green symbol if Coders 1 and 2 have assigned the same codes to the document. In this case, there are no "disagreements" and the percentage agreement is 100%.
- The "Agreement" column displays the number of code assignments that match between Coder 1 and Coder 2 for this document.
- The "Percentage" column displays the percentage agreement (i.e. the relative number of matching code assignments). The percentage agreement is calculated as follows: Matches / (Matches + Non-Matches). For Interview 3, the example shows a value of 6 / (6+1) codes = 85.71 % - this is the proportion of codes that match in Interview 3.
- The last column indicates a kappa value that contains a random correction for the level of agreement (calculation: see below).
- The last line "<Total>" adds up the matches and mismatches. The number in the "Percentage" column corresponds to the average number of matching codes, in the example it is 95.24 percent.
The header contains further information:
- On the left you can see the number of code assignments carried out by the two coders, which can often already give first indications of the same or different coding behavior. In the example, one coder has coded 12 segments and the other has coded 14.
- The number of analyzed documents and the relative number of identically coded documents are shown on the right: In the example these are 2 of 3 documents, corresponding to 66.67 %.
In addition to the usual MAXQDA functions for opening the function again and for filtering and exporting the results, the toolbar also contains the following important tools:
![]() Display only disagreements – Hides all matching rows and provides quick access to documents where the coders do not match.
Display only disagreements – Hides all matching rows and provides quick access to documents where the coders do not match.
![]() Ignore unassigned codes / Count unassigned codes as matches - Here you can decide whether any given codes that were not assigned by both coders, should be considered as matches or should be ignored. The difference can explained using the following table:
Ignore unassigned codes / Count unassigned codes as matches - Here you can decide whether any given codes that were not assigned by both coders, should be considered as matches or should be ignored. The difference can explained using the following table:
| Coder 1 | Coder 2 | Agreement? | |
|---|---|---|---|
| Code A | X | X | yes, always |
| Code B | X | no, never | |
| Code C | depending on selected option |
Code C was included in the intercoder agreement check but was neither assigned by Coder 1 nor by Coder 2 in the document. In this case, if you select the option Ignore unassigned codes, code C will be ignored and the relative number of matching code assignments is 1 of 2 = 50%. If the other option is selected, the match is 2 of 3 = 67 %, because code C is taken into account.
Interactive results table
The results table is interactive. Double clicking on a row opens the Code Matrix Browser for the relevant document:

The title bar shows the compared document, in the example "Interview 3". The view immediately shows where the two coders disagreed: Coder 1 has assigned the code "scarcity of resources ...", but Coder 2 has not.
Kappa calculation (Rädiker & Kuckartz)
In the "Kappa (RK)" column, the results table indicates a randomly corrected value for the percentage agreement. It takes into account the probability of two people randomly selecting and assigning the same codes in a document (if they simply randomly selected codes without considering the data material). The calculation only makes sense if you select the option Count unassigned codes as matches and is therefore only visible if this option is selected.
Kappa (Rädiker & Kuckartz), abbreviated to Kappa (RK), is calculated as follows:
Ac = Agreement by chance = 0.5 to the power of the number of codes selected for analysis
Ao = Agreement observed = percentage agreement
Kappa (RK) = (Ao – Ac) / (1 – Ac)
The random correction is generally very small, because the probability for the random match very quickly becomes negligible with an increasing number of codes.
Results for option 2 "Code frequency in the document"
With this analysis option, agreement is deemed to apply when two coders have assigned a code with the same frequency in the document. The difference between the frequencies is irrelevant: if one coder assigns a code A once and the other three times, or if the difference is once vs. six times, both situations are always considered to be a disagreement.
The results for this second analysis option corresponds, in principle, to the first option - with the following exceptions:
- Code-specific results table: The number of documents for which the frequencies per code is a 100% match is displayed in the cells.
- Results table with analyzed documents:
- The cells indicate how many codes were assigned equally frequently by both coders in the document.
- The "Kappa (RK)" column is never displayed.
- Double-clicking on a row also displays the Code Matrix Browser. Here squares of different sizes now indicate the differences in the coded characteristics of the clicked document.
Results for option 3 „Min. code intersection rate of X% at the segment level“
With this option, the system checks at the segment level whether the codes match. If, for example, Coder 1 has coded 12 segments and Coder 2 has coded 14, then 26 test operations are performed and the detailed results table includes exactly 26 rows.
It is often the case that coders deviate slightly from each other when assigning codes, e.g. because a person has coded one word more or less. This is usually irrelevant in terms of content, but can lead to an unnecessarily small percentage match if absolutely identical coding is required, and lead to "false" non-agreements.
You can therefore specify in advance in the options dialog box when two code assignments are to be treated as as a match. The criterion used is the percentage of the intersecting area of two code assignments. The following question is answered: How large is the intersecting area of two code assignments in relation to the total area covered by the two code assignments with their outermost segment boundaries?
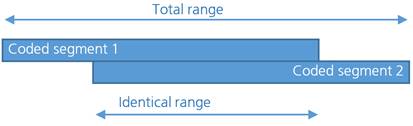
The entry is made as a percentage and the threshold value can be set in the dialog box. The default value is 90%, but can be set higher for testing purposes and then reduced step by step if there are too many "false alarms".
Here, too, two results tables are generated: the code-specific results table and the detailed agreement table.
The code-specific results table
")
This table has as many rows as the number of codes included in the intercoder agreement check. Codes that were not assigned by either of the two coders are ignored. The table provides an overview of the matches (agreements) and non-matches (disagreements) in code assignments between the two coders. It also indicates where the weak points are, i.e. for which codes the desired percentage agreement is not achieved.
Each code indicates the total number of segments coded (Total column), the number of matches (agreements), and the code-specific agreement percentage. In the <Total> row, the (non-)matches are added so that an average percentage agreement can be calculated. In the example, this is 71.43%.
The detailed results table with analyzed segments
The second table allows for an exact inspection of the intercoder agreement, i.e. it is possible to determine for which coded segments the two coders do not match. Depending on the selected setting, the table contains the segments of both coders, or only those of one coder, and indicates whether the second coder has assigned the same code at this location.

Agreement in the assignment of a code to a given segment is indicated by the green symbol in the first column. A red icon in this column indicates that there is no agreement (no match) for this segment.
Interactivity of the Results Table: Compare Segments
The results table is interactively linked to the original data and allows for a targeted inspection of the analyzed segments:
- Clicking on a row highlights both associated documents in the "Document System" and opens them by default in their own tabs, highlighting the clicked segment. In the toolbar you can change the setting from Display in two tabs to Display in two document browsers - then the document coded by "Coder 2" will be displayed in a separate window. This option is especially useful if you are working with two screens.
- Double-clicking on the small square in the "Coder 1" or "Coder 2" columns focuses the corresponding document in the "Document Browser" at the location of the segment in question. This makes it easy to jump back and forth between the two documents and judge which of the two coders applied the code according to the code assignment guidelines.
- If you click on a row with your right mouse button, a context menu will appear as shown in the picture above, allowing you to transfer the code assignment, or lack thereof, from one document to the other directly. For example, select the option Adopt the solution of Coder 1.
Coefficient Kappa for exact segment matches
In qualitative analysis, the analysis of intercoder agreement serves primarily to improve coding instructions and individual codes. Nevertheless, it is also often desirable to calculate the percentage of agreement, particularly in view of the research report to be generated later. This percentage of agreement can be viewed in the code-specific results table above, in which individual codes as well as the ensemble of all codes are taken into account.
Researchers often express the desire to indicate not only percentage compliance rates in their research reports, but also to include chance-corrected coefficients. The basic idea of such a coefficient is to reduce the percentage of agreement to that which would be obtained in a random assignment of codes to segments.
In MAXQDA, the commonly used coefficient “Kappa (Brennan & Prediger, 1981)” can be used for this purpose: In the results table, click on the Kappa symbol to begin the calculation for the analysis currently underway. MAXQDA will display the following results table:
")
The number of codes that match is displayed in the upper left corner of the four-field table. In the upper right corner and the lower left corner you will find the non-matches, meaning one code, but not the other, has been assigned in a document. In MAXQDA, the intercoder agreement at the segment level takes into account only the segments to which at least one code has been assigned; therefore the cell on the lower right is, by definition, equal to zero (as document sections will be included in the analysis only if they are coded by both coders).
"P observed" corresponds to the simple percentage of agreement, as it was displayed in the "<Total >" line of the code-specific results table.
For the calculation of "P chance", or chance of agreement, MAXQDA employs a proposal made by Brennan and Prediger (1981), who dealt extensively with optimal uses of Cohen's Kappa and its problems with unequal edge sum distributions. In this calculation, the random match is determined by the number of different categories that have been used by both coders. This corresponds to the number of codes in the code-specific results table.
Prerequisites for the calculation of randomly corrected coefficients such as Kappa
For the calculation of coefficients such as Kappa, segments must normally be defined in advance, and are provided with predetermined codes. In qualitative research, however, a common approach is that not to define segments a priori, but rather to assign the task to both coders of identifying all document points that they view as relevant, and to assign one or more appropriate codes. In this case, the probability that two coders code the same section with the same code would be lower, and hence Kappa would be greater. One could also argue that the probability of randomly occurring coding matches in a text with multiple pages and multiple codes is so insignificant that Kappa corresponds to the simple percentage agreement. In any case, the calculation should be carefully considered.