Joint displays are used to display, integrate and analyze qualitative and quantitative data and results. MAXQDA offers multiple joint displays for commonly used mixed methods designs, as described by Guetterman, Creswell and Kuckartz (2015) in their article on using MAXQDA to represent the results of Mixed Methods research using joint displays. These designs are:
- Convergent Design (qual. and quan. study parallel)
- Explanatory Design (qual. study after quan.)
- Exploratory Design (qual. study before quan.)
Side-by-side displays of results (coded segments) and (summaries)
Side-by-side displays are used to display the results of a qualitative and a quantitative study together by sorted themes. The display is structured like this:
Qualitative Results | Quantitative Results | |
|---|---|---|
| Theme 1 (Code 1) | Coded segments / Summaries | Coded segments / Summaries |
| Theme 2 (Code 2) | Coded segments / Summaries | Coded segments / Summaries |
| Theme 3 (Code 3) | Coded segments / Summaries | Coded segments / Summaries |
The side-by-side display has two columns. Each column displays coded segments or summaries for each of the two studies. The rows of the table are made up of themes, in this case your codes.
This joint display is especially suitable for convergent designs, where a qualitative and a quantitative study are conducted independently or for the final integration of an explanatory or exploratory design.
Creating a new side-by-side display
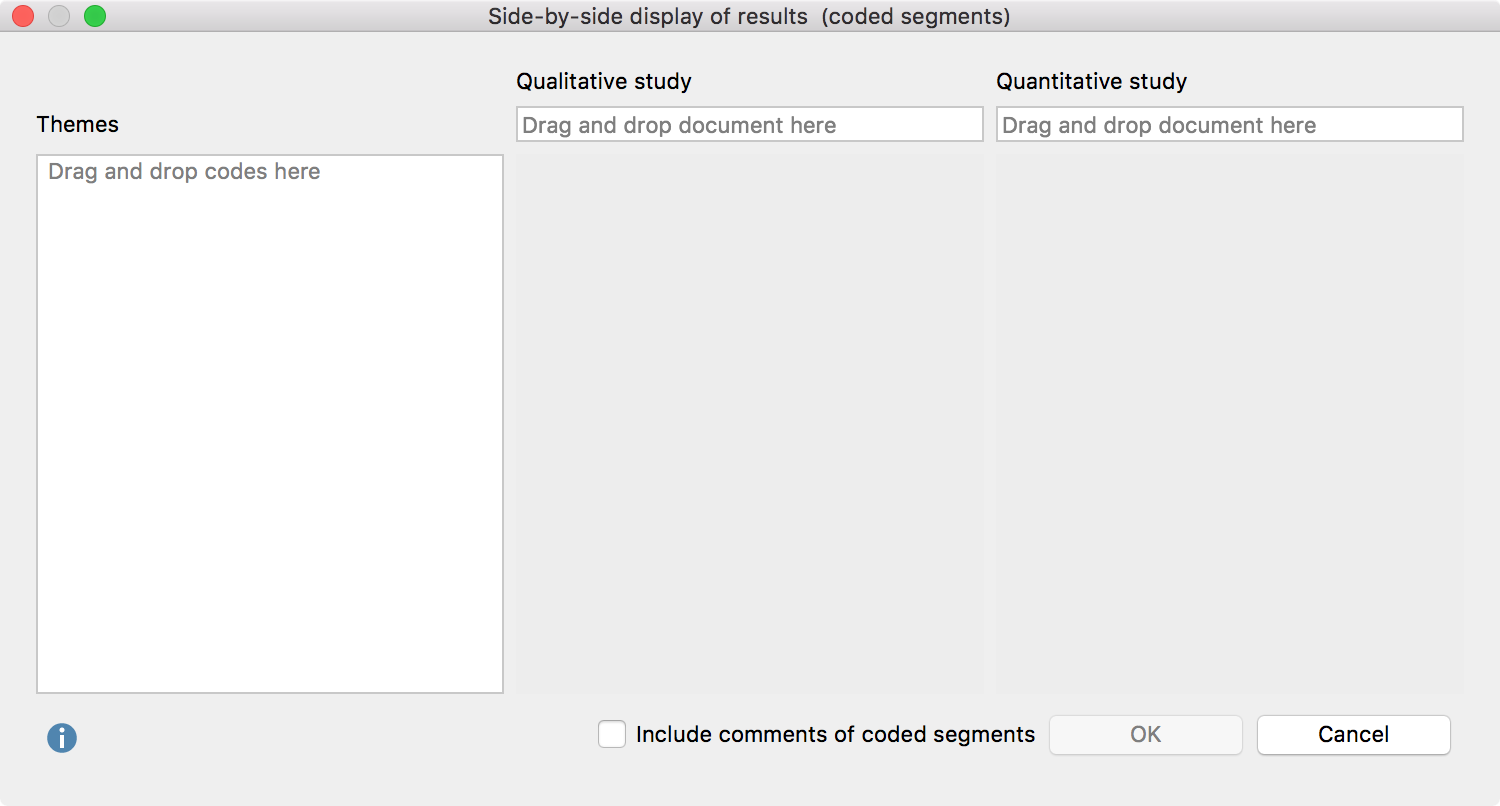
Navigate to the Mixed Methods menu tab and click the Side-by-Side Display entry. From the dropdown select to create a new display for either Coded segments or Summaries. MAXQDA will open the following dialog:

- Drag and drop a document from the “Document System” into each of the fields for “Qualitative study” and “Quantitative study” with your mouse. Drag another document into a field to replace a document you already selected.
- Drag and drop any number of codes from the “Code System” into the “Themes” box on the left. Codes can be rearranged with the mouse. Codes can be removed from the “Themes” box by dragging the code out of the box or selecting the code and pressing Del key (Windows) or cmd-Backspace (Mac).
- Check the box next to Include comments of coded segments to include comments. If a comment exists, it will be displayed below the coded segment in the final display. This option is not available for side-by-side displays created for summaries.
- After clicking OK, a dialog window will appear where you enter a file name and select the location on your computer to save the display to.
MAXQDA generates an Interactive Quote Matrix with two columns for a side-by-side display with coded segments, so that you can explore this display interactively. You can find further information on how to work with this results window in the following section of the manual: Interactive Quote Matrix.
For a side-by-side display with summaries MAXQDA creates a text file in RTF format and opens it in word processing programs such as Word.
Qualitative themes by quantitative groups
This joint display is used to compare coded segments or summaries for groups of documents. Documents are grouped based on variable values. The following table is a schematic representation of a joint display for the document variable “Occupation”. Document groups are created based on their occupational status:
Document variable: Occupation | |||
| unemployed (N = x documents) | employed (N = y documents) | self-employed (N = z documents) | |
| Theme 1 (Code 1) | Coded segments / Summaries | Coded segments / Summaries | Coded segments / Summaries |
| Theme 2 (Code 2) | Coded segments / Summaries | Coded segments / Summaries | Coded segments / Summaries |
| Theme 3 (Code 3) | Coded segments / Summaries | Coded segments / Summaries | Coded segments / Summaries |
Each column displays coded segments or summaries from those documents with the corresponding variable value, separated into rows by themes (= codes).
This joint display is especially suitable for explanatory designs, but could also be useful for convergent (parallel) designs.
Creating a new display
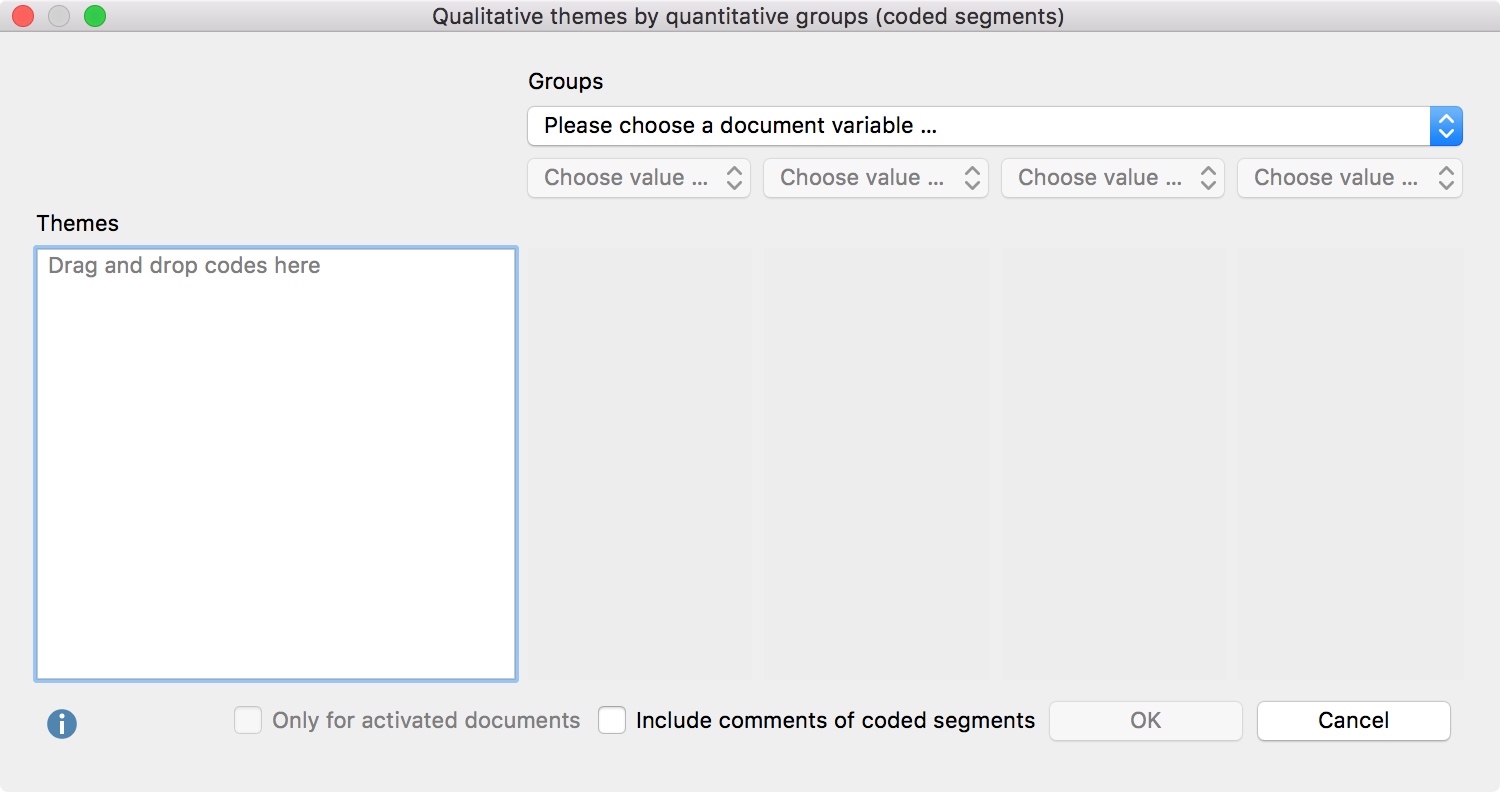
Navigate to the Mixed Methods menu tab and click on the QUAL Themes for QUAN Groups entry either for Coded segments or Summaries. MAXQDA will open the following dialog:

- Select which groups to compare by selecting a document variable and up to four variable values from the drop down menus. MAXQDA will include all documents with the corresponding variable value in the final columns of the display.
- You can limit the display to only include currently activated documents by checking the box next to Only for activated documents.
- Drag and drop any number of codes from the “Code System” into the “Themes” box on the left. Codes can be rearranged with the mouse. Codes can be removed from the “Themes” box by dragging the code out of the box or selecting the code and pressing Del key (Windows) or cmd-Backspace (Mac).
- Check the box next to Include comments of coded segments to include comments. If a comment exists, it will be displayed below the coded segment in the final display. This option is not available for displays created for summaries.
- After clicking OK, a dialog window will appear where you enter a file name and select the location on your computer to save the display to.
MAXQDA then exports the side-by-side display in a RTF document which can be read by Word and opens the document. The result of this display is similar to the result of a Quote Matrix.
Statistics by qualitative groups
This joint display is used to compare types that have been constructed from the qualitative data by statistical values such as mean, standard deviation, etc. The types are created based on the existence of codes in each document. The following table is a schematic representation of this kind of joint display:
| Coded with … | |||
| subcode A | subcode B | subcode C | |
| Variable 1 (numerical) | Mean (Standard deviation) | Mean (Standard deviation) | Mean (Standard deviation) |
| Variable 2 (categorical) | Total (%) | Total (%) | Total (%) |
| Documents | N (%) | N (%) | N (%) |
Each column holds all documents, in which the selected subcode occurs. It is therefore important that only one of the subcodes is assigned to each document. An example could be an evaluative qualitative text analysis where the code “self assurance” has the subcodes “low,” “medium,” and “high”. If one of the subcodes is assigned to each document, they can now be used to create this joint display.
This joint display is suitable for convergent (parallel), as well as explanatory and exploratory designs.
Creating a new display
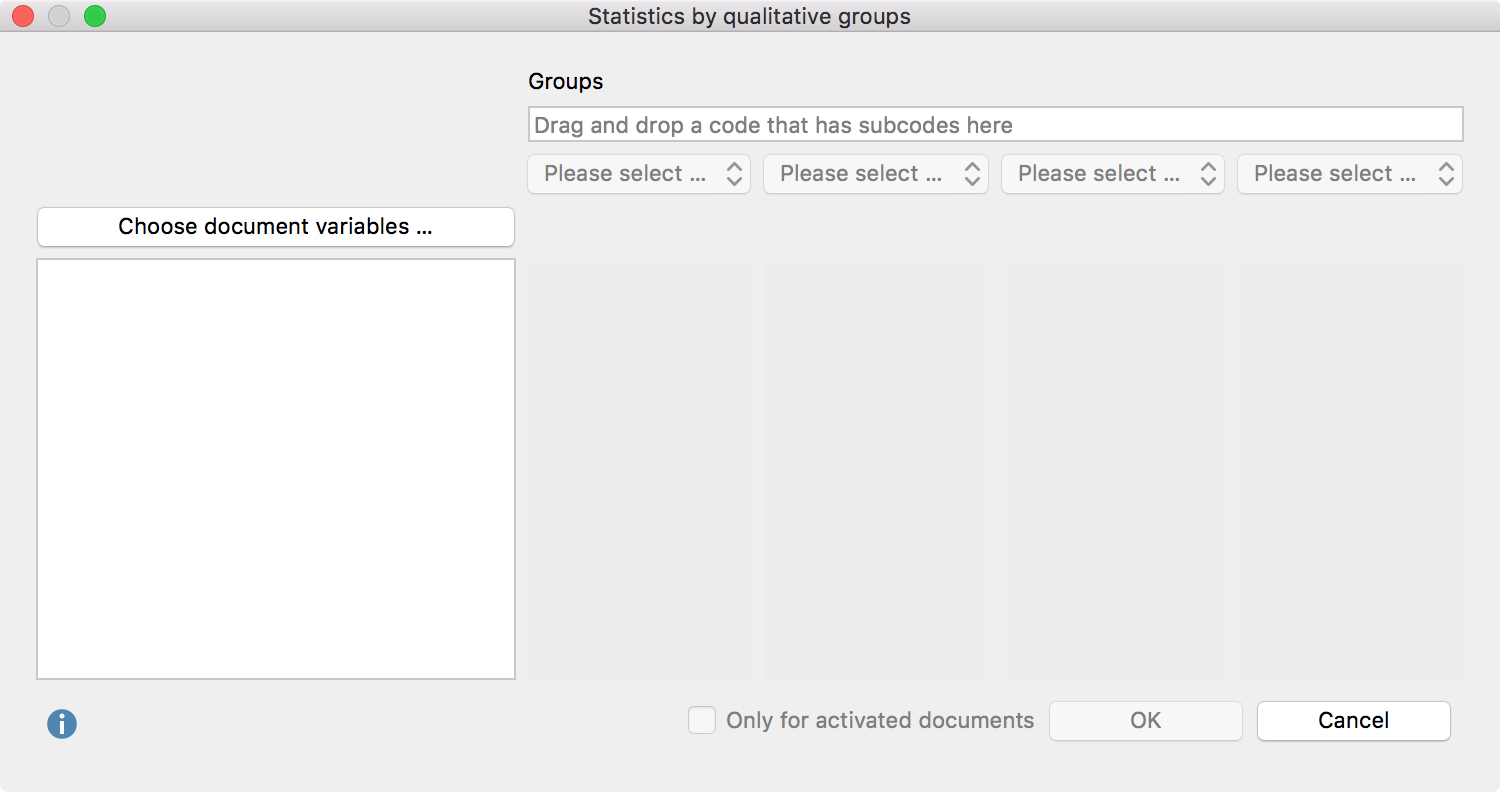
Navigate to the Mixed Methods menu tab and click the Statistics for QUAL Groups entry. MAXQDA will open the following window:

- Create groups by dragging a code that has subcodes (but no sub-subcodes) from the “Code System” window to the “Groups” field at the top of this window. Select up to 4 subcodes from the drop down menus below.
- You can limit the display to only include currently activated documents by checking the box next to Only for activated documents.
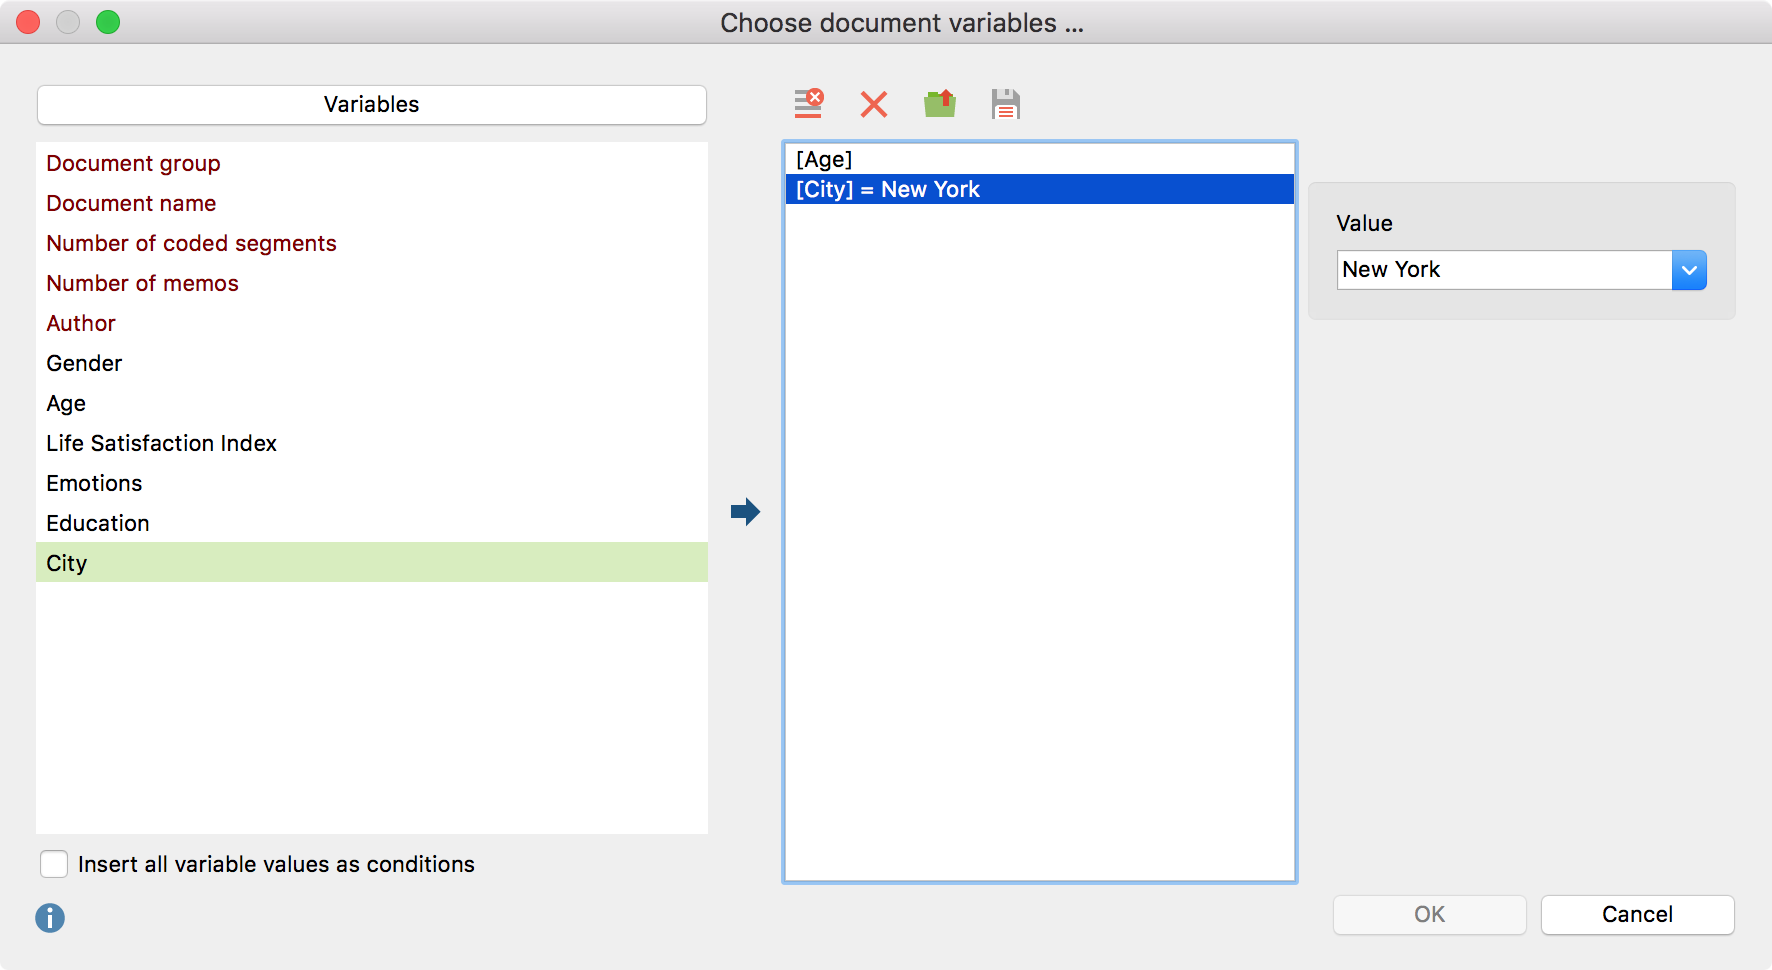
- Click the “Choose document variables…” button to call up the variable selection window. Select which variable values to include for categorical variables.

- Click OK to include your selection and click OK again to create the joint display.
The result of this display is equal to that of a typology table.
