View everything new in MAXQDA 12
Go even further in your analysis with the Summary Tables and create tables of your summaries in which you can easily compare your results. This is a great way to browse your summaries in structured way. Of course you can also export your Summary Tables to Excel to use them in presentations or publications.
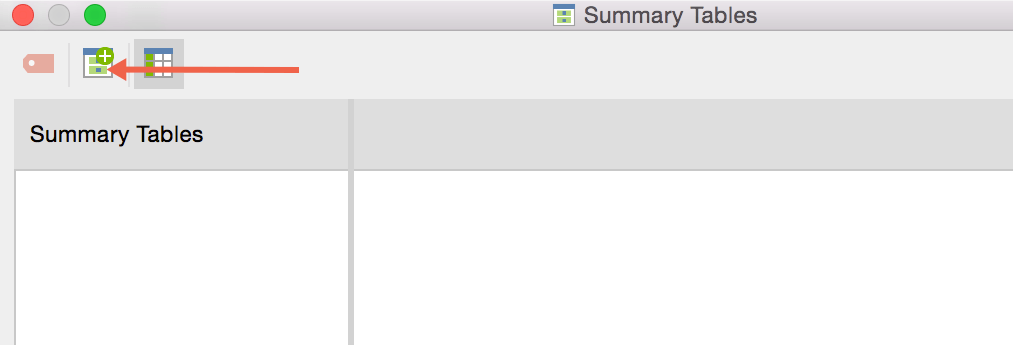
A Summary Table is an overview table of multiple summaries and document variables for selected documents and codes. It makes it easy to compary summaries by document or case. To create or view Summary Tables navigate to Analysis > Summary Tables or click on the  icon. To create a new Summary Table, click on the
  icon at the top left.
In the next dialog window you can select which elements to include in your new summary table:
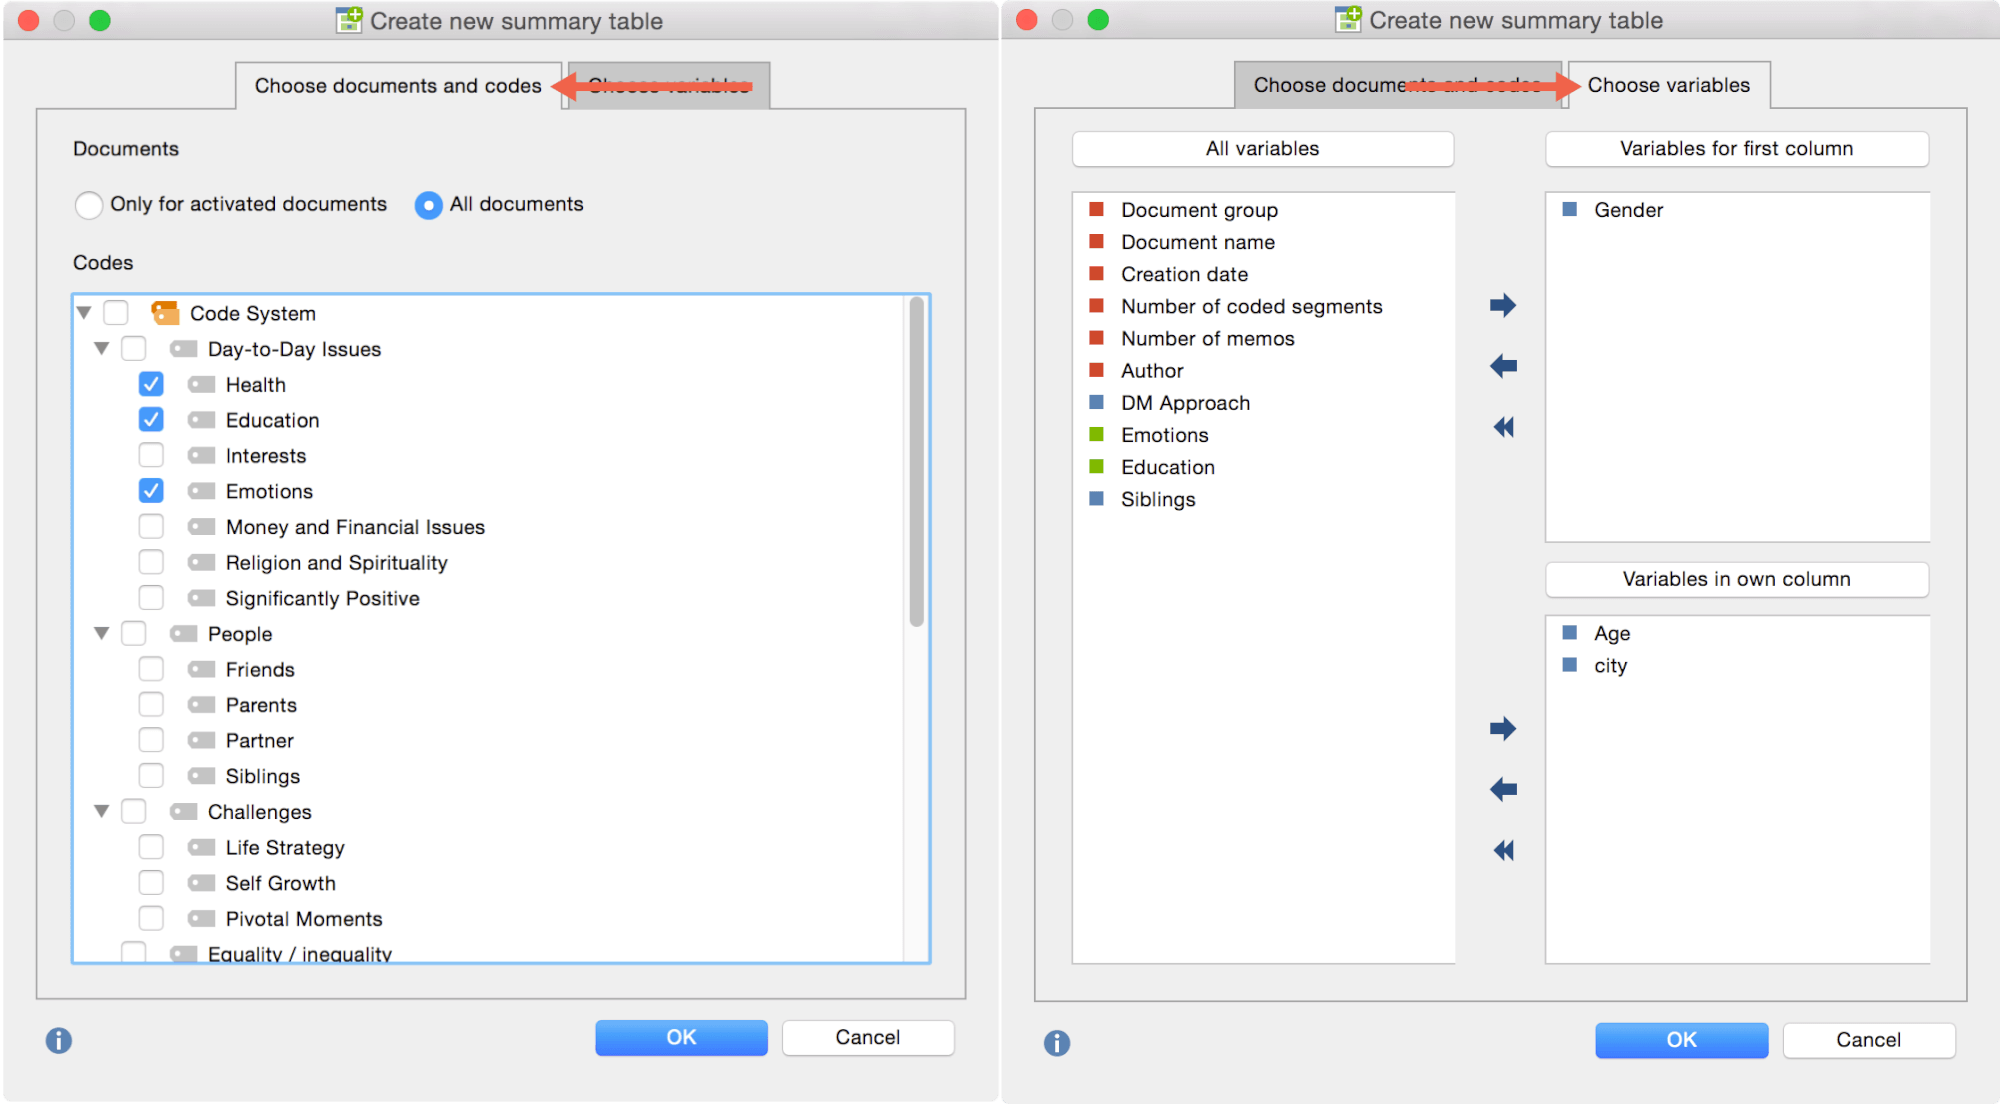
- On the left: Select which codes and if all documents or only activated documents should be included
- On the right: Select which document variable values should be included and if they are displayed in the first column of the table or in their own table column.
By clicking OK, the Summary Table will be created according to the parameters you have chosen.
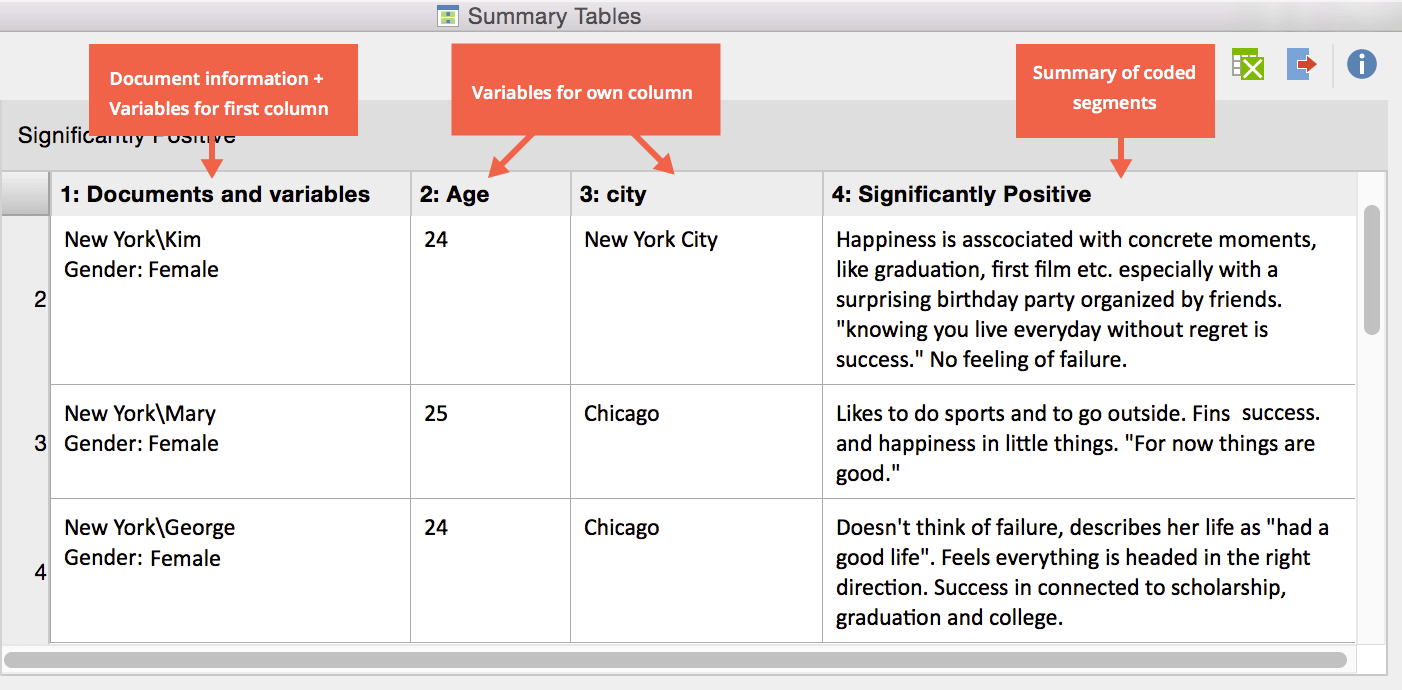
In the first column of the Grid Table, you can see the document group and document name. In addition, those variable values of variables you selected as Variables for first columen are displayed underneath. Each variable value that you selected as Variables in own column are displayed in their own columns. This enables you e.g. to sort by age or city. The summaries itself are displayed in their own column for each of the selected codes. Beneath you can see the summaries for the code “Significantly Positive”.
All table functions of MAXQDA are available, so you may change the position of columns via Drag & Drop or hide columns. By clicking on the column header you may sort the columns alphabetically.
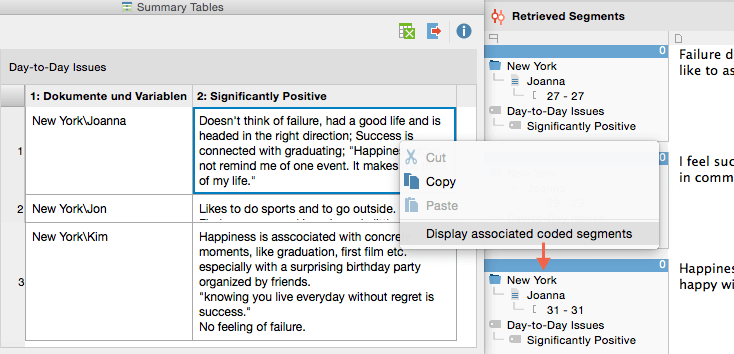
Your summaries stay connected to the original data. Right click on a summary cell in the table and select Display associated coded segments to call up the original comments in the Retrieved Segments window.