With a crosstab you can display how frequently codes appear in documents with different variable values. Start out by activating the codes you want to include in the crosstab and then select Crosstabs from the main menu under Mixed Methods.
In the crosstab dialogue windows choose the variables you want to use as column headers. In this example we want to compare code frequencies for participants who do not have siblings and those who have at least 1 sibling.
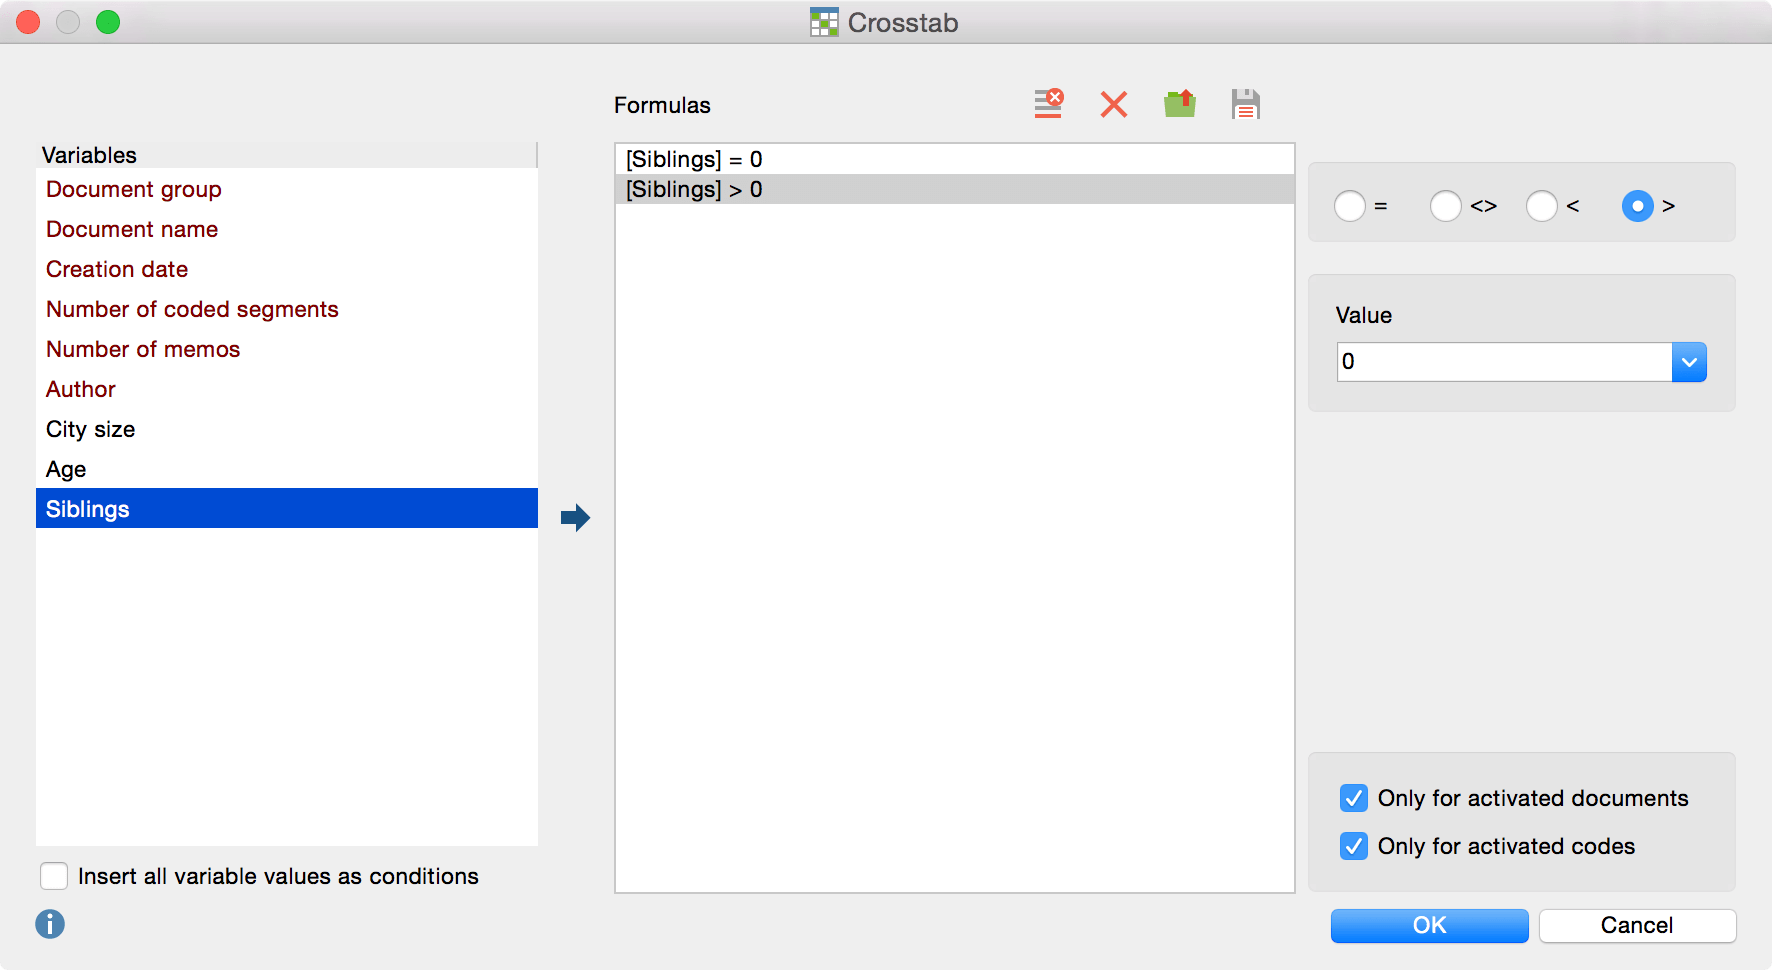
Variables are selected on the left and moved to the right with the arrow icon. For each variable you can choose which values you want to include in each column. Click OK to create the crosstab.
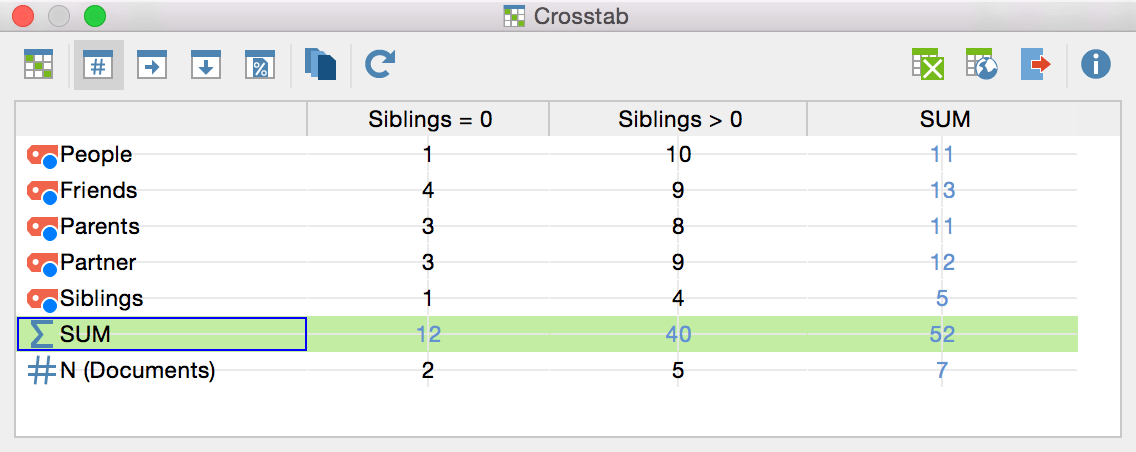
Crosstab displaying number of coded segments
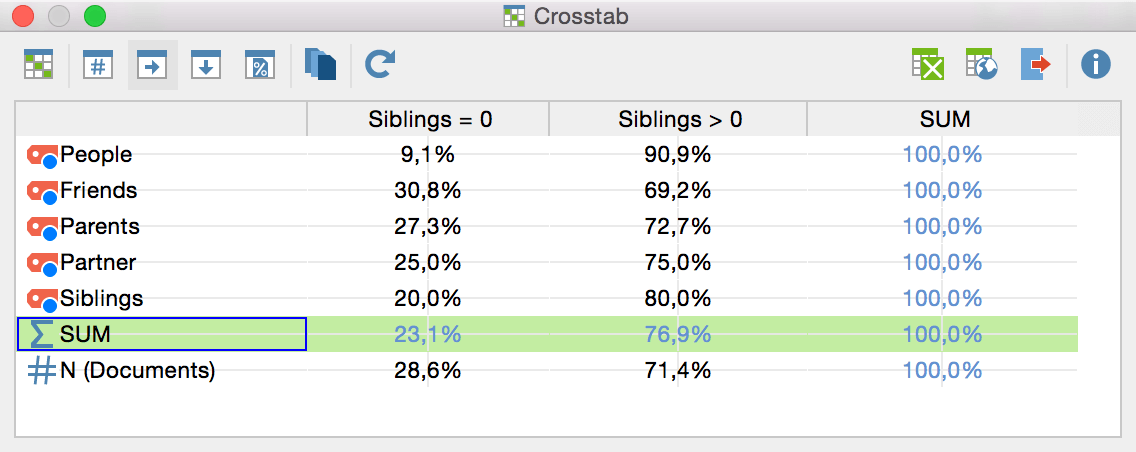
Crosstab displaying row percentage
The x-axis shows all the previously activated codes and the y-axis your defined variables (Siblings with its variable values 0 and > 0). In the toolbar further options are available, e.g. you can change the view to display percentages intead of numerical values. The crosstab can also be opened and exported as Excel or HTML file, or as a Segment matrix.