To work with the mappping tool MAXMap select the option MAXMaps from the Visual Tools drop-down menu or click on the MAXMaps Icon ![]() in the Visual Tools toolbar. The MAXMaps windows will open up.
in the Visual Tools toolbar. The MAXMaps windows will open up.
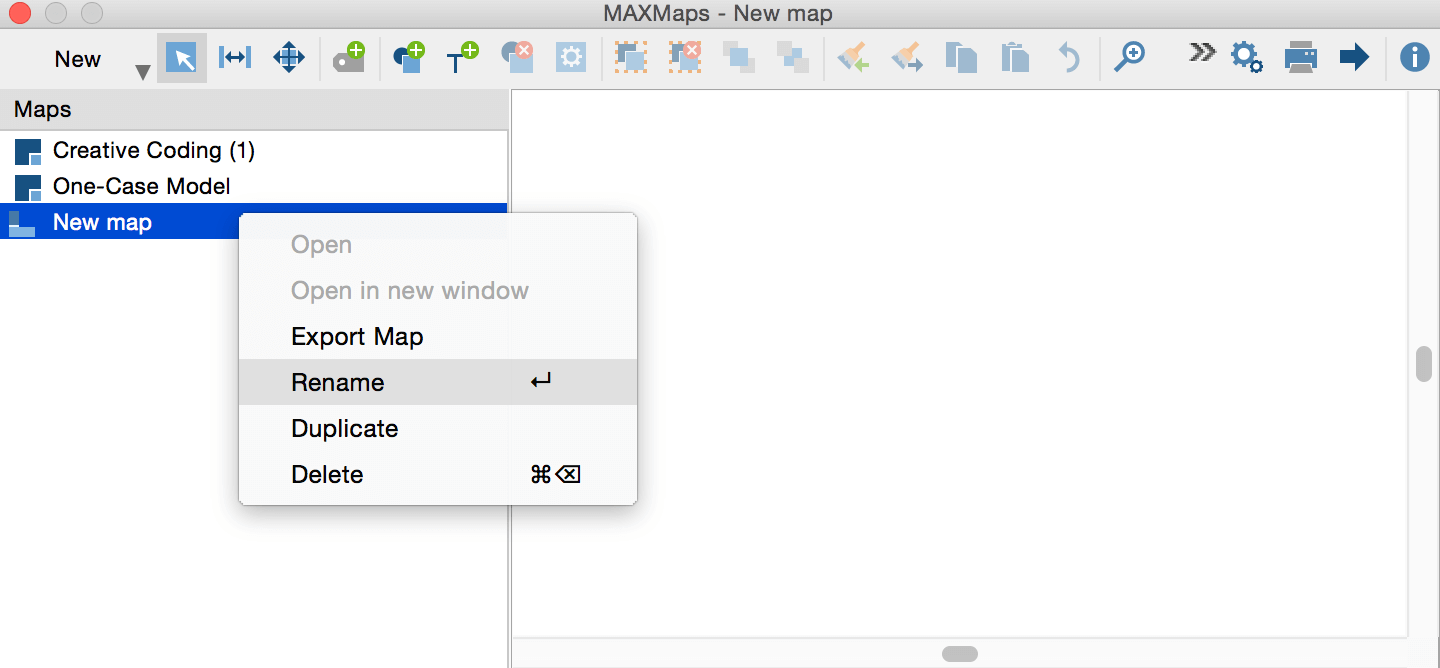
Create a new map by clicking on New > New map in the MAXMaps menu on the top left. You can change the name of the Map by right-clicking onthe map and selecting Rename.
Inserting elements
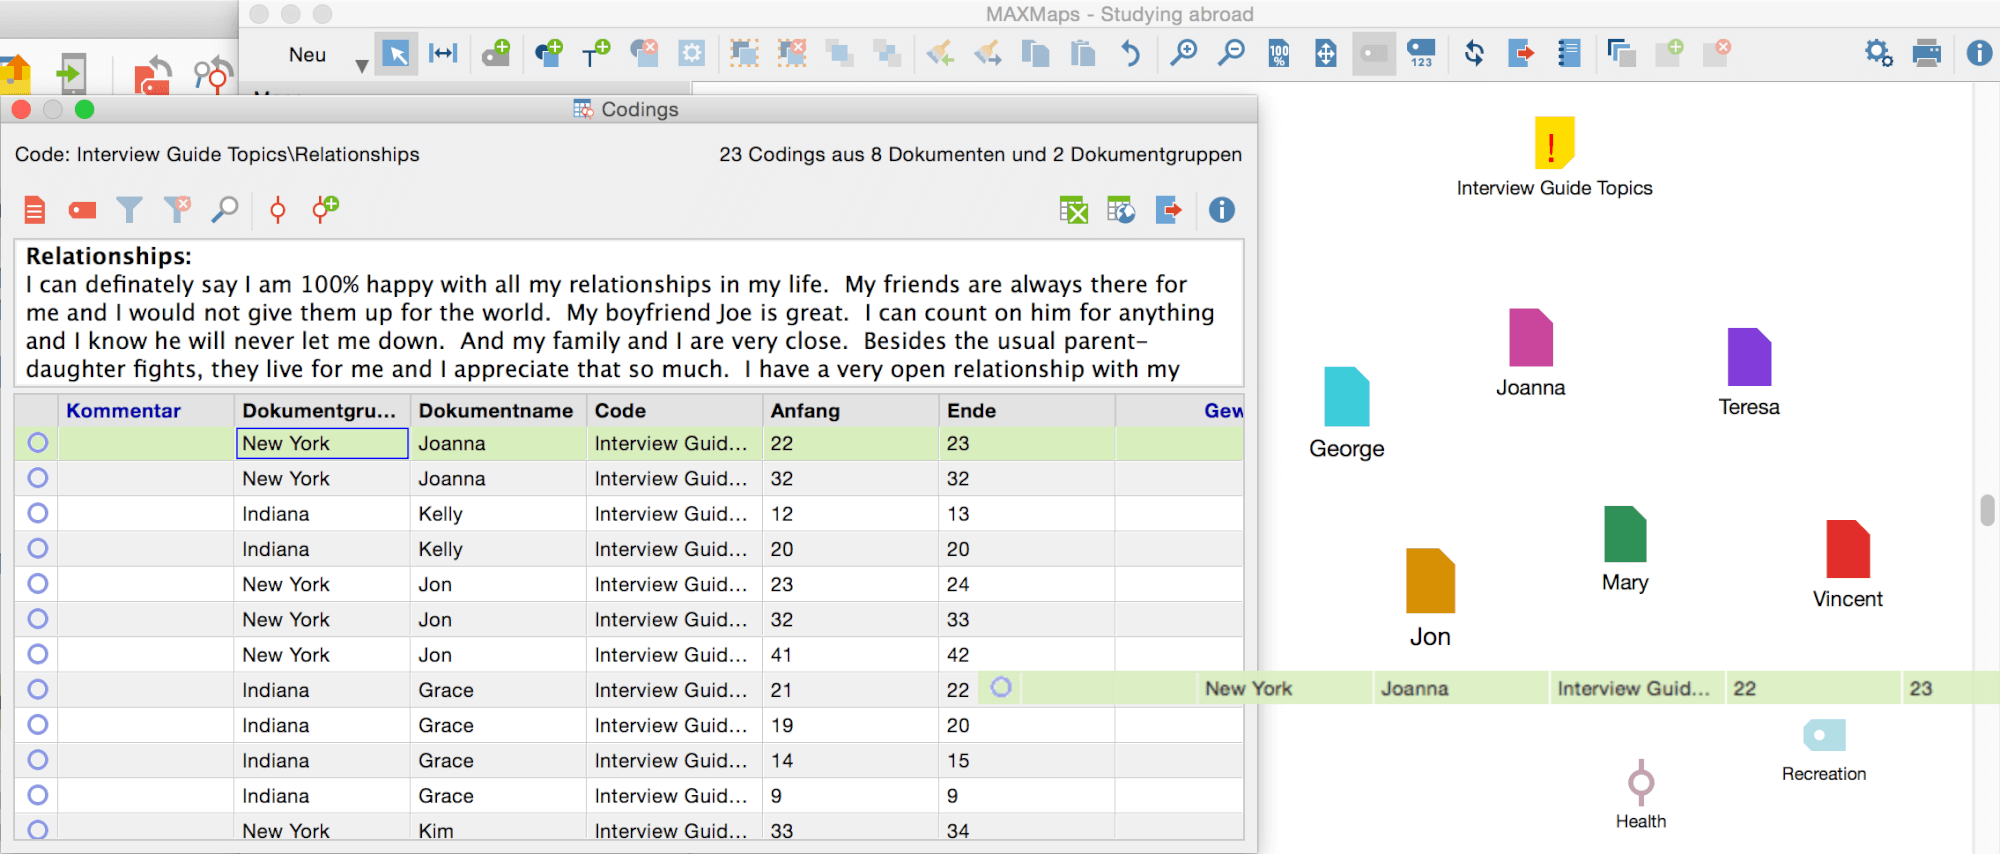
You can drag documents, codes, coded segments, or memos into a map. In this example a memo, a code, a coded segment and several documents have been inserted. Another coded segment is about to be inserted. As you can see the fastest way to do this is to drag the elements onto the Map via Drag & Drop.
Change symbol properties
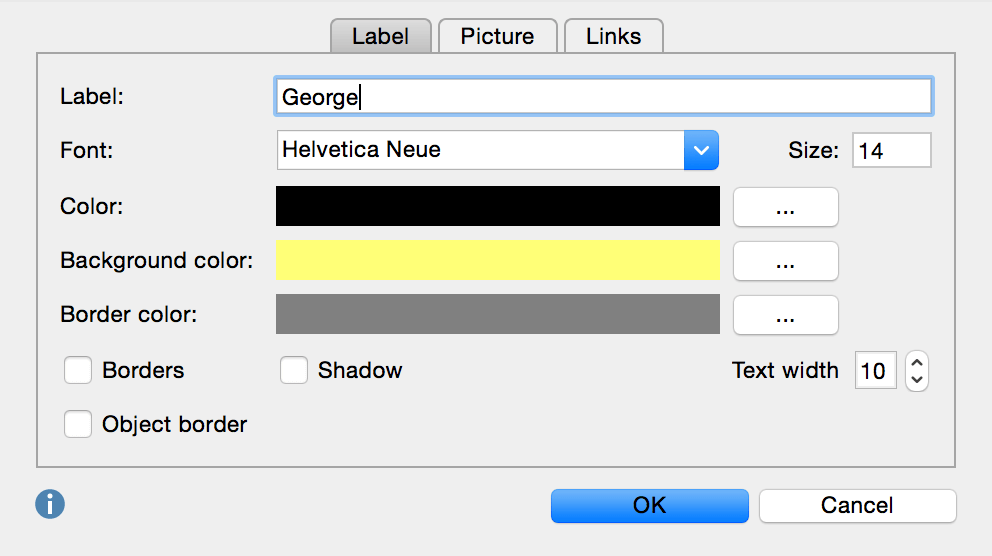
Now you can organize the document symbols by dragging them to the desired location in the MAXMaps window. The document symbols can also be renamed to be more specific. Either double-click or right-click on a document symbol and select Properties. A new window will appear with a section label at the top.
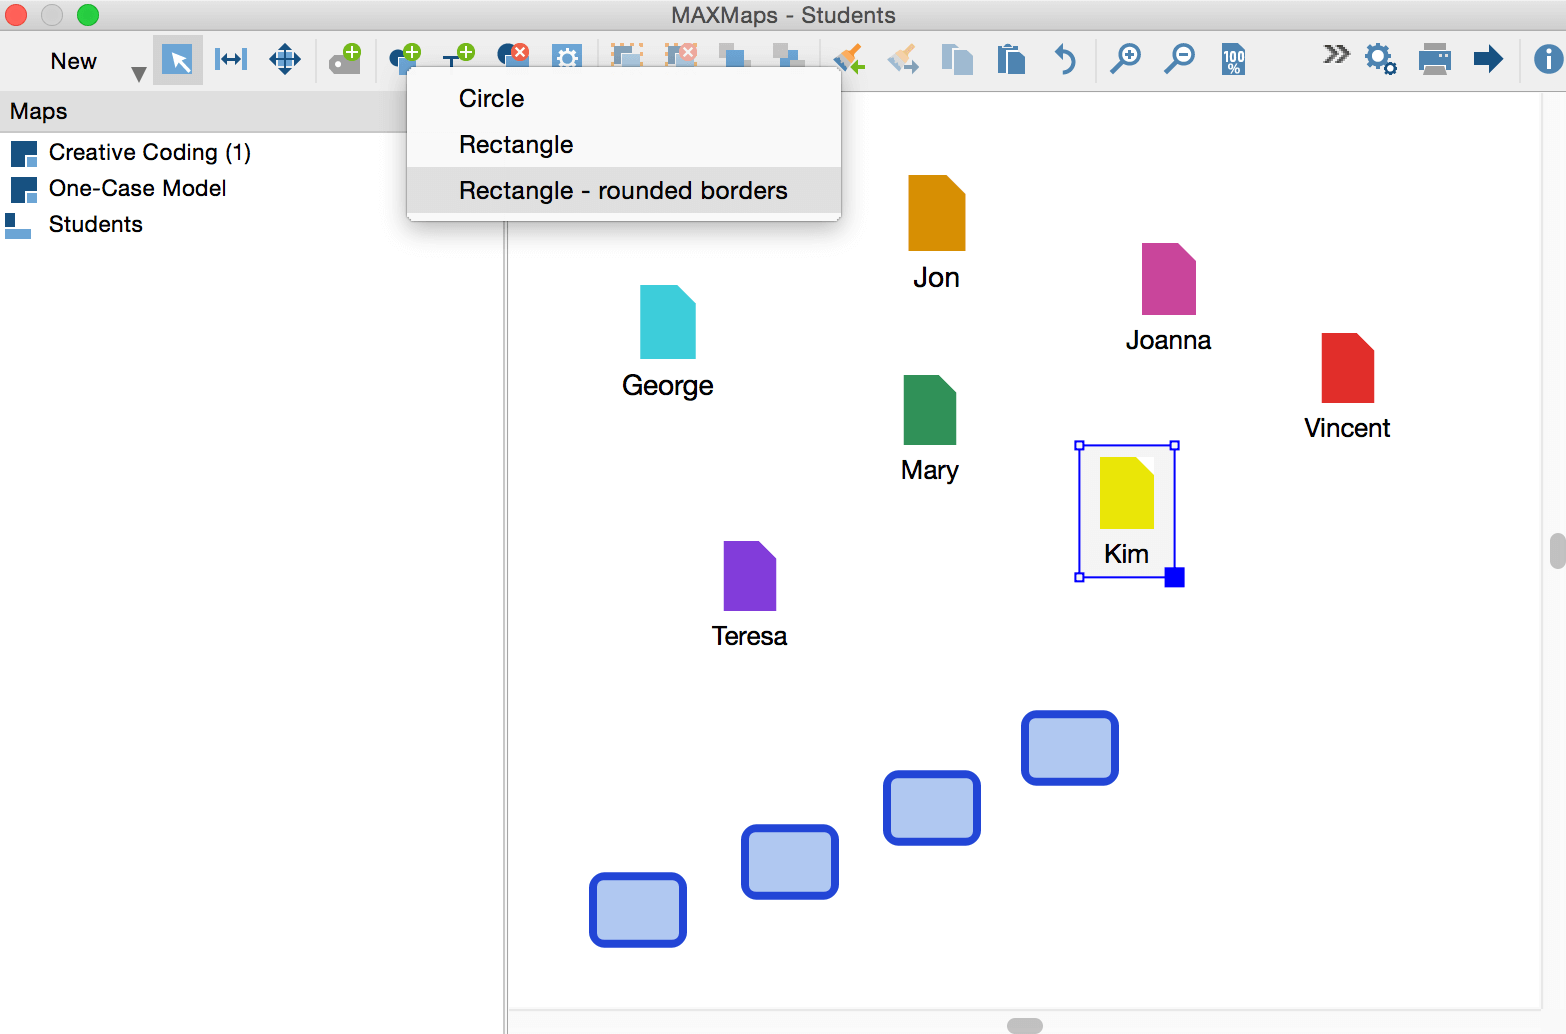
Inserting free objects
In addition to simply visualizing the documents, you could illustrate e.g. the universities that students attended. This is what free symbols are used for in MAXMaps. Enter a few free symbols by clicking on the New Free Object icon ![]() .
.
Tip: It is easier to make your group of documents line up correctly by clicking Map > Options and checking the box Apply grid. The objects will then align themselves to the grid when you drag them to a new location.
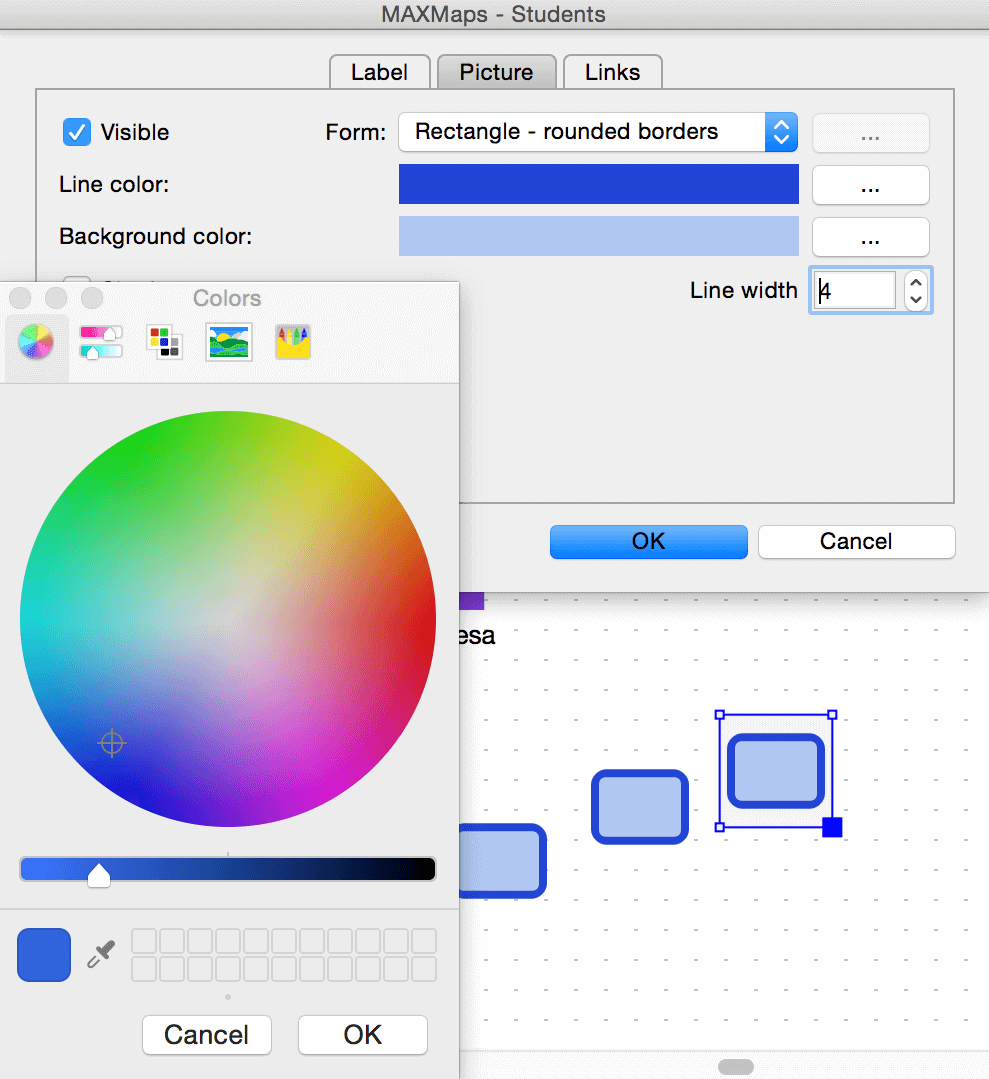
Changing the object color
These new objects should also receive labels, e.g. the names of the universities the students attended or the home country of the students. You may also change the color and size of a free shape in order to illustrate significant meaning (double-click or right click on the object and choose Properties).
Copying formats
To save time, you can copy the format of one object and transfer it to another. To copy a format of an object, you would click on it and click the Copy format icon ![]() . Next click on the object that you want to format and then click the Set format icon
. Next click on the object that you want to format and then click the Set format icon ![]() .
.
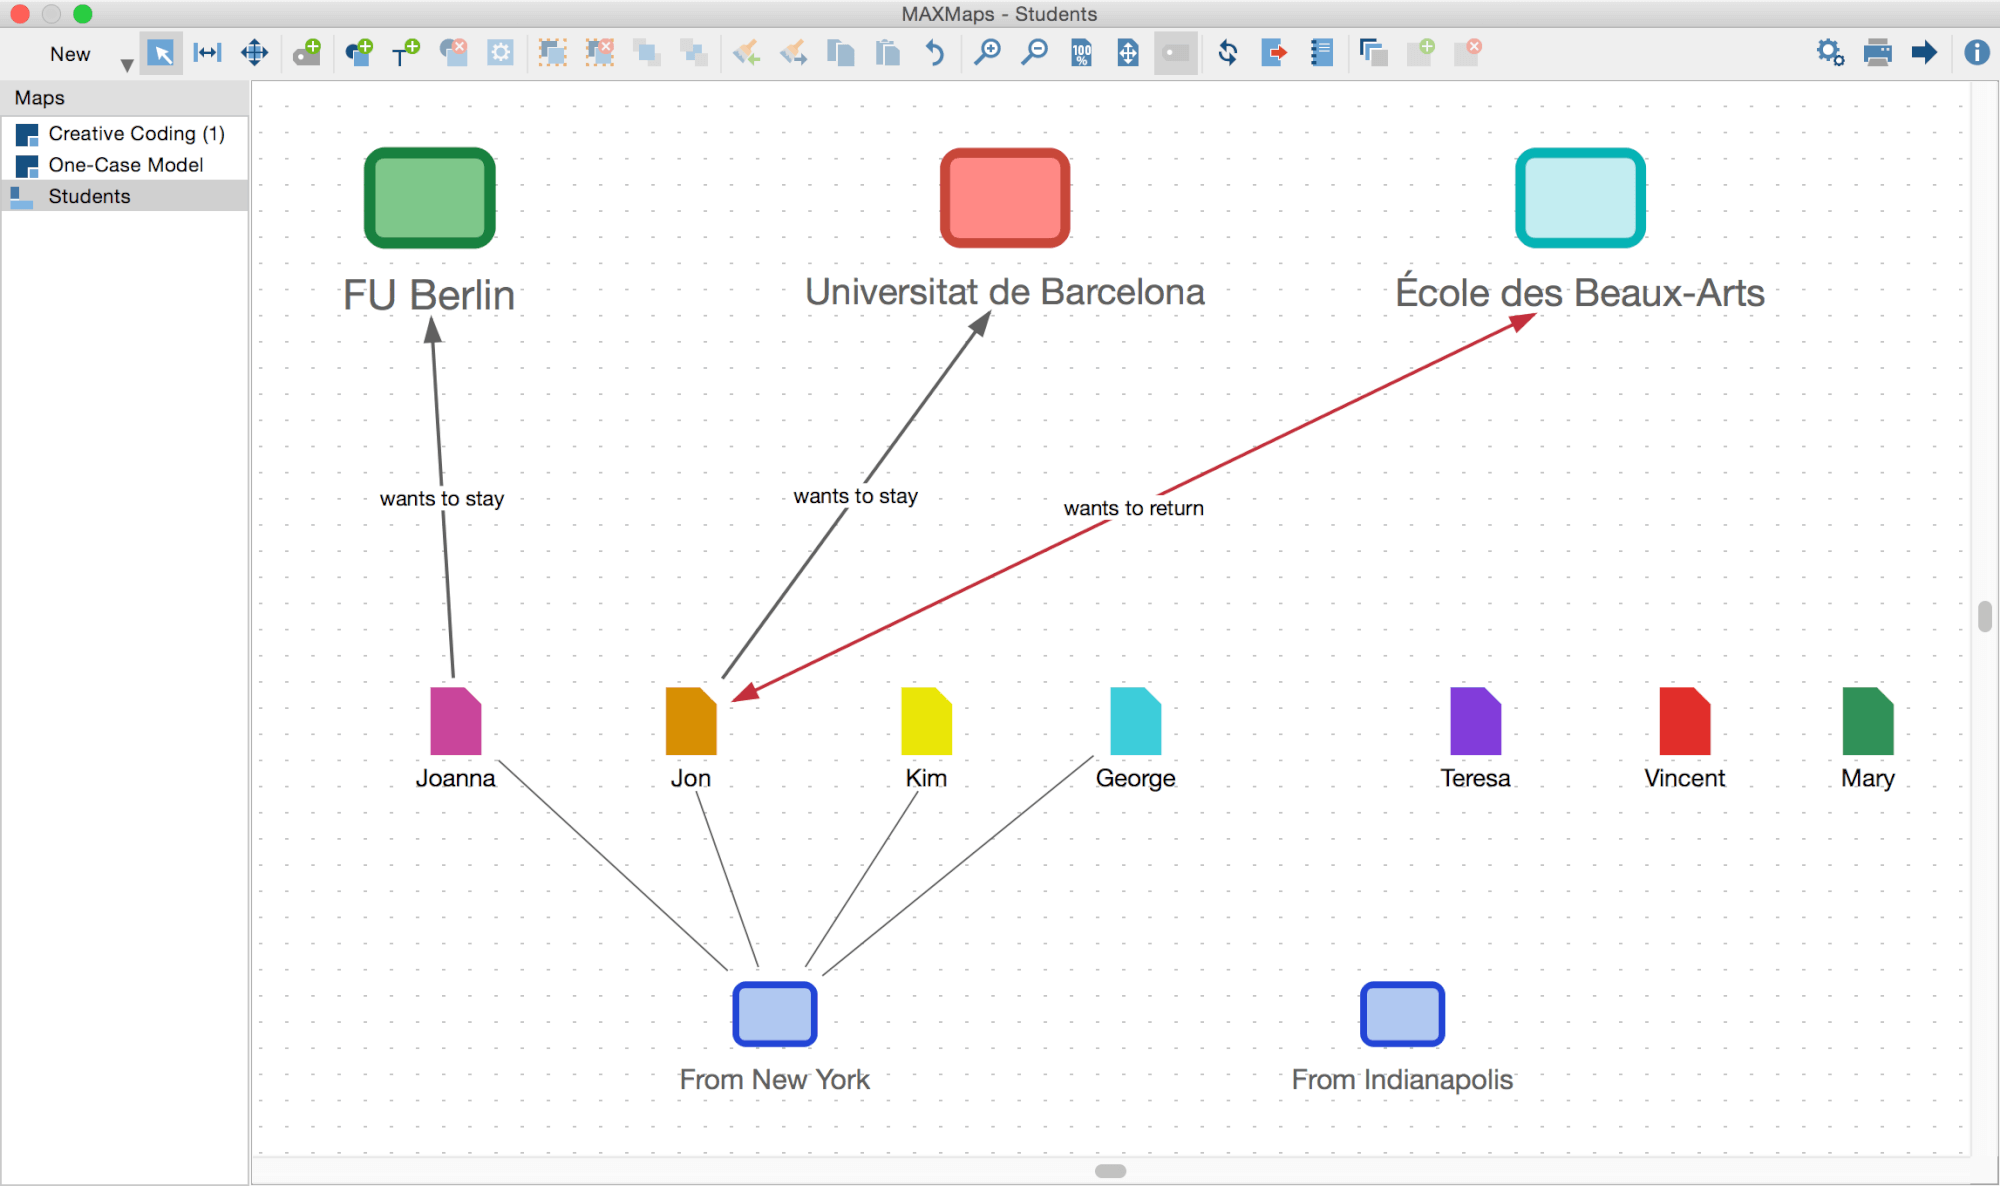
Drawing connecting lines
In this step you will be able to point out possible connections between the documents and free objects via connecting lines. These lines could symbolize e.g. which students went to which university and whether or not they plan to stay there or return to their home country. To insert an arrow switch to the connecting lines mode by clicking Mode > Link. Lines are easily drawn now; just drag the mouse from the initiating object to the targeted one.
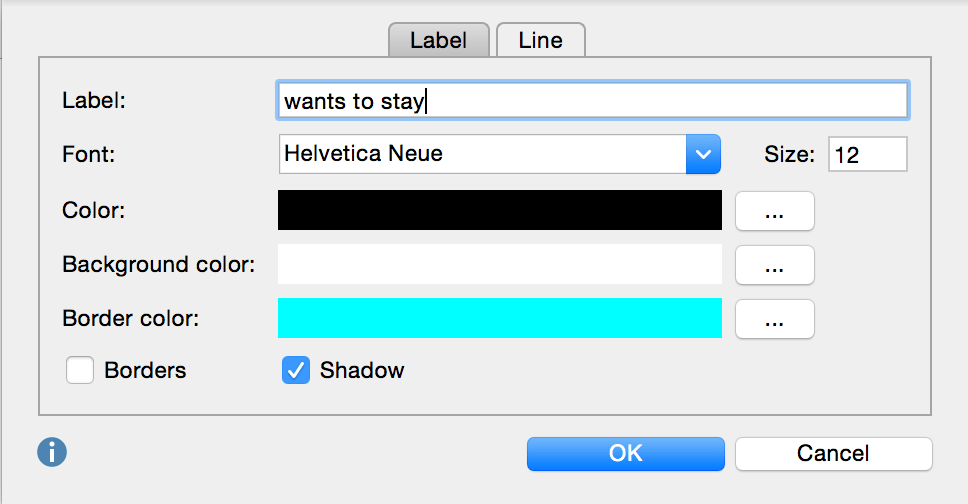
Now change the corresponding description and color, the thickness, arrow, and line of the connection by switching to Select mode in the Mode menu, right-clicking on the corresponding line and selecting Properties.
Tip: Creating new connecting lines or changing the direction of an existing one is only possible if you have switched back to linking mode (Mode > Link).
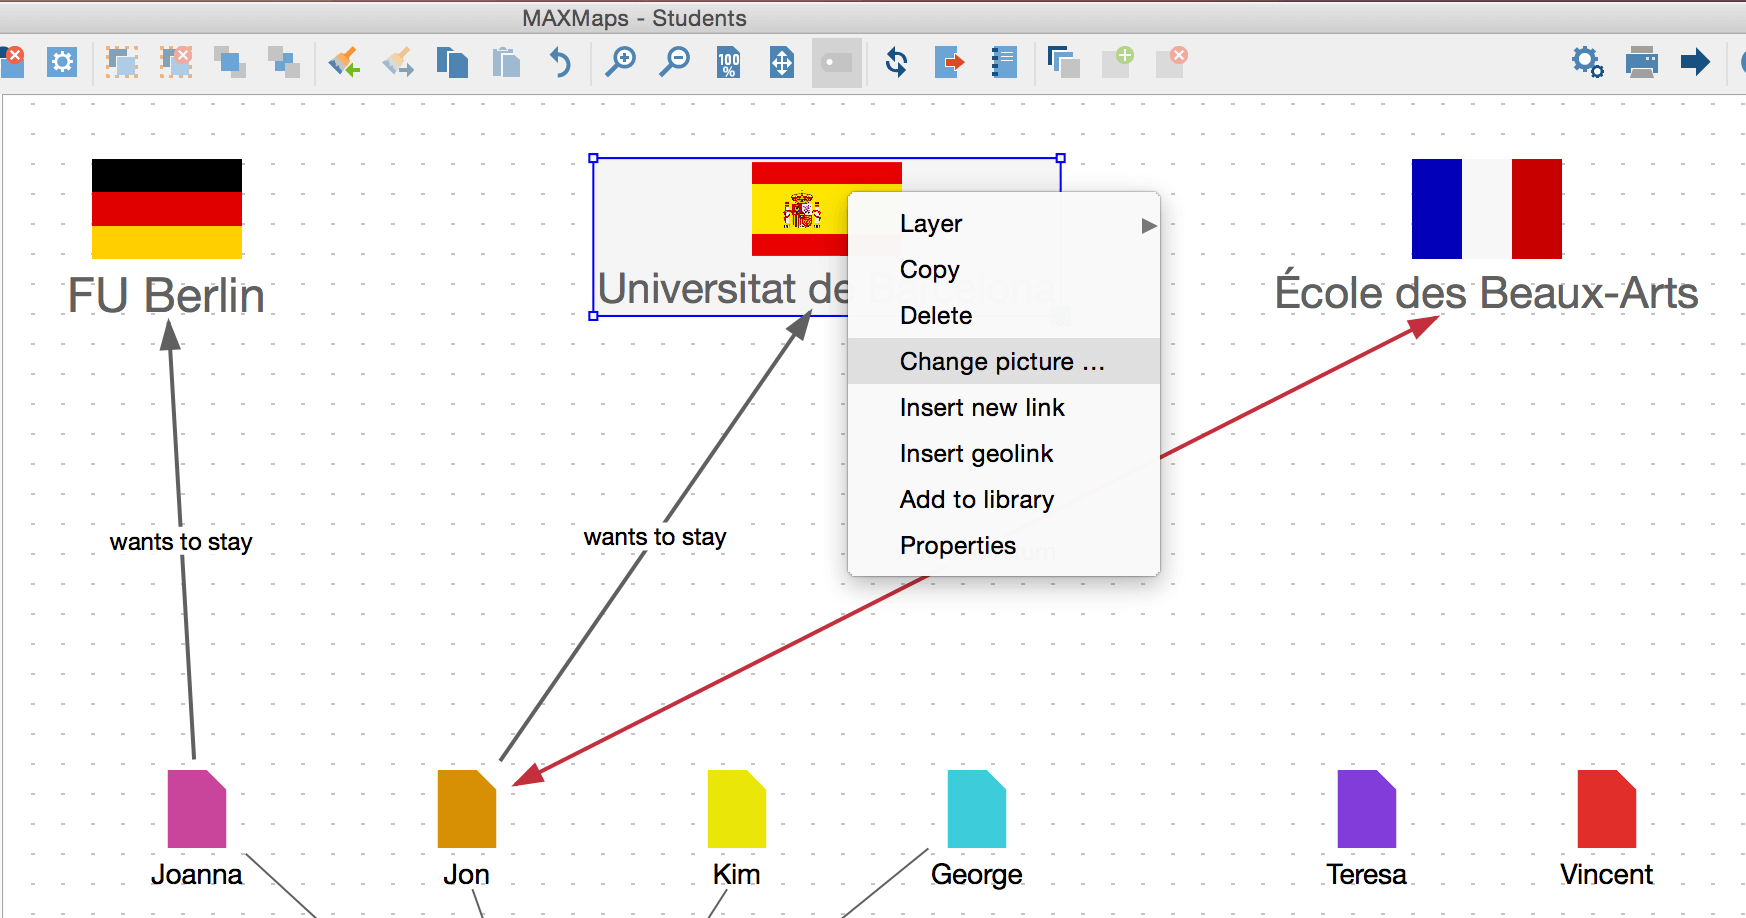
Replacing symbols with pictures
To give your data visualization a more realistic touch you may replace some symbols with pictures of e.g. students or cities. Right-click on the object symbol you want to replace and choose Change picture.