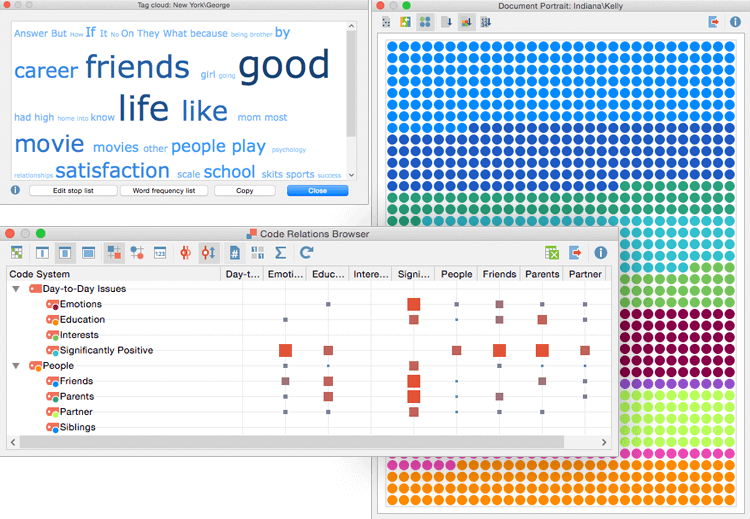
This chapter introduces you to the MAXQDA Visual Tools, which allow for striking presentations. Use them to present results to your audience, to view your data from new angles, or to test and develop theories.
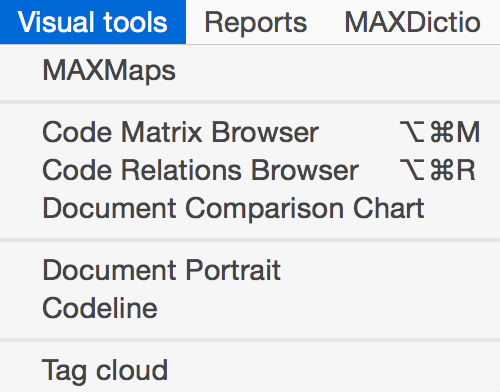
You can start the Visual Tools via the Visual Tools Bar or from the drop-down menu Visual Tools.
If the toolbar is not visible, simply activate it in the drop-down menu “View > Visual Tools”.