The Typology Table is a mixed methods feature in which you can combine quantitative data and your codes or categorical variables. It is called a Typology Table, because it is able to calculate various variables and their percentages (means, standard deviations, etc.) for qualitative typologies.
In the next two dialog windows you can select which information should be included in the rows and columns of your typology table.
Row Variables
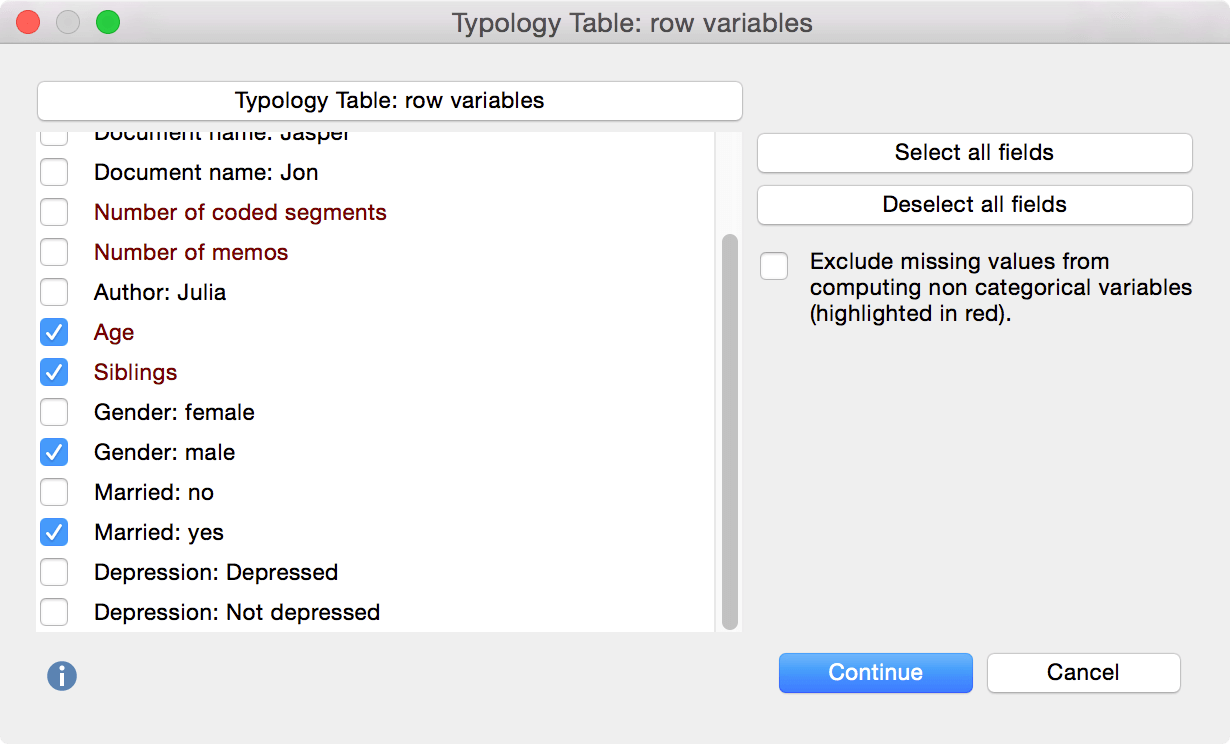
In the first window you can select which data should be displayed in each of the rows. For this example we want to include the mean age and number of siblings for each interviewee. We also want to know which percentage of the two groups is male and married. Click “Continue” to move on to the next window.
Column Variables
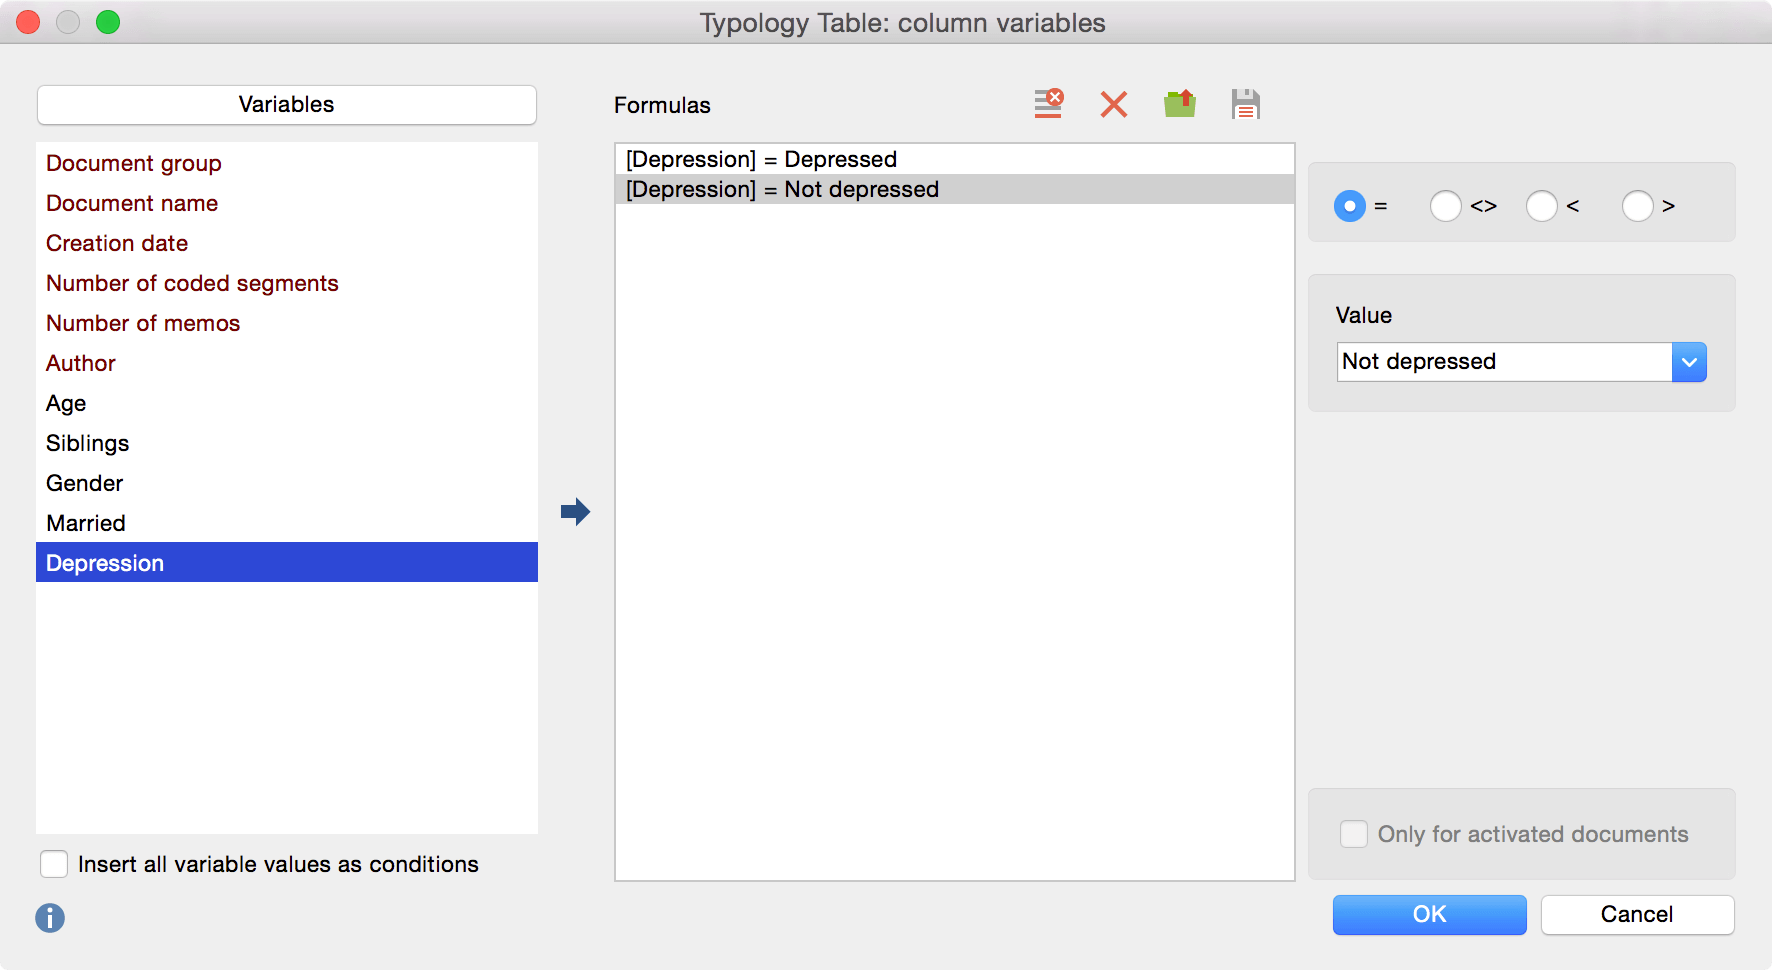
Now you can select the column variables for the Typology Table. In this example we want to split our participants by the variable “Depression”. Select a variable and click the arrow button to move a variable from the left side to the right and pick a value for each variable once. Click “OK” to create your Typology Table.
Typology Table
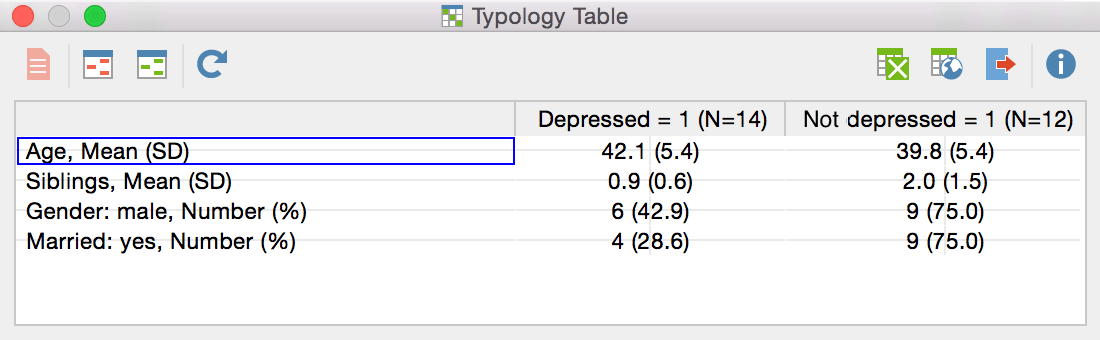
The resulting Typology Table shows a comparison between two types of patients, “Depressed” patients (14 persons) and “Not Depressed” patients (12 persons). Those types build the columns of the table and could have been the result of prior analysis and coding of the material and a subsequent transformation of the respective codes into document variables.
In the first two rows of the table the mean age and number of siblings are indicated for both groups and the standard deviation is given in parentheses.
So, the mean age of the 14 depressed persons is 42.2 years and the standard deviation 5.4. Non-depressed persons have two siblings on average in this example and here the standard deviation is 1.5.
The subsequent rows “Gender…” and “Married…” present the number of male persons and the number of married persons in both groups and calculate the respective percentage. In our example 6 of 14 depressed persons are male, which corresponds to 42.9 %.