
The Document Map is a visual tool that displays selected documents or focus group speakers as though they were arranged on a map. The more similar two documents are in terms of the codes assigned to them, the closer their circle symbols appear to each other. The less similar they are, the farther apart they appear. You can include document variable values when determining similarity. Documents with similar code assignments and variable values can be marked with matching colors, and the size of the circles can reflect the number of code assignments in each document.
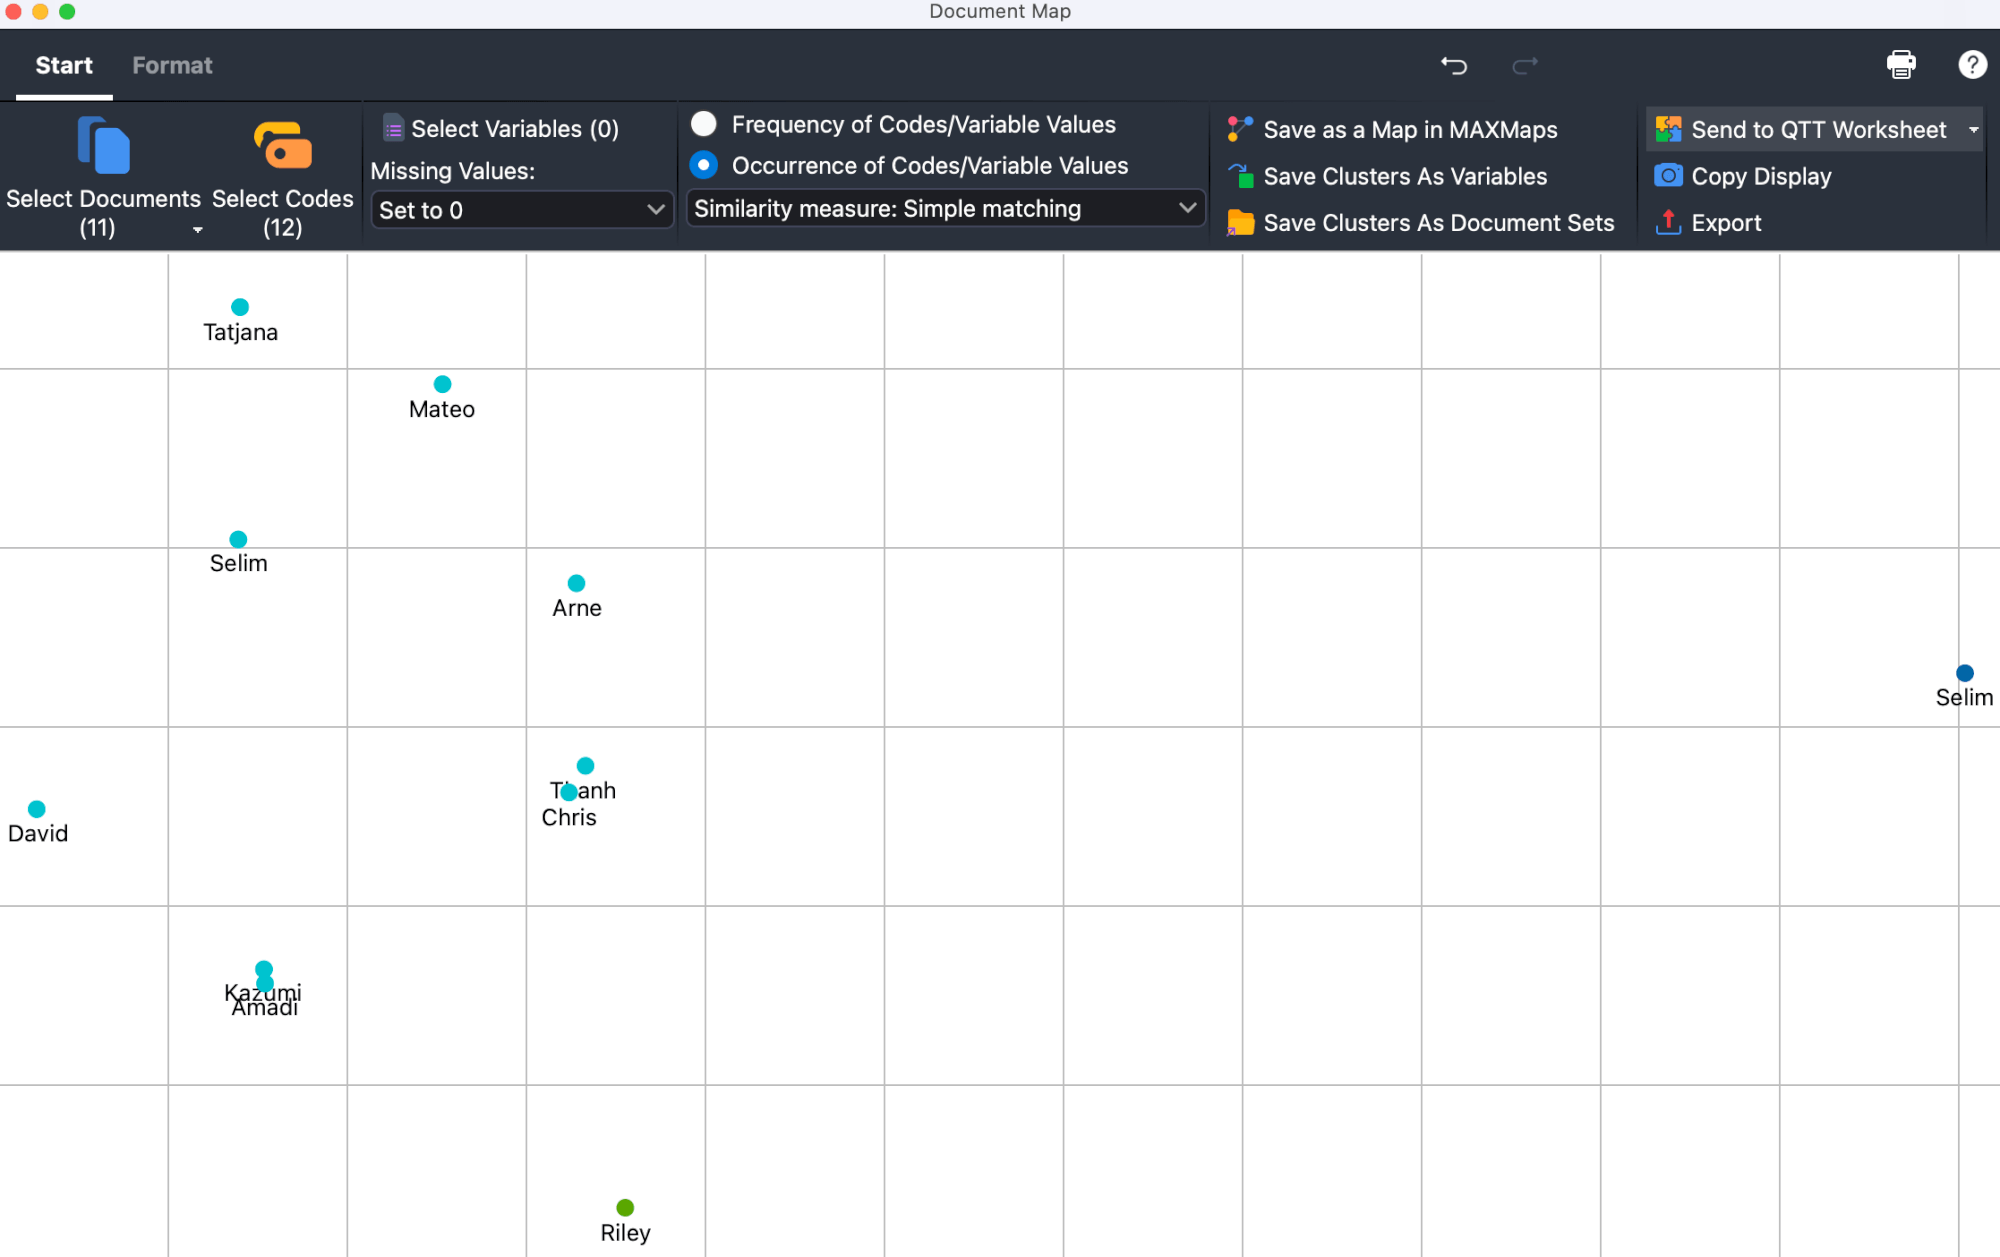
The Document Map is an ideal tool for visually grouping cases (documents) and can serve as a basis for building typologies or exploring identified groups in greater depth.
Generating a Document Map
To generate a Document Map:
- Select Visual Tools > Document Map in the MAXQDA main menu. The Document Map window opens with its own menu. The buttons in the middle of the window and the Start menu offer the same selections.
- In the Document Map window, under Start > Select Documents, select the documents you want to place on the map, or choose Select Speakers to compare focus group speakers instead.
- Under Start > Select Codes, select the codes you want to take into account when determining the similarity. You can select documents and codes in either order.
MAXQDA will now place all the selected documents on the map. The Select Documents and Select Codes buttons in the Start menu show how many documents and codes are selected. Click them again at any time to change the selection.
Comparing focus group speakers
If your project contains focus group transcripts, you can compare their speakers instead of documents. Choose Select Speakers instead of Select Documents. Each speaker then appears on the map in place of a document and is positioned according to the selected codes, just as documents are. A map compares either documents or speakers, not both.
Select the analysis mode
You can choose between two modes in the Start menu to determine the distances between documents:
Frequency of Codes/Variable Values – Takes into account how often a code has been assigned in a document. For example, if the code "Parents" was assigned twice in Document A and three times in Document B, this is treated as a difference.
Occurrence of Codes/Variable Values – Takes into account only whether a code has been assigned to a document at all. In the example above, Documents A and B would be considered identical with regard to the code "Parents" because the code was assigned in both documents. How often it was assigned does not matter in this mode.
Depending on the selected analysis mode, different similarity or distance measures are available. These are described in detail in the Similarity Analysis for Documents page.
If several documents appear in the same position because they were coded identically with regard to the selected analysis mode, MAXQDA displays the number of documents at that position instead of showing a single document. Hover over the position to see the full list of documents.
Taking variable values into account
Click Start > Select Variables to select document variables that should be taken into account when determining similarity, either in addition to or instead of codes. If Frequency of Codes/Variable Values is selected as the analysis mode, you can select variables of the types Integer and Decimal. If Occurrence of Codes/Variable Values is selected, you can select variables of the types Text, Date, and Boolean.
Because some of the selected documents may have missing values for a selected document variable, you can choose how MAXQDA handles these cases:
Missing values: Set to 0 – Sets the missing variable value to 0. This option generally makes sense only when using the Frequency of Codes/Variable Values mode.
Missing values: Exclude Documents – Excludes documents with at least one missing value for the selected variables from the map. The number shown in brackets after this option indicates how many documents are affected and will therefore not appear on the map.
Document Map interactivity
The Document Map is interactive:
- Click a document to select it in the documents window.
- Double-click a document to open it.
- Hover over a document name or icon to display a tooltip showing which of the selected codes have been assigned in that document.
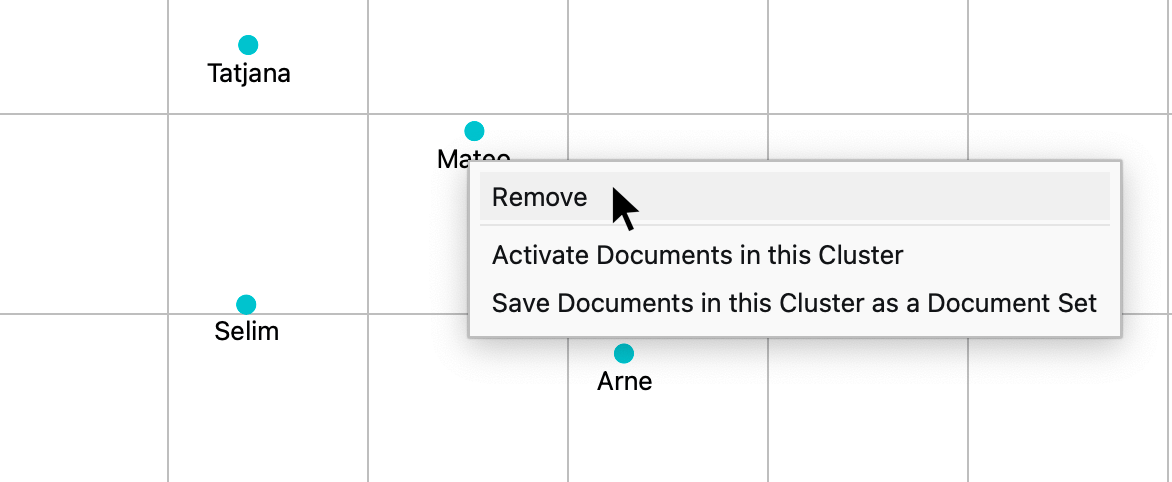
- Right-click a document and choose Remove to remove it from the map. The map is then regenerated using the remaining documents.
- Right-click a document and select Activate Documents in this Cluster to activate only the documents in the selected color cluster in the documents window. This allows you to perform analyses that include only the documents in that cluster. Alternatively, select Save Documents in this Cluster as a Set to save the documents as a new set in the documents window instead of only activating them.
Customizing the display
The Format menu contains several options for adjusting the appearance of the Document Map:

 Number of Codes – Displays, in brackets after the document name, how many of the selected codes occur in the document.
 Size Reflects Number – The more of the analyzed codes that have been assigned in a document, the larger the circle representing that document.
 Font Size Reflects Number – The more of the analyzed codes that have been assigned in a document, the larger the font used for the document name.
 Grid – Turns a grid on or off to help you estimate the relative distances between documents. The grid uses a fixed spacing of 100 pixels. Distances can therefore be compared only within the same map, not between different maps.
Color: Cluster / Document System / Uniform – Specifies how colors are assigned to documents:
- Cluster (map position) – Assigns colors to documents based on their cluster membership. The positions of the documents on the map are used to identify the clusters. The clustering does not use the exact calculated distances based on the selected codes and variables, but only their projection onto the two-dimensional surface. As a result, documents that are farther apart in multidimensional space may still be grouped together. You can specify the number of clusters in the numeric field.
- Cluster (distance matrix) – Recommended for displaying clusters. Documents are assigned colors according to their cluster membership based on the calculated distances between them with regard to the selected codes and variables. Because the map represents these distances on a two-dimensional surface, documents that appear close together may still belong to different clusters. If two documents from different clusters appear in the same position on the map, a black circle is displayed instead of a colored dot. You can specify the number of clusters in the numeric field.
- Document System – Uses the colors assigned to documents.
- Uniform – Assigns the same color to all document symbols.
Comparing and investigating clusters
To assess the similarities between documents within a cluster and the differences between clusters, select Format > Typology Table: Cluster. The Typology Table opens:
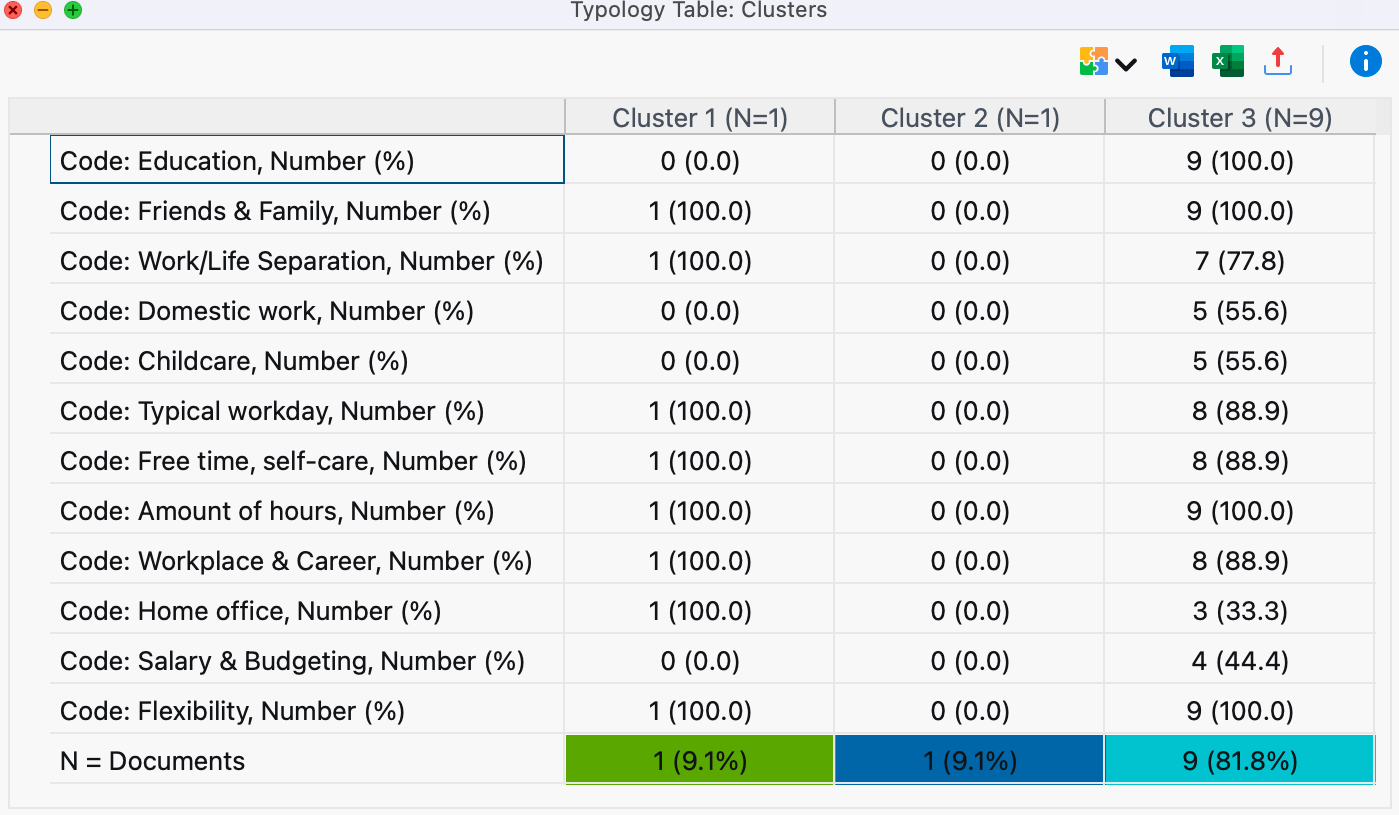
The selected codes and variables are listed in the first column. The remaining columns represent the individual clusters.
In the Occurrence of Codes/Variable Values analysis mode, the Typology Table shows the number of documents in which each code or variable value occurs. In the Frequency of Codes/Variable Values analysis mode, it shows the mean and standard deviation instead.
In the example above, the first cluster contains seven documents, while the other two contain one and two documents, respectively. The first row shows that the code "Grandparents" was assigned an average of 0.4 times in Cluster 1, three times in Cluster 2, and not at all in Cluster 3. The final row shows that the people in Cluster 1 are, on average, 20.4 years old.
The table is interactive. If you change the number of clusters in the Document Map while the Typology Table is open, the number of columns in the table updates automatically.
You can also save each document's cluster assignment as a variable for later use in grouping your data. To do so, select Start > Save Cluster As Variables. The Data Editor for document variables opens with a new column containing the cluster assignments.
Store view in Questions – Themes – Theories
In the Questions – Themes – Theories window, you can collect and comment on important results from your project. In the Start menu, click the  Send to QTT Worksheet icon to save the current view to a new or existing worksheet.
Exporting a Document Map and calculations
The Start menu provides options for exporting and refining the map and its underlying calculations:
 Save as a Map in MAXMaps – Creates a new map in MAXMaps, MAXQDA's tool for creating concept maps, and adds the contents of the Document Map to it. You can then edit the map in MAXMaps.
 Copy Display – Copies a high-resolution image of the map to the clipboard so that you can paste it directly into a report or presentation.
 Export – Saves the display as an image file in PNG or SVG format. If you select Excel (XLSX) as the export format, the calculations are exported as a matrix.
Notes on Document Map calculations and display
Classic multidimensional scaling is used to position the documents on the map.
For this purpose, MAXQDA calculates a distance matrix for the selected documents when using the Frequency of Codes/Variable Values analysis mode, as described in the Similarity Analysis for Documents page. If Occurrence of Codes/Variable Values is selected, the resulting similarity matrix is first converted into a distance matrix. Because similarity values range from 0 to 1, each similarity value is subtracted from 1 to calculate the corresponding distance.
A distance of 0 means that two documents are identical with regard to the occurrence or frequency of the selected codes and the variable values taken into account.
Because the data is reduced to a maximum of two dimensions and document positions are projected onto a single plane, two documents may appear visually closer together than the underlying distance matrix would suggest.
If Color: Cluster (map position) is selected, documents are clustered and colored using hierarchical cluster analysis based on their positions on the two-dimensional surface. If Color: Cluster (distance matrix) is selected, clustering is based on the underlying distance matrix. Unweighted average linkage is used as the clustering method.
If Size Reflects Number is enabled, symbol sizes are determined using the same principle as in a Code Map.
