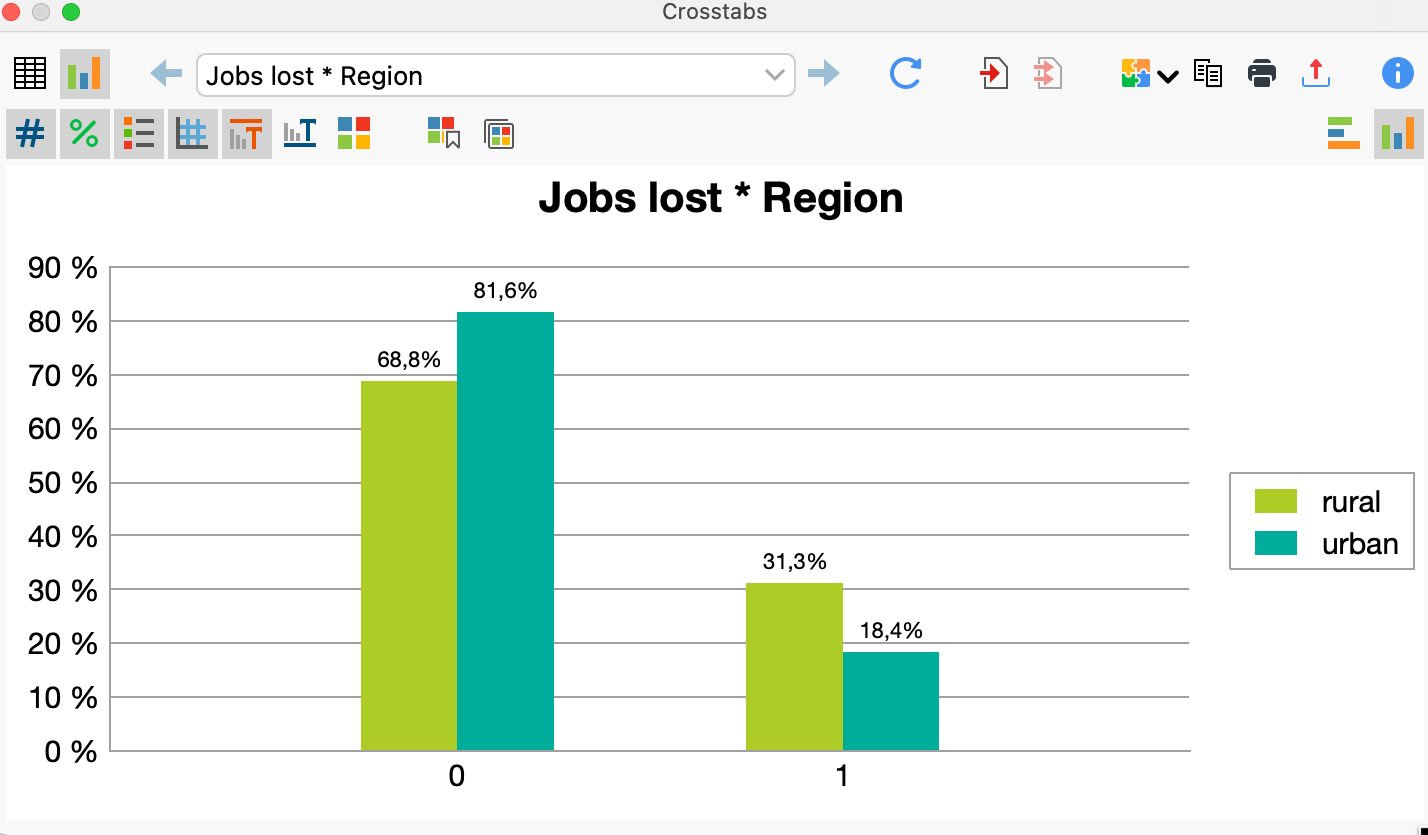
After categorizing responses to open-ended questions using the Survey Analysis workspace, you can perform statistical analyses in MAXQDA Stats using the resulting code frequencies. This allows you to explore relationships between your qualitative categories and quantitative data. For example, you can compare whether a category was assigned more frequently to certain groups of respondents than to others.

The grouped bar chart above displays the frequency for the code "Jobs lost" (0 or 1) divided by the document variable "region" (rural vs. urban), showing how responses differ across geographic areas.
Launching MAXQDA Stats from the Survey Analysis workspace
You can launch MAXQDA Stats directly from the Survey Analysis workspace: In the workspace's main menu, click Analyze in Stats. Then, MAXQDA Stats opens with the relevant data from your survey available for statistical analysis.

What data is available in Stats
The data available in MAXQDA Stats depends on how you opened the Survey Analysis workspace:
When analyzing a complete survey
If you opened the Survey Analysis workspace for an entire survey (from the "Document System" or by dragging a survey into the dialog), MAXQDA Stats opens with:
- Documents: All documents from the survey
- If Only activated documents is enabled in the workspace, only the currently activated documents from the survey are included
- Variables: All closed-ended question variables (document variables) from the survey, plus system variables
- Codes: All open-ended question codes from the survey
When analyzing a single code
If you opened the Survey Analysis workspace for a single code (by dragging a code into the dialog), MAXQDA Stats opens with:
- Documents: All documents in the project
- If Only activated documents is enabled in the workspace, only the currently activated documents from the entire project are included
- Variables: All document variables from the entire project
- Codes: All codes from the entire project
