The Code Map is a visual tool that illustrates relationships between co-occurring codes in your qualitative data. It helps you understand how different codes are related by showing their proximity on a map.
The closer two codes appear on the map, the more similar they are or the more frequently they co-occur. This visualization can help you identify patterns and themes in your data.
How to create a Code Map
To open the Code Map workspace, select Visual Tools > Code Map in the MAXQDA main menu.

The Code Map window opens with two menus: Start and Format.


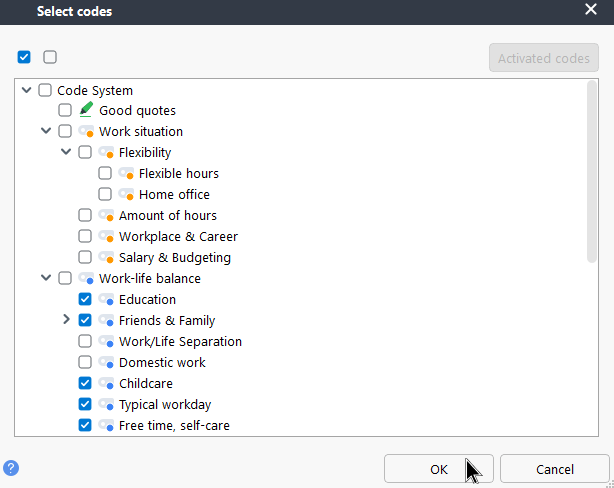
To choose the codes for your map, click  Select Codes in the Start menu. In an empty map, the Select Codes button in the middle of the window does the same. After the map has been generated, click Select Codes in the Start menu again to add more codes.
A dialog opens where you can choose which codes to include. You must select at least three codes. When you are ready, click OK.
MAXQDA immediately processes your data and generates a Code Map using the selected codes.
- If a selected code is not related to any other selected code, it is excluded from the map.
- Multiple codes can appear in the same position if they have identical similarities to the other codes.
Filtering documents for targeted analysis
To examine code relationships within specific documents, activate the documents you want to include in the documents window. Then select  Only Activated Documents in the Start menu. The map updates accordingly. If no documents are activated in your project, this option is grayed out.
How similarity between codes is measured
You can define how similarity between codes on the Code Map is calculated. In the Start menu, choose one of three types of co-occurrence analysis:
- Intersection of codes in a segment — This is the default analysis type. It counts how often two codes have been assigned to the same segment. The coded segments only need to overlap; they do not need to cover exactly the same area.
- Proximity of codes in the same document — Counts how often two codes are assigned within a specified distance of each other in the same document or media file. You can define the maximum distance in paragraphs for text, rows for tables, or seconds for media files.
- Occurrence of codes in the same document — Counts the number of documents in which both codes occur. Their positions within the document are irrelevant; each code only needs to have been assigned at least once.
When you select a different analysis type, the map regenerates automatically.
Understanding the map
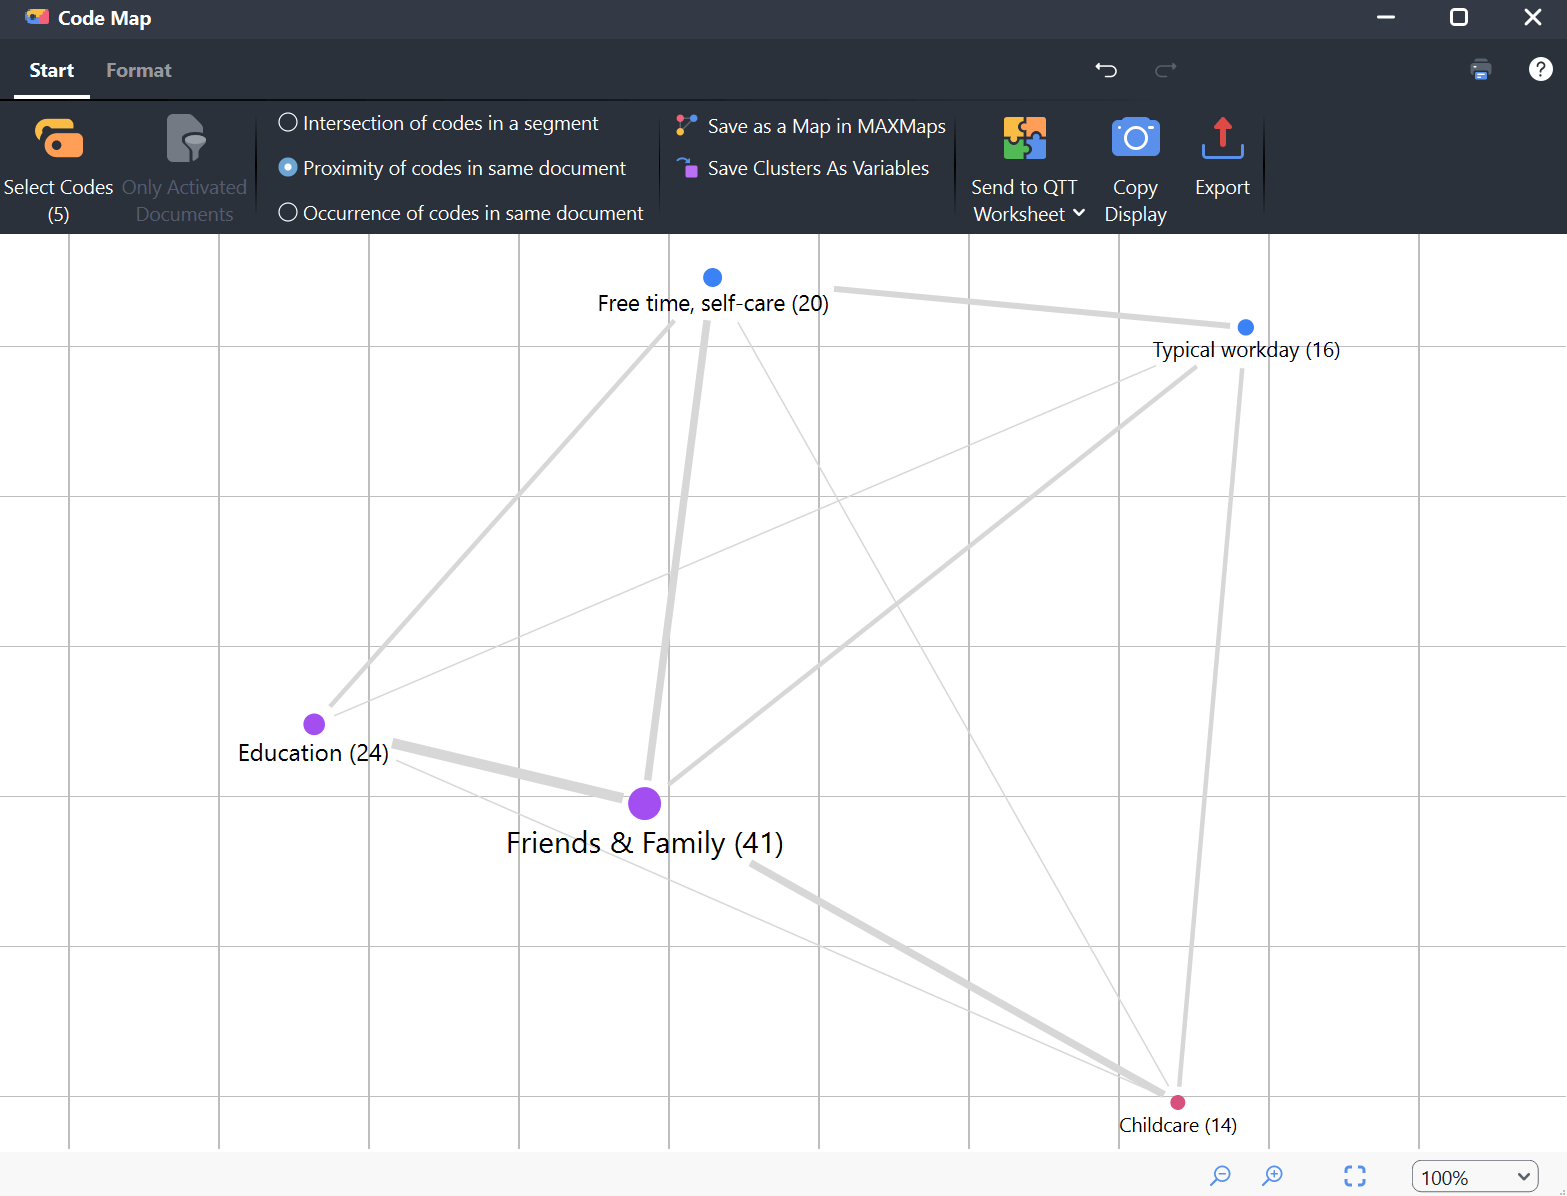
When the Code Map is generated, each selected code is represented by a circular node labeled with the code name.
Hover over a node to see whether it represents a subcode or a parent code. For subcodes, the tooltip also displays the name of the parent code or codes.
The distance between nodes indicates the similarity of how the codes are applied to the data. Nodes that are closer together indicate greater similarity or more frequent co-occurrence.
Right-click a code and select Remove to remove it from the map. The map then regenerates using the remaining codes.
Navigating the Code Map

 Zoom in/out — Use these icons to zoom in or out on the map.
 Fit to screen — Adjusts the zoom level and centers the map in the available area so that the entire map is visible.
Customizing the node display
You can adjust how nodes are displayed in the Format menu:
 Number of Codes — Displays, in parentheses next to each code name, how often the code occurs in the documents included in the analysis.
 Size Reflects Number — Adjusts node size according to code frequency. More frequently assigned codes are represented by larger nodes.
 Font Size Reflects Number — Adjusts the font size of node labels according to code frequency. More frequently assigned codes are displayed with larger labels.
 Grid — Shows or hides a grid that helps you estimate the relative distances between codes. The grid uses a fixed spacing of 100 pixels, so distances can be compared only within the same map, not between different maps.
 Show Relations as Lines — Displays connecting lines between related nodes. You can further customize the lines by:
- Setting the minimum co-occurrence frequency required for a line to be displayed.
- Choosing whether line width reflects the co-occurrence frequency.
- Choosing whether the frequency is displayed along each connecting line.
Color — Determines how colors are assigned to nodes:
- Cluster (map position) — Assigns colors to nodes based on their cluster membership. Clusters are determined by the positions of the nodes on the map rather than by the exact distances between the codes in multidimensional space. As a result, codes that are farther apart in the underlying data may still be grouped together if their nodes appear close together on the map. You can specify the number of clusters in the numeric field.
- Cluster (distance matrix) — Recommended for displaying clusters. Nodes are colored according to clusters determined from the calculated distances between the codes. Nodes that appear close together on the map may therefore have different colors if they belong to different clusters in the underlying data. If two nodes from different clusters appear in exactly the same position, a black node is displayed instead of a colored one. You can specify the number of clusters in the numeric field.
- Code System — Uses the code colors assigned in the codes window.
- Uniform — Assigns the same color to all nodes.
You can save clusters as variables. Click Save clusters as variables in the Start menu. The cluster assignment for each code is saved as a variable for later use. The Data Editor for code variables opens with a new column containing the cluster assignments.
Adjusting node label fonts
In the Format menu, you can customize the appearance of the node labels. You can:
- Choose a font, for example to match the formatting of your report.
- Apply bold, italic, or underline formatting to the labels.
Exporting a Code Map
Save a Code Map in Questions – Themes – Theories
In Questions – Themes – Theories, you can collect and comment on important results from your project. Click the  Send to QTT Worksheet in the Start menu to save the current view to a new or existing worksheet.
Continue working in MAXMaps
You can continue working with a Code Map in MAXQDA's concept-mapping tool, MAXMaps. To do so, select  Save as map in MAXMaps. MAXQDA adds the map to MAXMaps, where you can continue modeling it later via Visual Tools > MAXMaps.
Export the map
 Copy Display — Copies a high-resolution image of the map to the clipboard so that you can paste it directly into a report or presentation.
 Export — Saves the map as an image file in PNG or SVG format. If you select Excel (XLSX) as the export format, the file also includes all calculated values: the similarity matrix, distance matrix, and coordinates.
 Print — Prints the map directly.
Opening a Code Map from the Code Relations Browser
When you use the Code Relations Browser in MAXQDA, the software generates a matrix showing how codes co-occur. Because this analysis also forms the basis of the Code Map, you can create a Code Map directly from the Code Relations Browser window.
To do so, run a code relations analysis and click the  Code Map icon on the far left of the output window, as shown below:
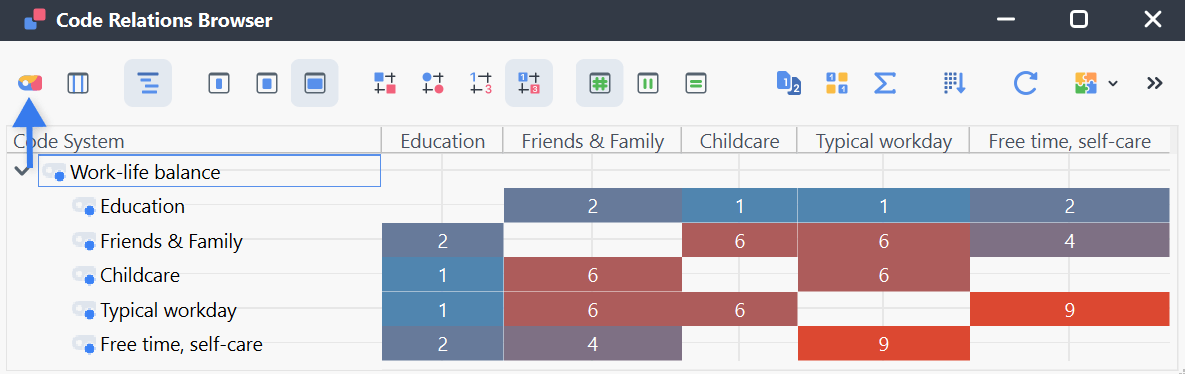
MAXQDA creates a Code Map containing all codes shown in the rows and columns of the Code Relations Browser that co-occur with at least one other displayed code.
- When generating a Code Map from a Code Relations Browser output, you cannot change the analysis type used in the Code Relations Browser.
- Collapsed codes in the Code Relations Browser are not aggregated. Instead, all subcodes are considered individually.
Notes on the analysis process and display
MAXQDA uses classic multidimensional scaling to position the codes on the map.
First, MAXQDA calculates a similarity matrix based on the Code Relations Browser display and then converts it into a distance matrix. To perform this conversion, MAXQDA first calculates the sum of each column to determine how often each code occurs together with any other code. The largest of these column sums is defined as the maximum possible similarity. For each cell, the similarity between the two codes is then subtracted from this maximum.
A distance of 0 therefore means that two codes always occur together and never without each other. A distance equal to the maximum means that the two codes never occur together. Because the results are reduced to a maximum of two dimensions and projected onto a single plane, two codes may appear visually closer together than the underlying distance matrix would suggest.
If Color: Cluster (map position) is selected, the codes are clustered and colored using hierarchical cluster analysis based on their positions on the two-dimensional surface. If Color: Cluster (distance matrix) is selected, clustering is based on the underlying distance matrix. Unweighted average linkage is used as the clustering method.
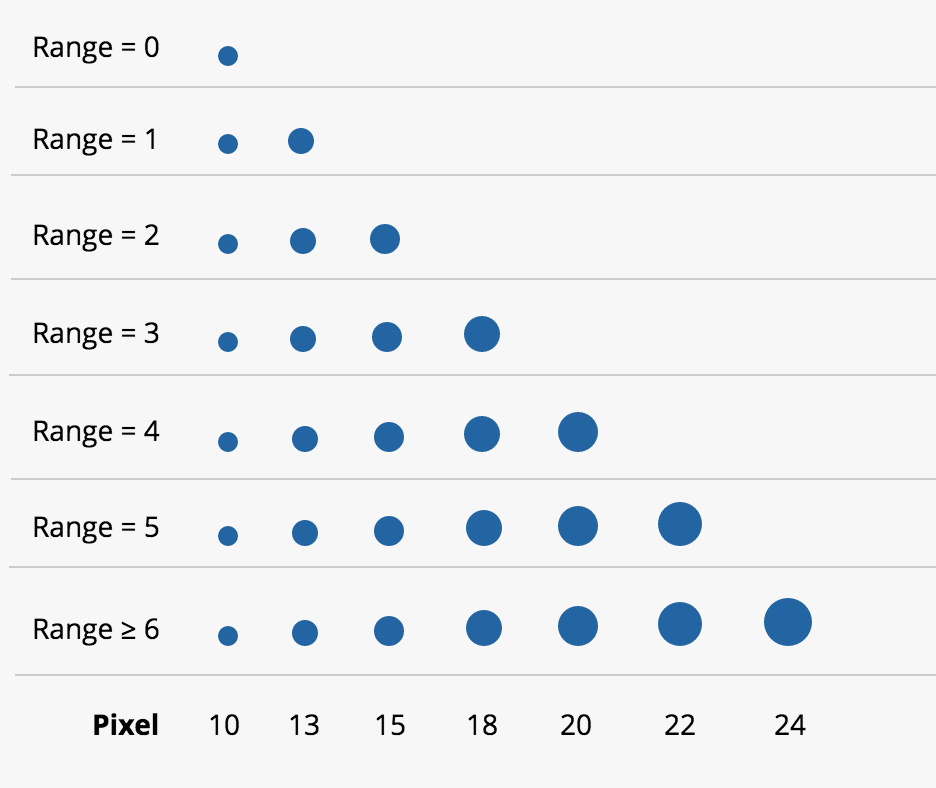
If Size Reflects Number is enabled, node sizes are calculated using a principle similar to that used in the Code Matrix Browser and Code Relations Browser. MAXQDA identifies the smallest and largest code frequencies among all displayed nodes and divides the difference between these values into seven equally sized ranges. The smallest range corresponds to the smallest node size, while the largest range corresponds to the largest node size.
The overall range of the displayed code frequencies is also taken into account. For example, if the displayed codes occur only once or twice, the difference between the minimum and maximum values is very small. MAXQDA therefore uses two medium-sized nodes rather than the smallest and largest node sizes so that the difference is not visually exaggerated.
The following image shows which node sizes are used for different ranges between the smallest and largest displayed values. For example, if the smallest displayed value is 5 and the largest is 8, the range is 8 − 5 = 3. Nodes with a value of 5 are assigned the smallest node size from the row for Range = 3, while nodes with a value of 8 are assigned the largest node size from that row. If all displayed values are identical (Range = 0), all nodes are displayed at a medium size.