This page discusses how to use the Survey Analysis workspace to analyze and categorize responses to qualitative survey questions. For an introduction to the workspace itself, including how to start the Survey Analysis process, visit the "The Survey Analysis Workspace" page. Alternatively, for instructions on how to work with quantitative questions visit "Quantitative Survey Analysis"
Using the qualitative workspace
The qualitative survey analysis workspace is divided into three main sections, as displayed before:
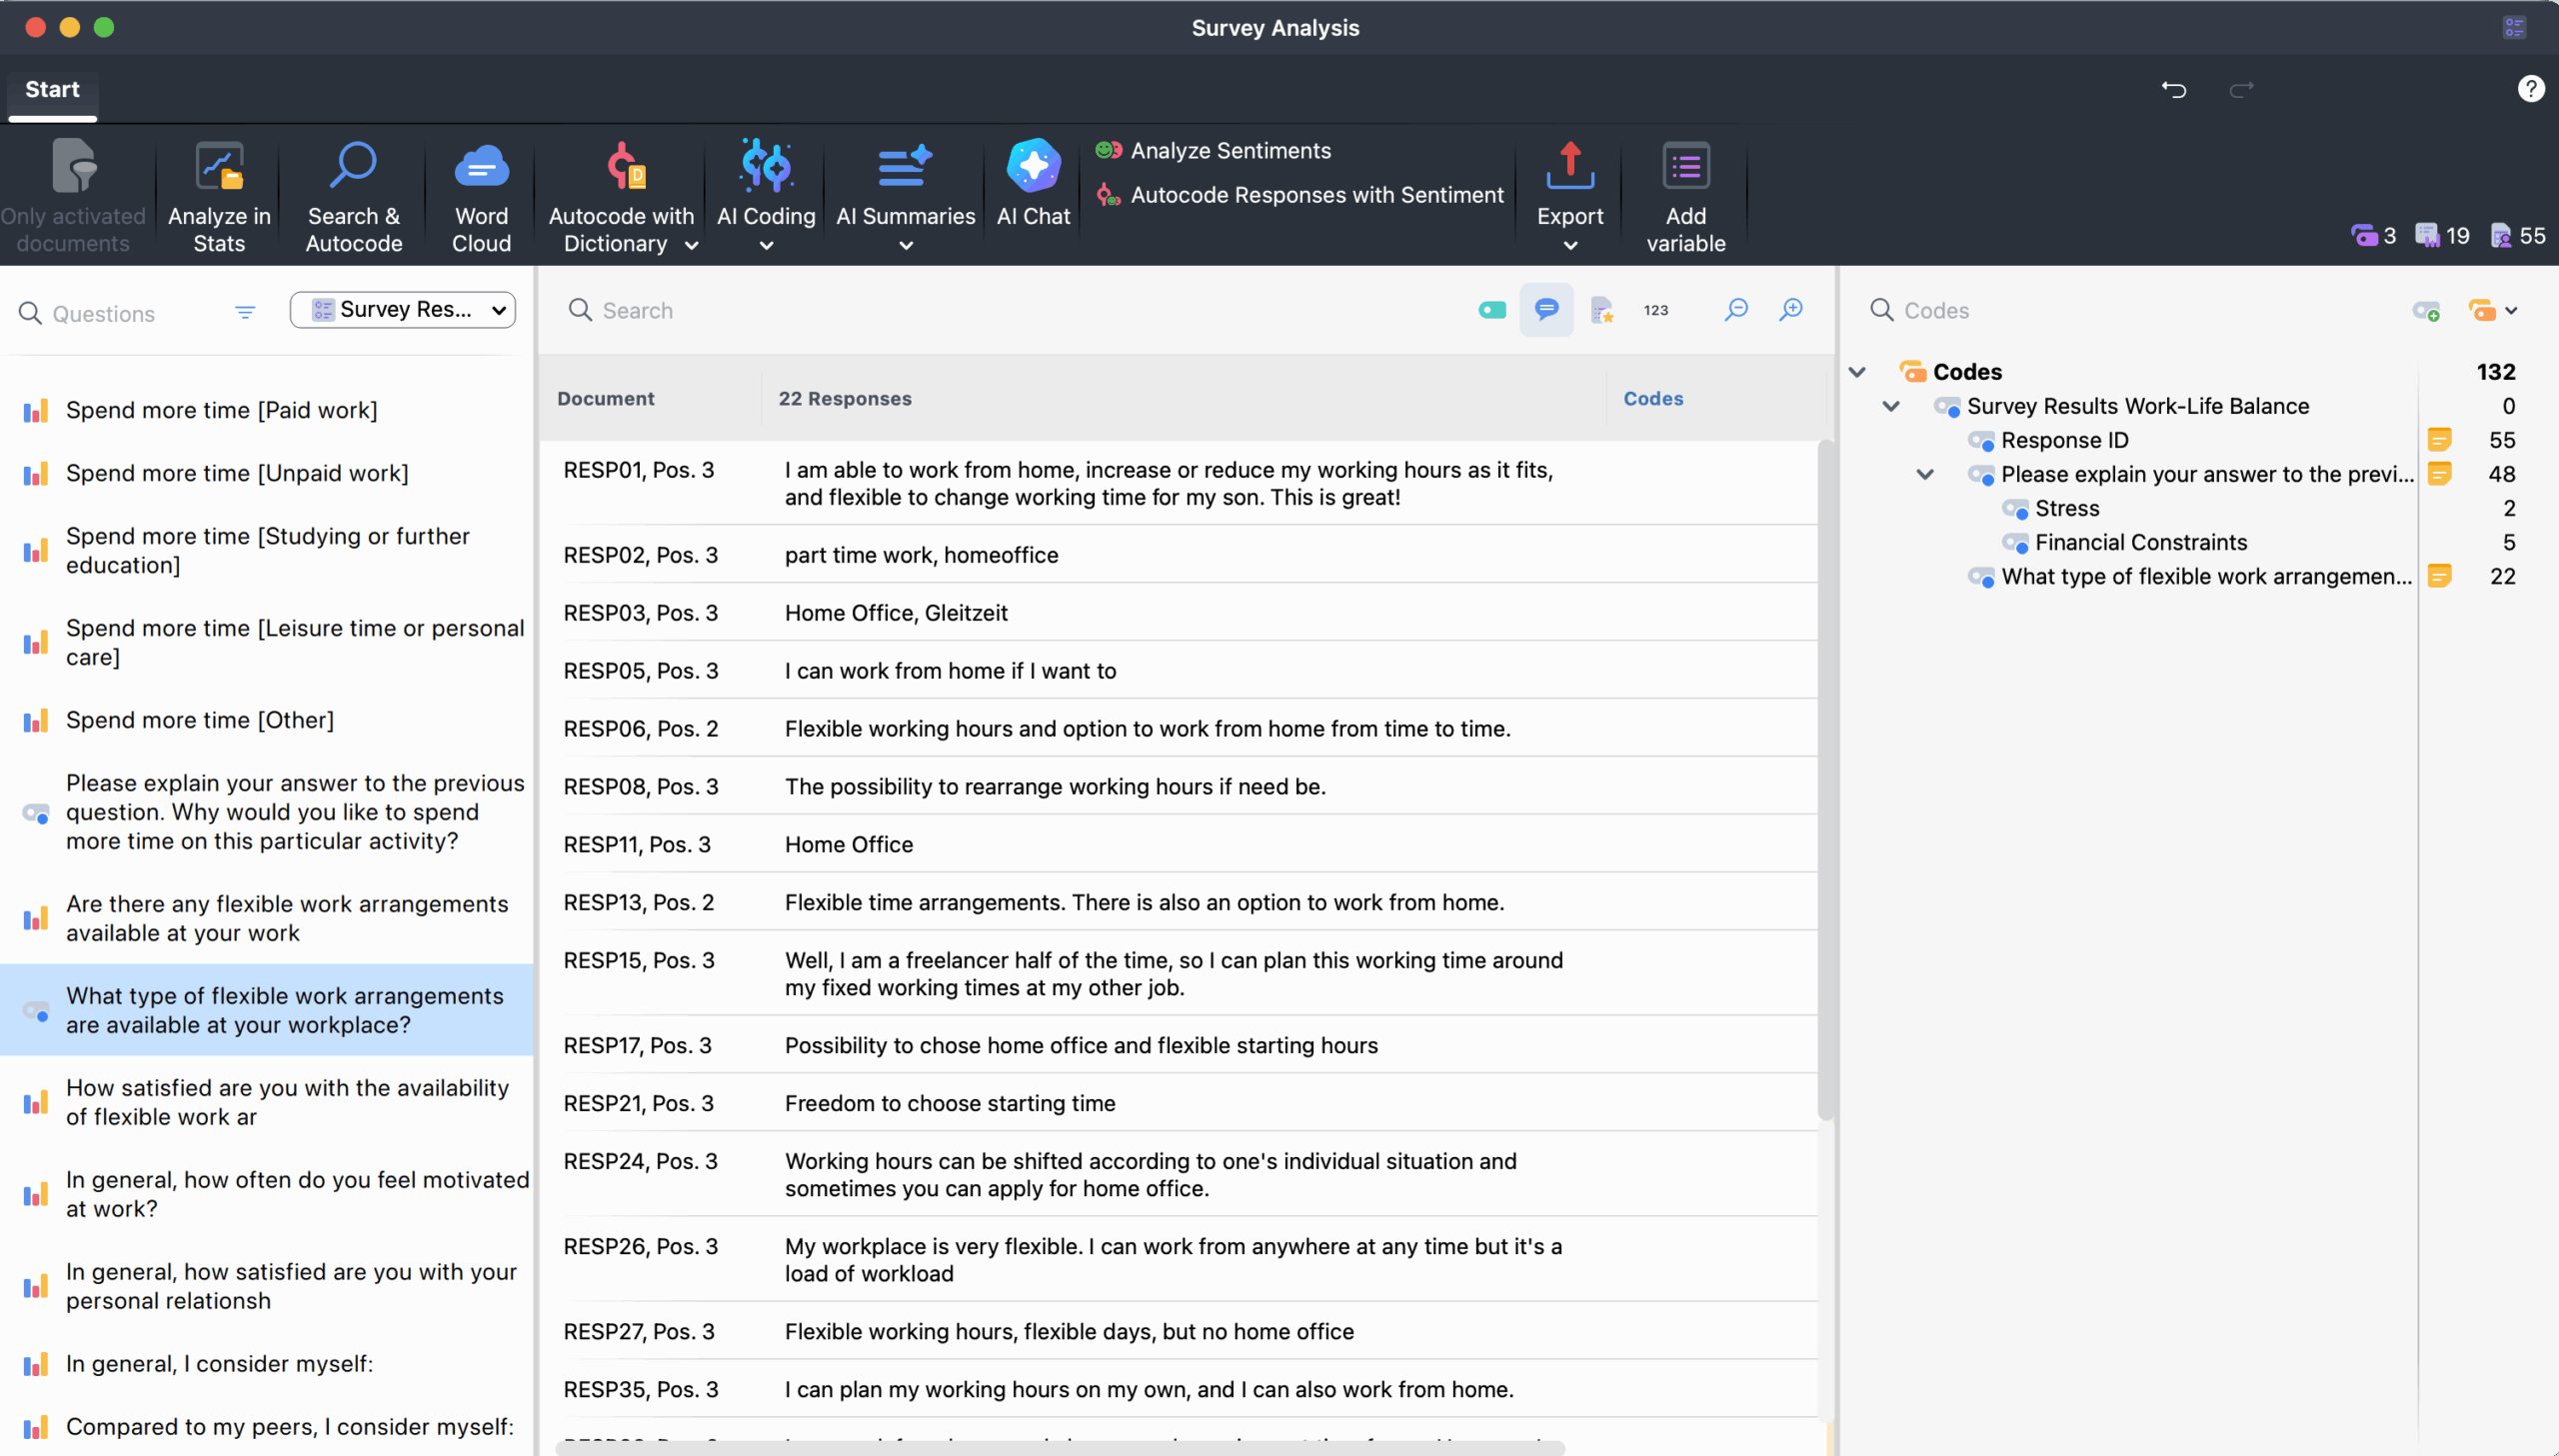
- The "Question Browser" (left panel)
Displays all survey questions. The currently selected question is highlighted in the "Question Browser" so you always know which question you are analyzing. For information about how to navigate it, check out the previous page. - Response table (middle panel)
Lists all responses to the selected question. Each response appears as one row. The column header indicates the number of responses for the currently selected question. - The "Code system" (right panel)
Displays the selected question codes and allows you to create categories as subcodes for organizing responses. You will work with this panel when assigning and organizing categories in the sections below.
Analyzing qualitative questions (Open-ended Responses)
To start analyzing responses, click on a qualitative question in the "Question Browser" to open the interactive table containing all responses to the selected question. This table facilitates the categorization and analysis of the displayed responses.
Navigating the response table
The table acts as the central categorization and analysis workspace for qualitative questions. It includes the following three core columns and information:
- Document – Displays the document name corresponding to a response.
- Responses – Survey respondent answers (only text-based ones). The column header indicates the number of responses for the selected survey question.
- Codes – Lists codes assigned to that specific response (or a part of the response) in addition to the question’s code (which is not displayed here). Only the codes that are currently visible in the code system on the right side of the Survey Analysis workspace are listed here.
Additional table options
The table toolbar includes several tools you can use to adjust what information is displayed:
![]() Display Parent Code - Shows each code's parent code in the "Codes" column.
Display Parent Code - Shows each code's parent code in the "Codes" column.
![]() Display Comments - Adds a "Comments" column to the table. See the "Working with comments" section later on this page for more details.
Display Comments - Adds a "Comments" column to the table. See the "Working with comments" section later on this page for more details.
![]() Display Favorite Variables - Adds a column for each variable you have marked as a favorite.
Display Favorite Variables - Adds a column for each variable you have marked as a favorite.
![]() Display Word Count - Adds a column that shows the word count for each response.
Display Word Count - Adds a column that shows the word count for each response.
![]()
![]() Zoom Out / Zoom In - Adjusts the display size of the table so you can see more (or fewer) details at once.
Zoom Out / Zoom In - Adjusts the display size of the table so you can see more (or fewer) details at once.
Like all MAXQDA tables, the individual fields can be adjusted:
- The columns can be adjusted in width and position with the cursor or hidden with a right-click on a column heading.
- A click on the heading sorts the column in ascending order, another click in descending order.
Once you are familiar with the response table layout and display options, you can begin grouping responses into meaningful categories.
Categorizing survey responses
The panel on the right displays your "Code System." By default, it shows only "Survey Codes." When you click the ![]() Codes icon, you can switch between viewing "All Codes" and "Favorite Codes."
Codes icon, you can switch between viewing "All Codes" and "Favorite Codes."
To categorize individual responses, you need to have categories (subcodes) available. If you already created these categories as subcodes of the question code, you can use them right away. If you created them elsewhere in your "Code System," switch to "All Codes," then drag and drop the relevant codes under the question code to organize them appropriately.
Creating new categories
If you have not defined categories yet, you can create new ones directly while reviewing the responses.
- Click the green plus symbol that appears when you hover over an existing code.

- In the dialog window that appears, enter the code name. To distinguish between different subcodes, you can assign different colors. You can also enter a description of the new code (i.e., when it should be applied) in the “Code memo” field.
- Click Additional code to create a second or third code, and so on. Click OK to finish creating new codes.
If you have not defined any categories at the start of your analysis and prefer to develop them based on the data, you can read through several responses first and then create suitable subcodes.
Assigning categories
To assign a response to a code, click and drag the row containing the response onto a code in the code tree. The assigned code will then appear in the "Codes" column. To code only part of a response, double-click the response, select the relevant section, and drag it to a code in the code system. Even if you code multiple sections of the same response with the same code, the code name will only appear once in the "Codes" column.

Deleting category assignments
To remove a code from a response, hover over the code in the "Codes" column and click the red delete icon that appears. This removes all instances of that code from the response.

Customizing your category system
The Survey Analysis "Code/Category System" behaves exactly like the one in the main window. For example, among others, you can:
- Create and delete codes
- Drag to reorder codes and subcodes
- Create or edit a code memo
- Right-click on a code to access more options
Any changes you make to your codes in the Survey Analysis workspace, are automatically applied everywhere, including your main Code System.
You can adjust your codes/categories throughout the qualitative analysis process.
Click a code in the code tree to display all coded segments within that category (the categorized answers to the survey question or parts of it). This provides an overview of the content in each category. The highlighted row in the code system on the left shows which code is currently selected, and the name of the selected code also appears in the header of the response list.
Working with comments
The "Comments" column lets you take notes for each response for the displayed code (in this case the open-ended question code). By default, this column is hidden. To display it, click the ![]() Display Comments icon on the response table toolbar.
Display Comments icon on the response table toolbar.
To add or edit a comment, double-click a cell in the "Comments" column, as shown below. Each comment can contain up to 511 characters.