One primary task when working with “Questions – Themes – Theories” (QTT) is to compile your analysis results and findings and insert them into a worksheet. Whether you’re using a Qualitative Study Worksheet or a Mixed Methods Worksheet, you can add content from your MAXQDA project to the appropriate sections, comment on them, draw conclusions, and develop insights and theories.
Adding Contents Using the “Send to QTT Worksheet” Icon
The easiest way to add content to a QTT worksheet is to use the Send to QTT Worksheet icon, which you’ll find throughout MAXQDA in various output windows, features, and right-click context menus:
![]()
When you click this icon, a dropdown menu appears:
- Use one of the first two options to create a new worksheet and insert the current visible content into it
- Use one of the remaining options to insert the current visible content into an existing worksheet (MAXQDA lists all worksheets you have created in the open project)
![]()
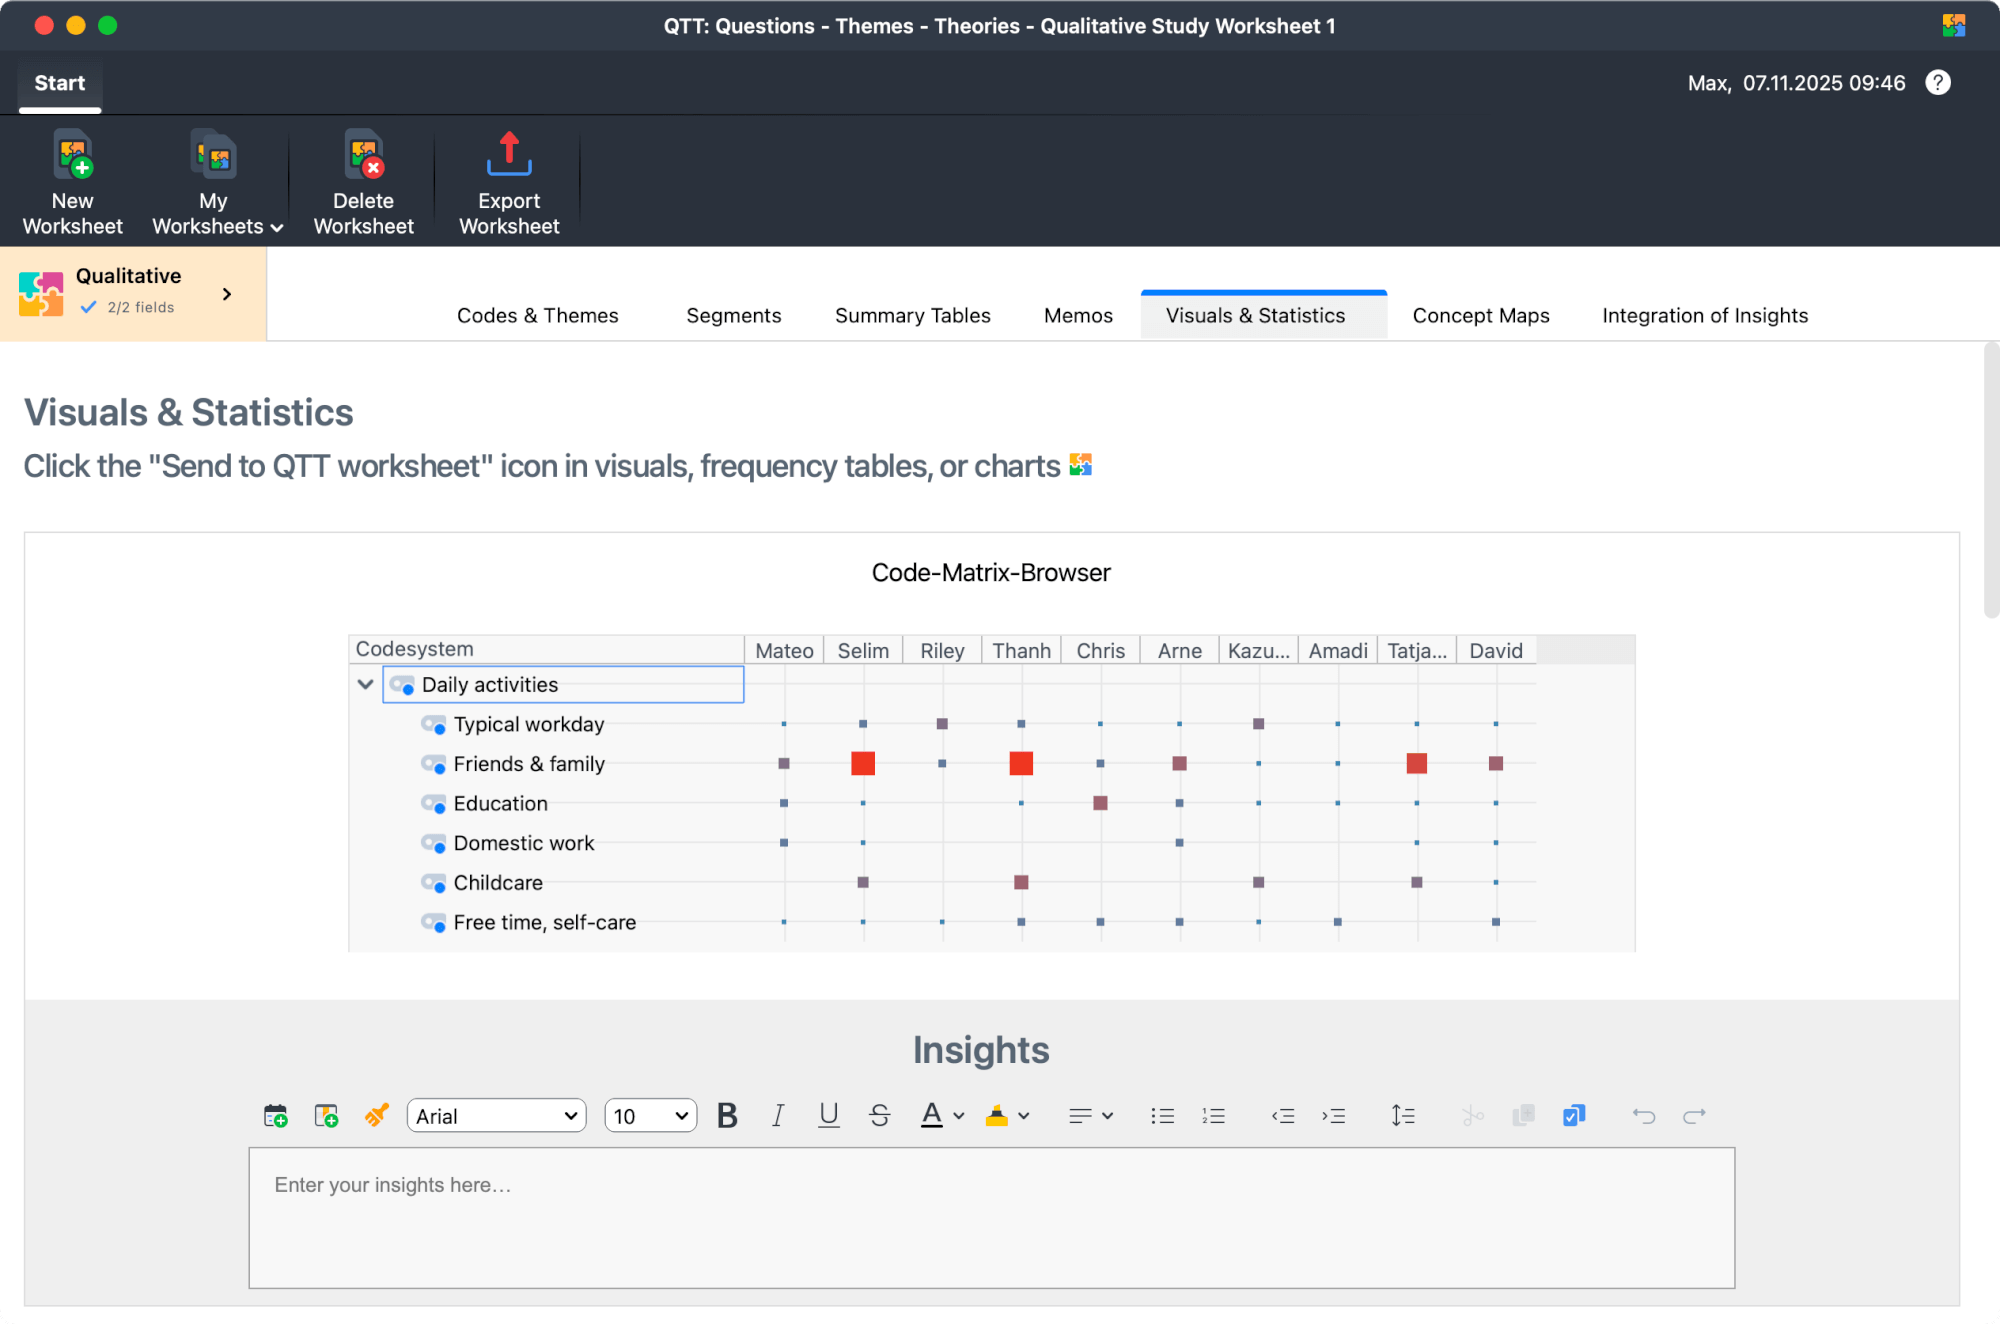
In QTT, a copy of the element is saved at the time of insertion. You can no longer change elements in QTT, only comment on them. For example, if you insert a memo into a worksheet, the memo text is saved in QTT and can be viewed there. If you change the memo in the MAXQDA project, these changes are not transferred to the QTT worksheet.
Understanding Worksheet Sections
QTT worksheets are organized into sections, allowing you to distinguish between different types of information and results. Both Qualitative Study Worksheets and Mixed Methods Worksheets automatically create sections when you make a new worksheet. The sections differ slightly depending on the type of worksheet you create. The following table compares the sections in the two types of worksheets:
Qualitative Study Worksheet | Mixed Methods Worksheet | Contents |
Codes & Themes | QUAL: Codes | Codes from your codesystem |
Segments | QUAL: Segments | Coded data segments |
Visuals & Statistics | QUAL: Visuals QUAN: Statistics JOINT Displays | Outputs from |
Summary Tables | JOINT Summary Tables | Summary Tables |
Memos | Memos | Memos |
Concept Maps | Concept Maps | Concepts Maps from MAXMaps |
Integration of Insights | Integration of Insights | A special section for synthesizing the insights from all other sections |
Section names in the Mixed Methods Worksheet indicate whether they contain qualitative (QUAL), quantitative (QUAN), joint (JOINT), or overarching content (no prefix). Additionally, the Mixed Methods Worksheet provides a more detailed subdivision of the "Visuals & Statistics" section to differentiate between qualitative and quantitative content.Wiederholen
Adding Content by Section Type
Let’s examine how to add content to each type of section in your QTT worksheet and how each section works.
Codes & Themes / QUAL: Codes
To insert a code into this section, drag and drop it from MAXQDA’s main “Codes” window.
To insert a code if you are inside the codes section of a worksheet:
- Click the Add Elements button to open a selection dialog with the current code system.
- Select individual codes or click Activated Codes to insert the currently activated codes.
- Click OK to insert the selected codes into the worksheet.
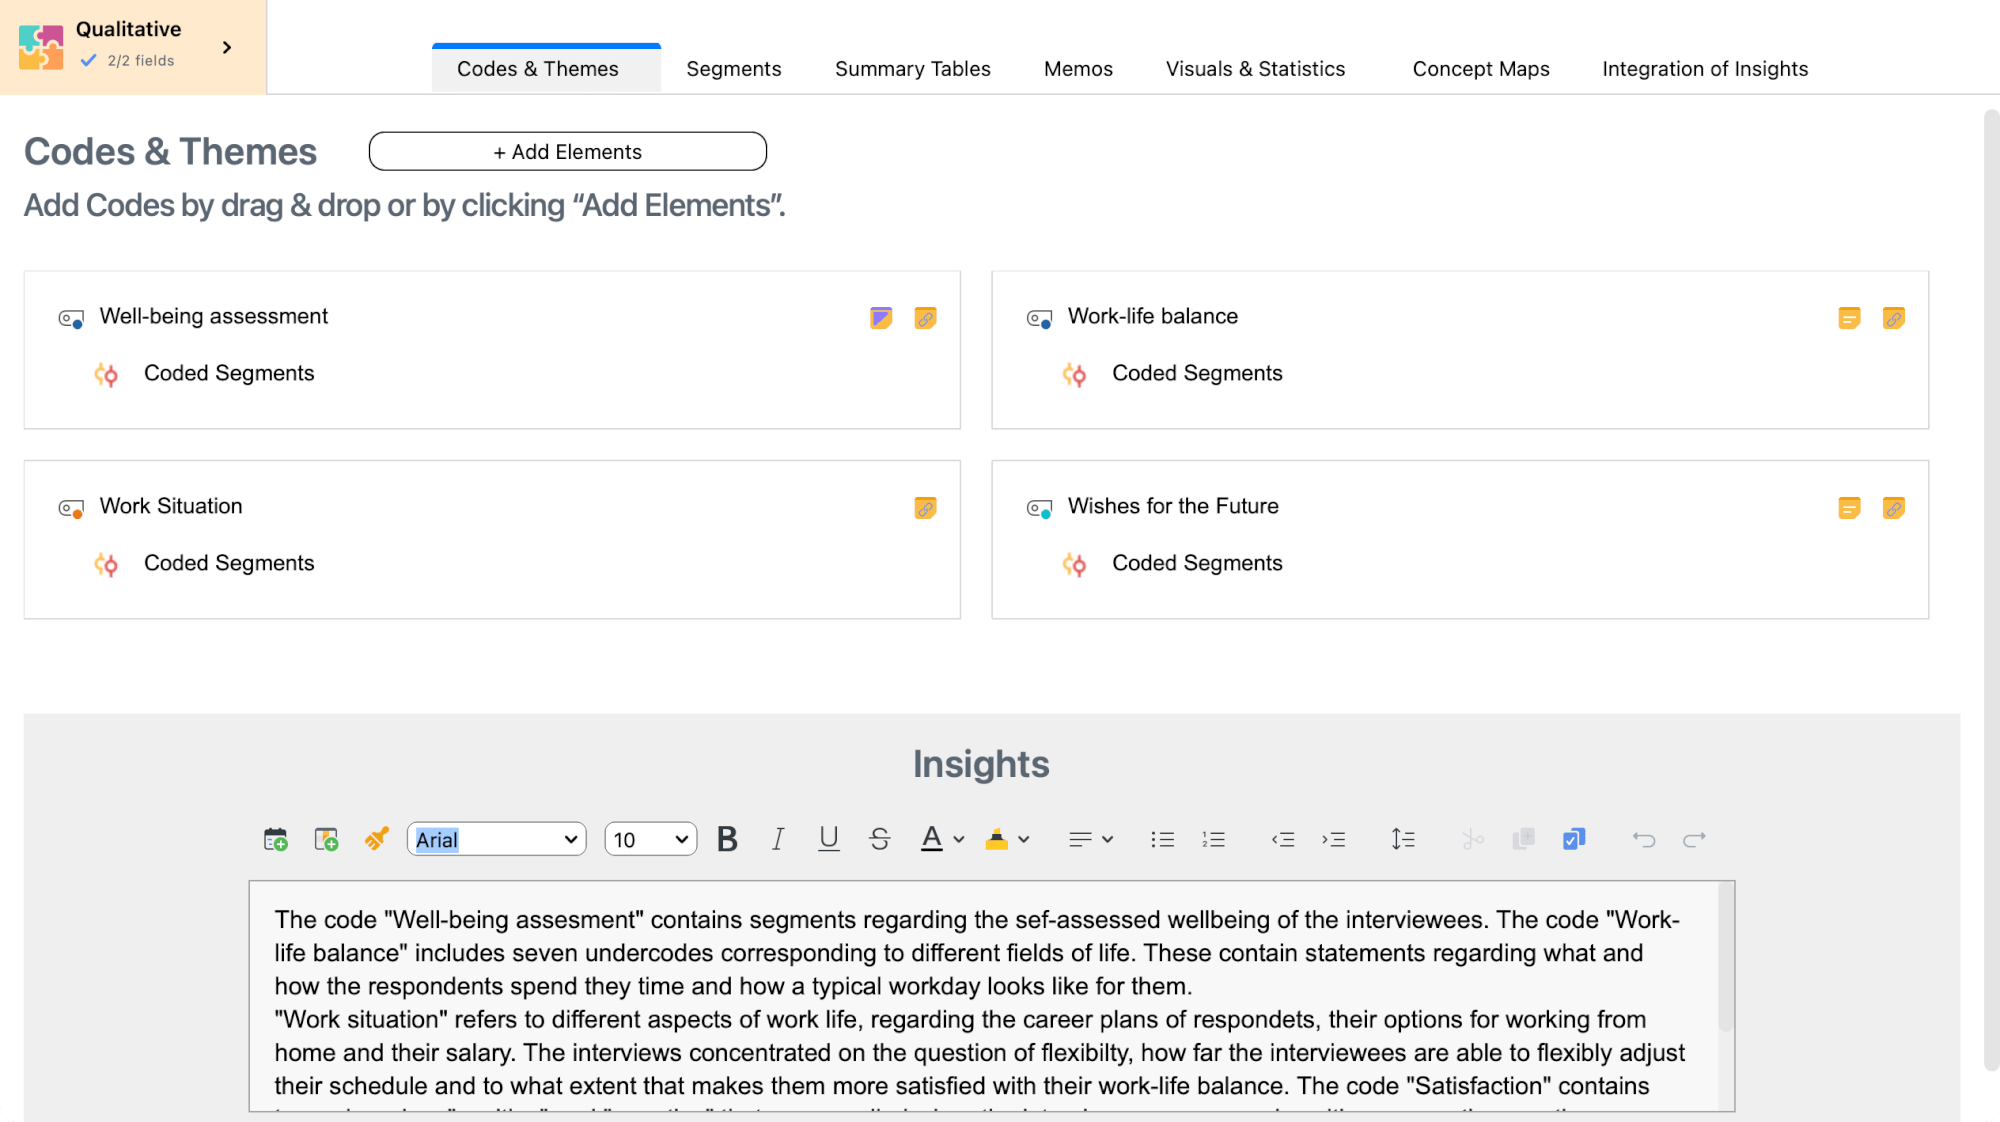
Each code is displayed on an interactive tile with the following features:
- Hover over the code memo icon to preview the memo text; double-click the icon to display the memo (memos cannot be modified in QTT).
- Click “Coded Segments” to access a compilation of all segments coded with that code (this compilation always reflects the current state of the project, not the time when the code was inserted)
- Drag-and-drop tiles to adjust the order of codes.
- Right-click a tile to remove the code from the worksheet.
Below the code tiles, you can record your insights in the text box.
Segments / QUAL: Segments
There are several ways to insert coded segments into QTT.
From the “Document Browser” and “Retrieved Segments” Window
- Right-click on the associated coding stripe (the "coding bracket") next to the document
- Select Send to QTT Worksheet and choose the desired worksheet
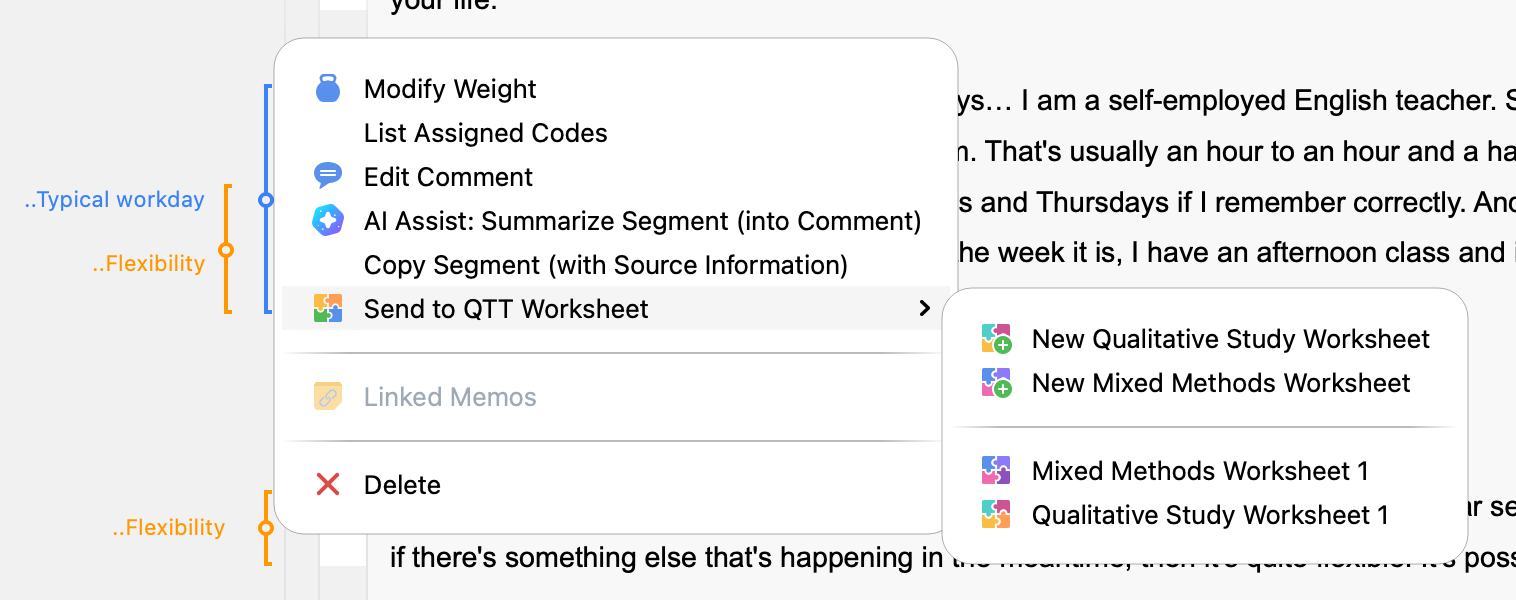
Alternatively, drag the coding stripe directly into the QTT window with the mouse.
The context menu and drag-and-drop feature are also available for coding stripes in the “Retrieved Segments” window.
From the Tabular Overview “Coded Segments”
- Click the Send to QTT Worksheet icon in the upper right corner
- Select the desired worksheet
Alternatively, drag selected segments directly into QTT with the mouse.
Working with Segment Tiles in QTT
Each coded segment is displayed on an interactive tile:
- Click and drag a tile to adjust the order.
- Right-click the tile to copy the segment contents to the clipboard or remove it from the worksheet.
Below the segment tiles, you can record your insights in the text box.
Visualizations / QUAL: Visuals / QUAN: Statistics / JOINT Displays
You can send visualizations, statistical outputs, charts, and joint displays directly to QTT by clicking the Send to QTT Worksheet icon in the output’s top right corner and selecting the desired worksheet.
This applies to:
- Visualizations created with features from the Visual Tools menu tab
- Many outputs created with features from the Analysis menu tab
- Statistical outputs and charts
- Joint displays created with features from the Mixed Methods menu tab
![]()
It is not possible to insert a Segment Matrix into a QTT worksheet.
Below each visualization, table, chart, or joint display, you can record your insights in the text box.
Summary Tables / JOINT Summary Tables
You can directly send summary tables to QTT by clicking on the icon Send to QTT Worksheet in the menu ribbon of a summary table.
To insert a summary table if you are inside the Summary Tables section in a worksheet:
- Click the Add Elements button to open a listing of all summary tables in the project.
- Select a table and click OK.

Within the QTT,
- you can adjust the columns’ width with the mouse,
- right-click on a table to copy it to the clipboard or remove it from the worksheet.
Below each summary table, you can record your insights in the text box.
Memos
When viewing a memo—either in the Memo Editor or the Memo Manager—click the Send to QTT Worksheet icon to insert it into QTT.
To insert a memo if you are inside a worksheet:
- Click the Add Elements button to open a listing of all memos in the project.
- Select memos and click OK to insert them into the worksheet.
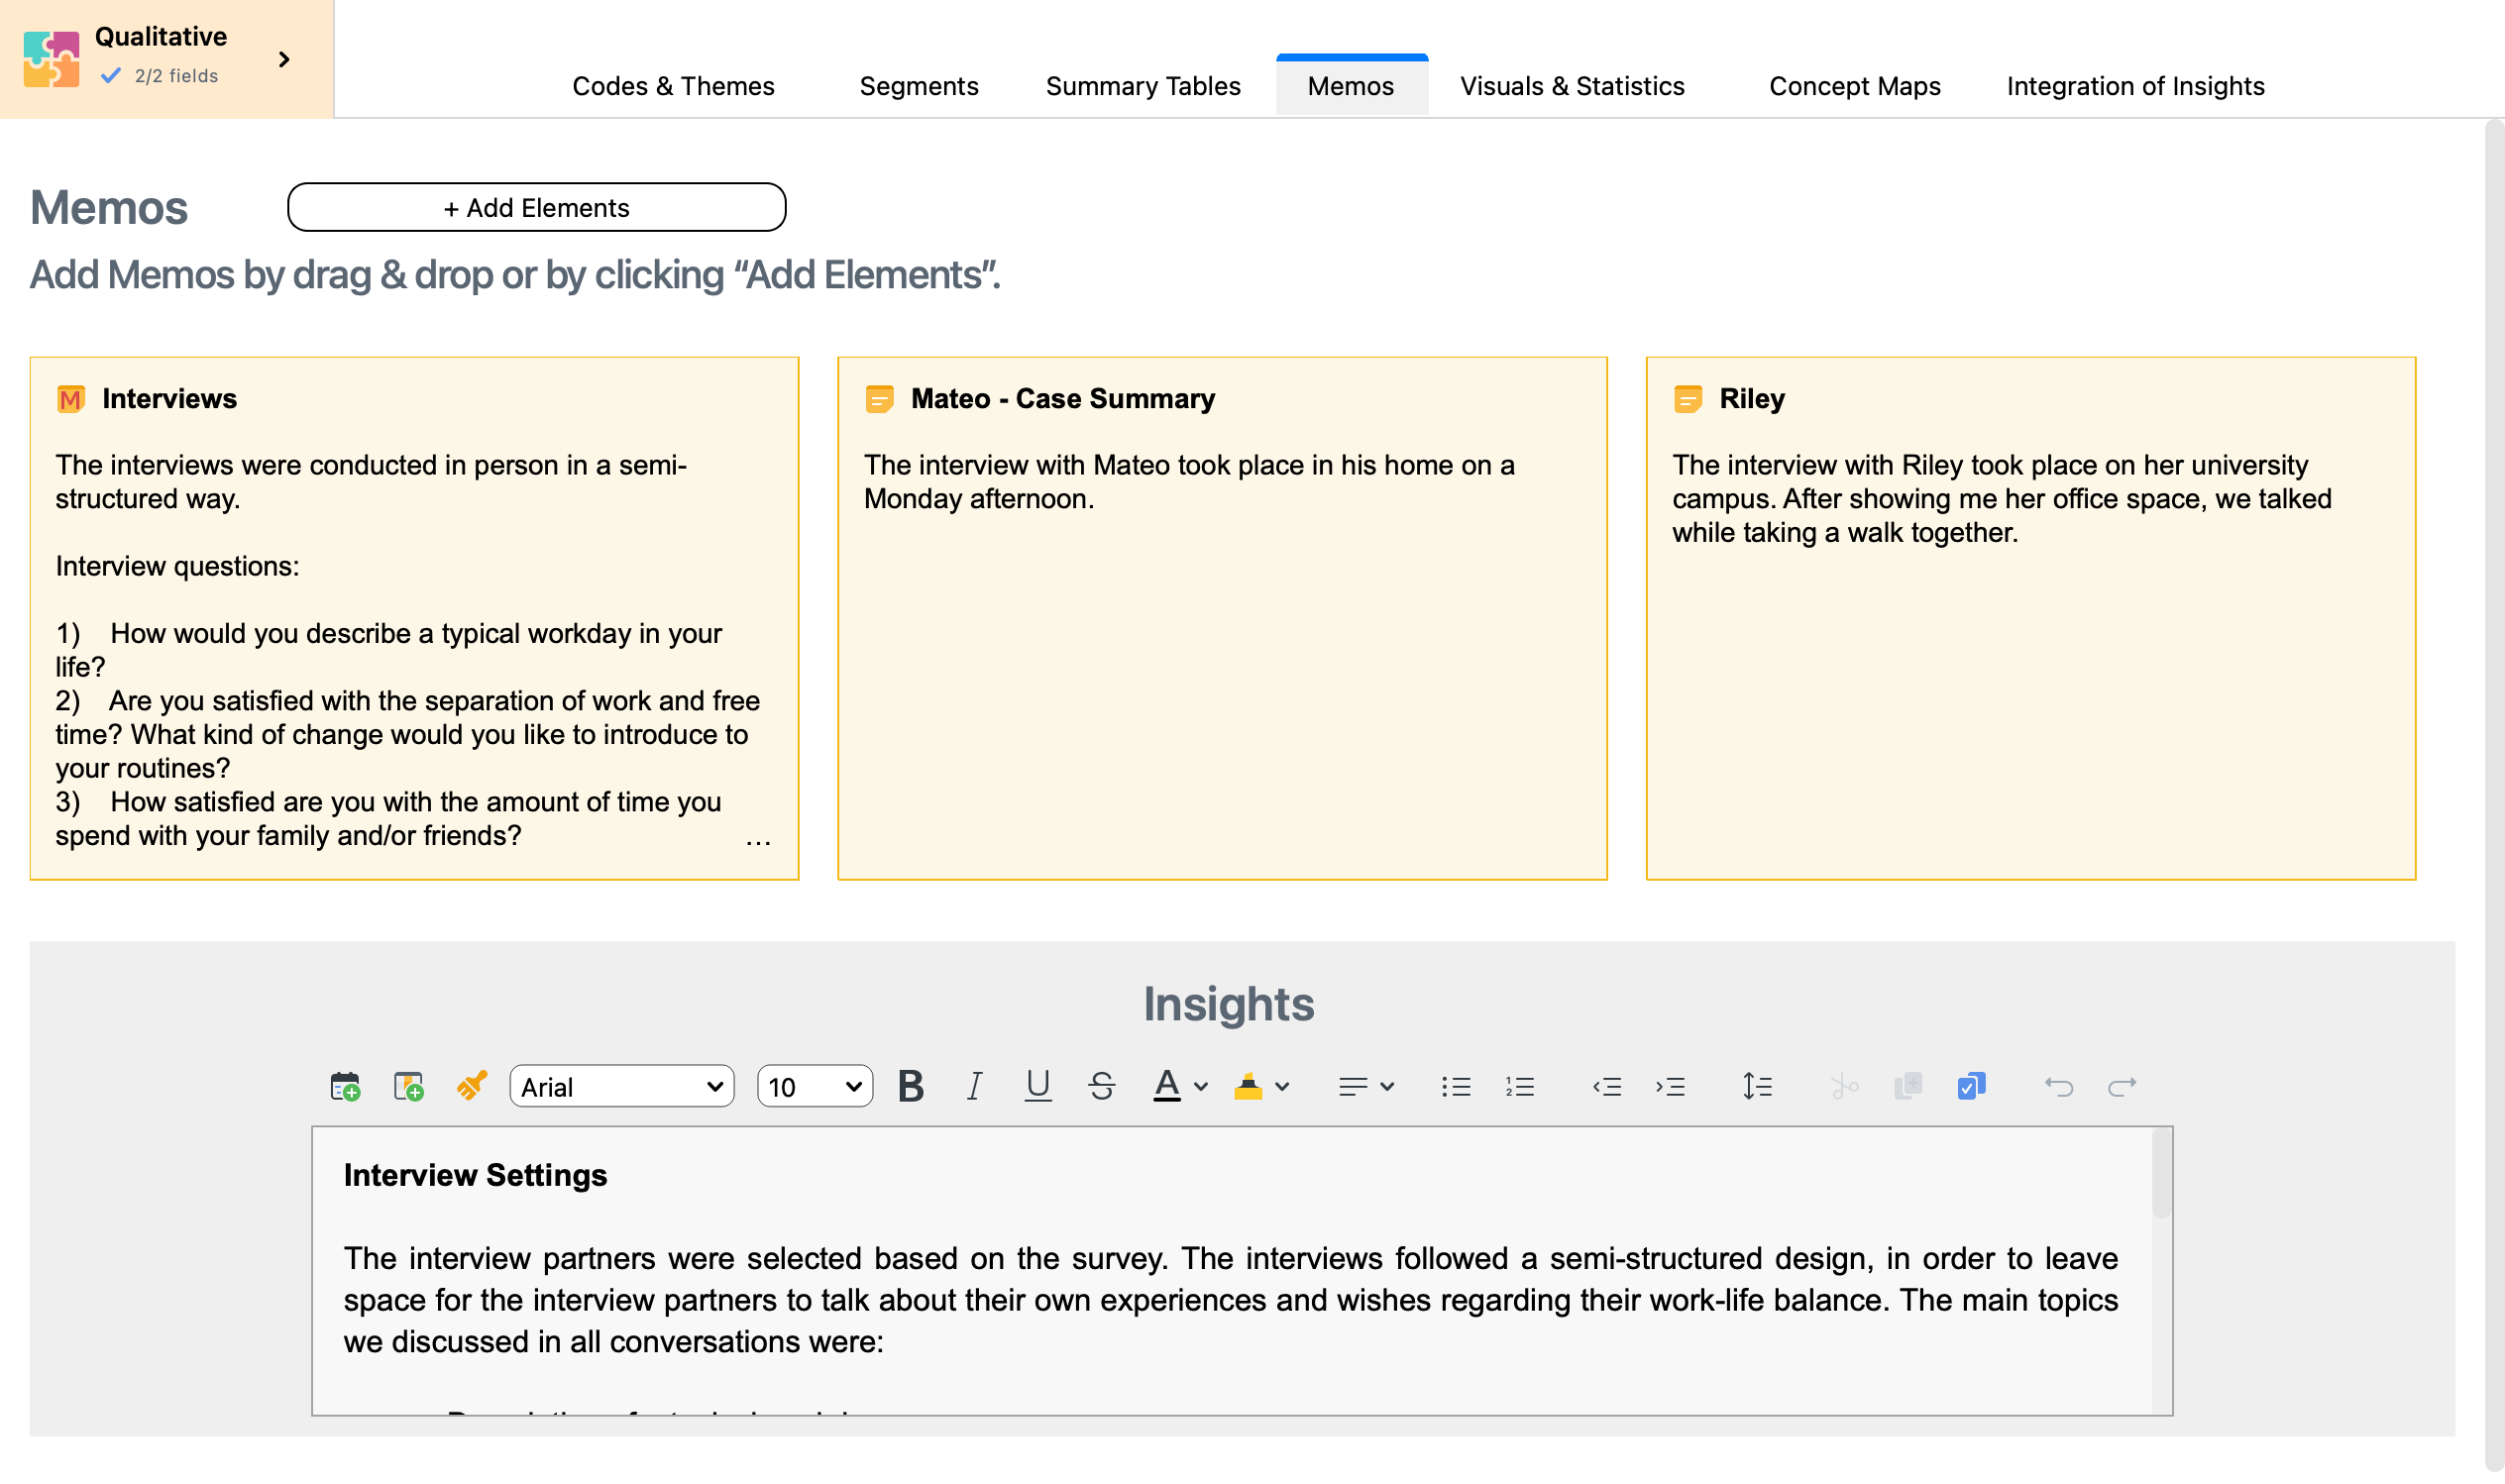
Each memo is presented on an interactive tile:
- Double-click the tile to display the complete memo content.
- Drag-and-drop tiles to adjust the order.
- Right-click the tile to remove the memo from the worksheet.
Below the memo tiles, you can record your insights in the text box.
Concept Maps
To insert a concept map created with MAXMaps into QTT, click on the Send to QTT Worksheet icon in the top right corner of the MAXMaps ribbon menu.
To insert a concept map if you are inside a worksheet:
- In QTT, click the Add Elements button in the Concept Maps section to list all maps in the project.
- Select a map and click OK.
Below each concept map, you can record your insights in the text box.
Developing and Integrating Insights
In each section of your worksheet, you can enter insights into the text field at the bottom. Depending on the section, there is either an overall insights text field or one for each individual element.
The “Integration of Insights” section is a special section in the QTT workspace. This is the place where it all comes together. Here you can
- View all your insights from the other sections simultaneously
- Integrate them into overall conclusions
- Develop hypotheses, theories, and meta-inferences
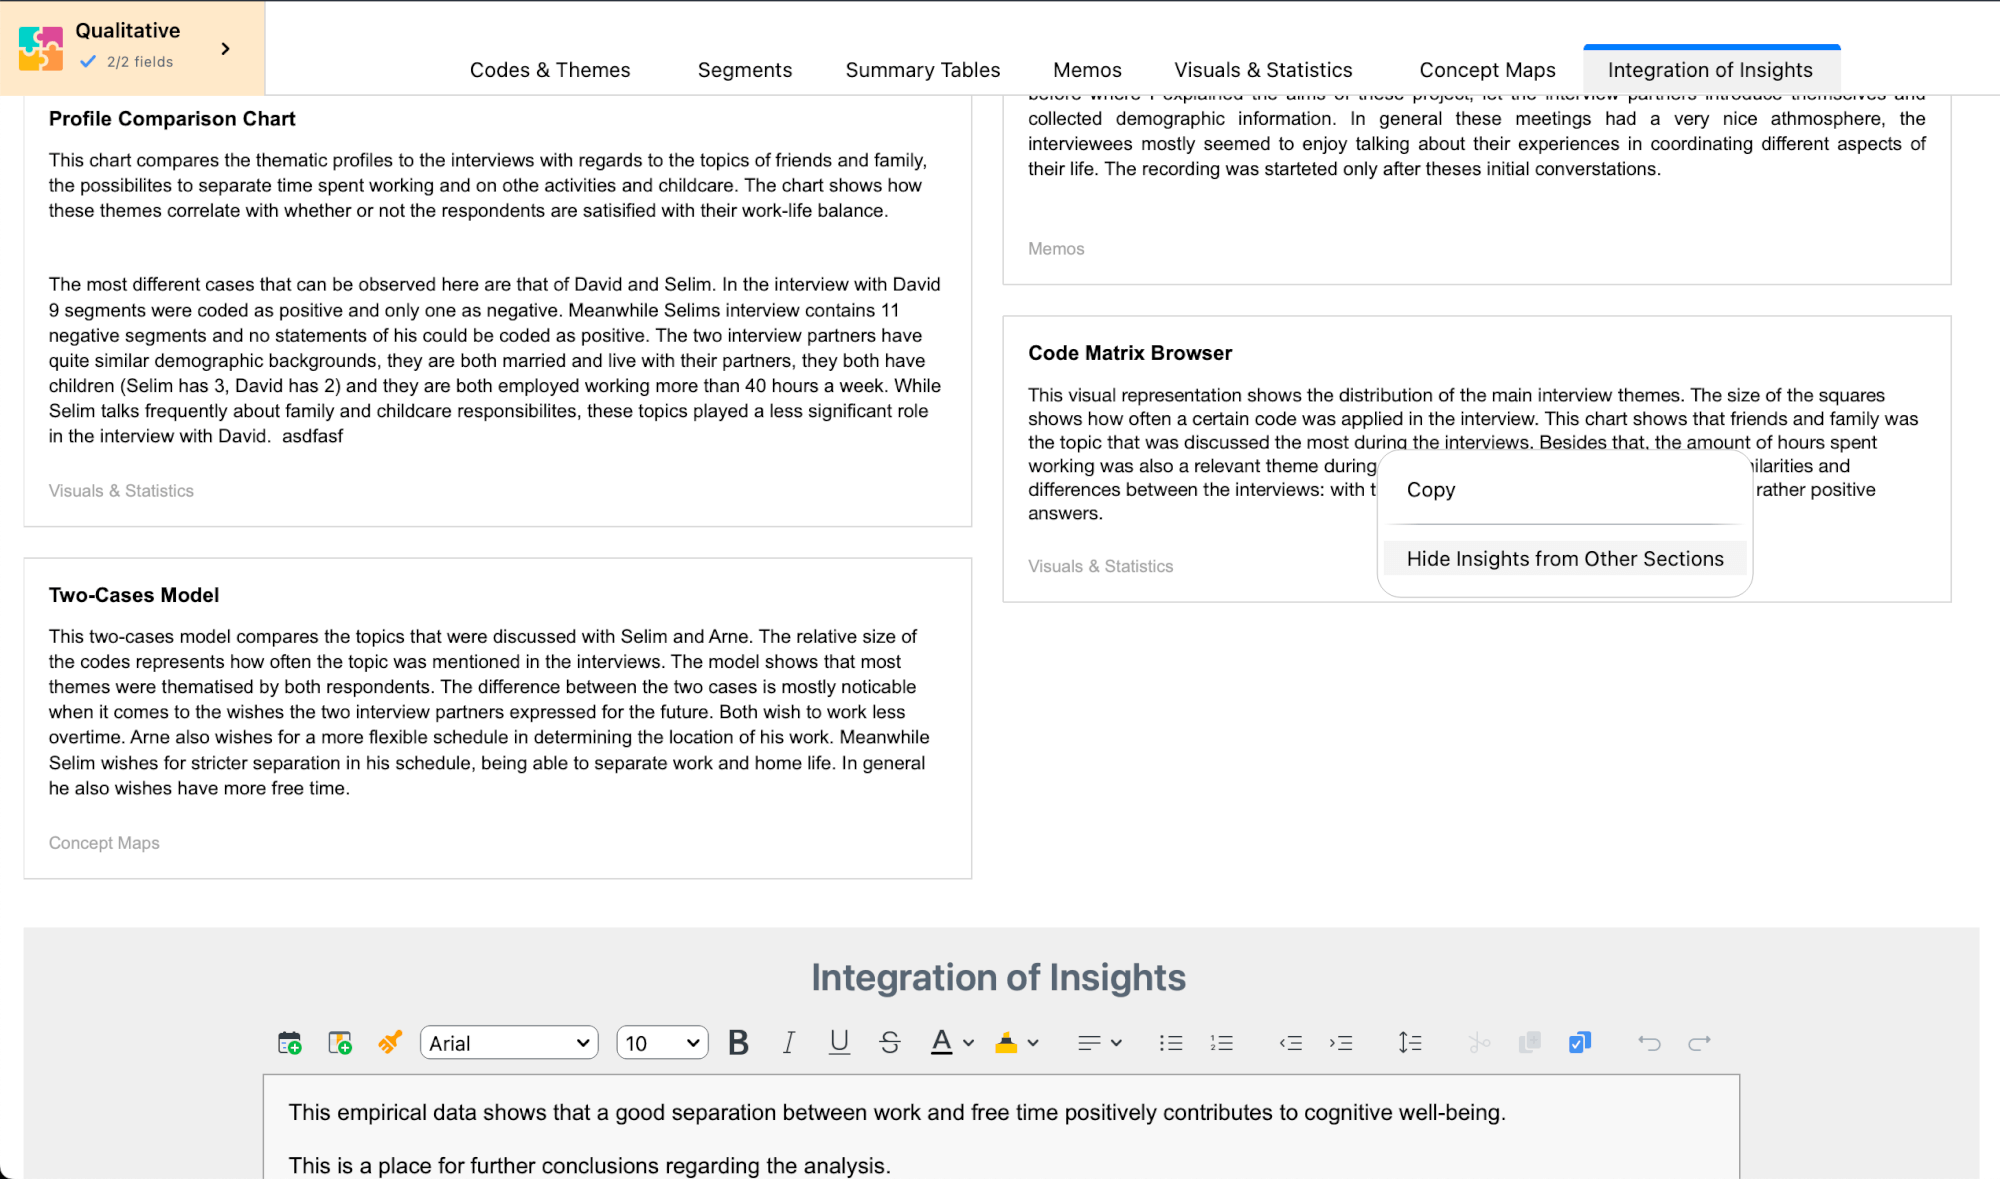
Tip: You can focus on insights of individual sections by right-clicking and selecting Hide Insights from Other Sections. To view all insight again, right-click on the remaining insights and select Show Insights from Other Sections.
Exporting Worksheet
When working with QTT, you develop findings and conclusions that often become important components of your final report. MAXQDA provides flexible export options, allowing you to export an entire worksheet as a Word file or copy individual elements sections to the clipboard.
Exporting an Entire Worksheet
To export a complete worksheet:
- Click the Export icon in the menu tab of the QTT window
- MAXQDA exports the worksheet as a Word file in DOCX format
Each section starts on a new page in the exported document.
Exporting a Single Section
To export all contents of a single section:
- Right-click the section’s tab name
- Select Copy Content
- Paste the contents directly into Word or another program using Ctrl+V (Windows) or ⌘+V (macOS)
Exporting Individual Elements
To export a specific element, such as a visualization, memo, or table:
- Right-click on the element
- Select Copy
- Paste the contents directly into Word or another program using Ctrl+V (Windows) or ⌘+V (macOS)
