
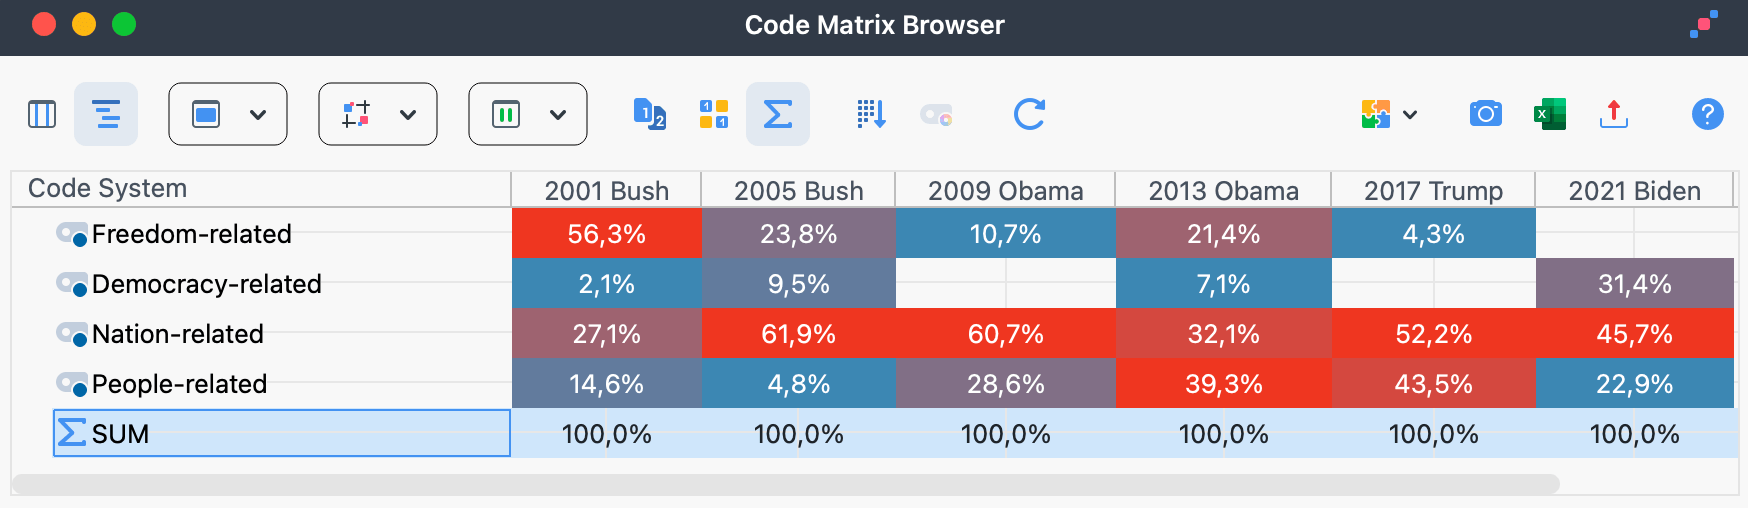
The Code Matrix Browser (CMB) visualizes which codes have been assigned to which documents. The matrix shows at a glance how many segments in each document have been assigned each code.
Documents are listed in the columns and codes in the rows. Each cell, where a document and code intersect, shows how many segments in that document have been assigned the code. Depending on your settings, a cell displays a node (a square or circle), a number, or a percentage, with or without a colored background. When nodes are displayed, larger nodes represent more segments. You can also display document groups, document sets, or focus group speakers in the columns, for example, to compare individual cases or groups of cases.
You can open the Code Matrix Browser in the following ways:
- Select
 Code Matrix Browser from the Visual Tools menu, or
 - use the keyboard shortcut Ctrl+Alt+M (Windows) or ⌘+⌥+M (macOS)
 Code Matrix Browser from the Visual Tools menu, or
Code Matrix Browser options
When you open the Code Matrix Browser, a dialog appears where you can choose what the matrix displays.
First, choose how to group the columns:
Documents – No grouping; each document gets its own column.
Document groups – Each column represents a document group, and the coded segments from all documents in that group are added together. With Top level, the columns represent the top-level document groups in the documents window, and documents in subgroups are counted toward their top-level group. With Second level, the columns represent only document groups nested within another group.
Document sets – Each column represents a document set, and the coded segments from all documents in that set are added together. To include or exclude specific sets, click the three dots next to this option.
Focus group speakers – Each focus group speaker gets a separate column.
Additional options let you restrict the matrix to selected data:
Only for activated documents – Includes only documents that are activated in the documents window.
Only for activated focus group speakers – Includes only focus group speakers that are activated in the documents window. Speakers are activated there together with the documents, not in the codes window. This option is available only if you selected focus group speakers for the columns.
Only for activated codes – Shows only codes that are activated in the codes window.
Use weight filter – Includes only coded segments within the current weight filter.
Code Matrix Browser toolbar
The toolbar at the top of the window provides access to the following functions:
 Quote Matrix – Displays the coded segments associated with the selected cells in an interactive view.
 Display codes with hierarchy – When enabled, codes are displayed according to the hierarchical structure of the code system. If Only for activated codes is selected, non-activated parent codes are still shown to preserve the hierarchy, but they have no nodes or values because their frequencies are set to 0, even if they contain coded segments. When disabled, all codes are displayed on a single level. If Only for activated codes is also selected, only activated codes are shown.
Column names – Use this dropdown to choose how much of each name appears in the column headers. To see the full name, including its document group, hover over the column header.
- Hide column names – Leaves the column headers empty.
- Short column names – Displays shortened names.
- Full column names – Displays the full name.
 Hide column names – Leaves the column headers empty.
 Short column names – Displays shortened names.
 Full column names – Displays the full name.
Display – Use this dropdown to choose how code frequencies are displayed:
- Squares – Displays squares that vary in size.
- Circles – Displays circles that vary in size.
- Frequencies – Displays numerical values.
- Frequencies (heatmap) – Displays numerical values on a color-coded background.
- Percentages – Displays percentage values.
- Percentages (heatmap) – Displays percentage values on a color-coded background.
 Squares – Displays squares that vary in size.
 Circles – Displays circles that vary in size.
 Frequencies – Displays numerical values.
 Frequencies (heatmap) – Displays numerical values on a color-coded background.
 Percentages – Displays percentage values.
 Percentages (heatmap) – Displays percentage values on a color-coded background.
Calculation method – Use this dropdown to choose what node size, color, and percentages are calculated against. It is not available when Frequencies is selected in the Display dropdown.
- Node size, color, percentages based on: all cells – Uses all coded segments in the matrix as the basis for calculation.
- Node size, color, percentages based on: column – Uses the total for each column as the basis for calculation.
- Node size, color, percentages based on: row – Uses the total for each row as the basis for calculation.
 Node size, color, percentages based on: all cells – Uses all coded segments in the matrix as the basis for calculation.
 Node size, color, percentages based on: column – Uses the total for each column as the basis for calculation.
 Node size, color, percentages based on: row – Uses the total for each row as the basis for calculation.
 Count hits per document only once – Shows whether a code occurs in a document rather than how many segments have been assigned that code. For collapsed subcodes, the frequencies of the subcodes are added together.
 Binarize view – Shows only whether a code has been assigned in a cell, regardless of the number of segments, so all nodes have the same size. Even if a collapsed subcode contains several codings, it is counted only once.
 Sum – Shows totals for rows and columns.
 Sort columns by similarity of code pattern and sum of frequencies – By default, columns follow the order in the documents window. Click this icon to reorder them so that columns with many codes appear on the left and columns with few codes appear on the right. Columns with identical patterns and frequencies are placed next to each other. This makes it easier to identify patterns and similarities between cases or groups.
Click a column header to sort the rows by the frequencies in that column. This works only if Display codes with hierarchy is turned off.
 Display nodes in their code color – Displays squares and circles in their code color instead of the default blue-red color scheme. This option is available only if Display is set to Squares or Circles. It is saved together with the other Code Matrix Browser view settings.
 Rearrange – Refreshes the display.
Information window for a node
Each node shows how many segments of a document, document group, document set, or focus group speaker have been assigned a particular code. Move the mouse pointer over a node to see more details in a small information window:
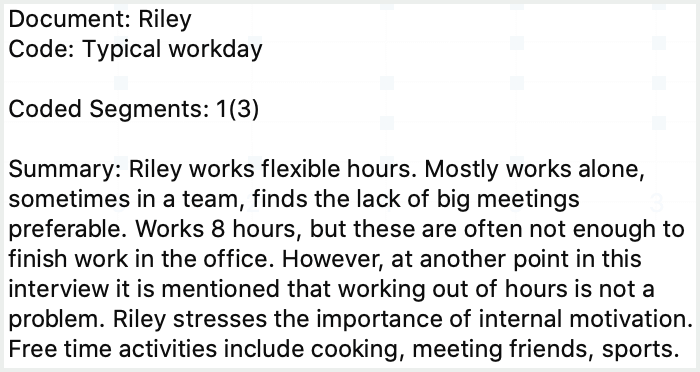
If documents are displayed in the columns, the window shows the document name, the code or subcode, and the number of coded segments. If Count hits per document only once is enabled, the actual number of coded segments also appears in parentheses. For example, a value of "1(3)" means that the cell displays a value of 1 but actually contains 3 coded segments.
If you have written a summary in the Summary Grid for a particular combination of document and code, it appears in the information window.
Compiling the coded segments for a node
Double-click a node to view its coded segments. The corresponding document and code are activated, and the segments appear in the Retrieved Segments window. You can leave the CMB open while inspecting different nodes one after another.
How is the node size determined?
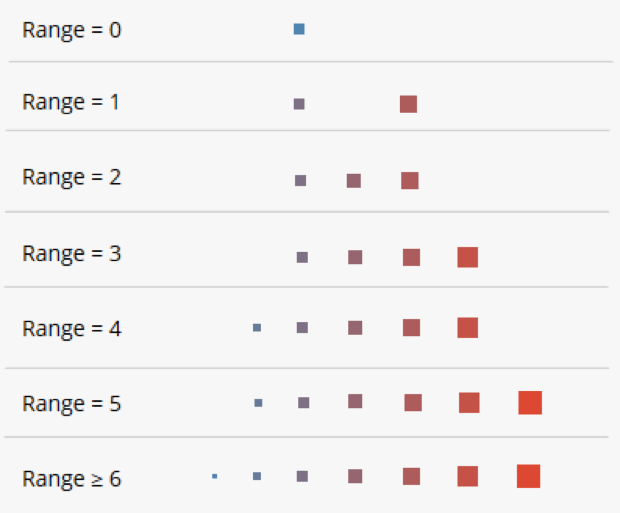
MAXQDA identifies the smallest and largest code frequencies among all displayed nodes and divides the range between them into seven equal steps. The smallest step is represented by the smallest node, and the largest step by the largest node. The difference between the smallest and largest values also matters: if the values are close together (for example, only 1 or 2 occurrences apart), MAXQDA uses medium-sized nodes instead of extreme sizes so that small differences are not exaggerated. For example, if the smallest value is 5 and the largest is 8, the range is 3. Cells with a value of 5 receive the smallest node for that range, while cells with a value of 8 receive the largest. If all values are identical (range = 0), all nodes are medium-sized.
Collapsing or expanding codes can change the overall display because the smallest and largest values may change.
If the calculation method is set to column or row, the same method is applied separately to each column or row.
Store view in Questions – Themes – Theories
In the Questions – Themes – Theories window, you can collect and comment on key results from your project. Click the  Send to QTT Worksheet icon in the upper right corner to save the current view to a new or existing worksheet.
Exporting the Code Matrix Browser
The options on the right side of the toolbar let you export the matrix. You can  copy the matrix to the clipboard as an image or
  export the code frequencies to Excel. With
  Export, a dialog opens where you can choose the file format and table layout.
The table can display either documents in rows and codes in columns, which is the default, or codes in rows and documents in columns. The default layout reverses the rows and columns shown in the Code Matrix Browser so the data can be imported into SPSS and other statistical software.
