This page discusses how to use the Survey Analysis workspace to analyze responses to quantitative survey questions. For an introduction to the workspace itself, including how to start the Survey Analysis process, visit the "The Survey Analysis Workspace" page. Alternatively, for instructions on how to work with qualitative questions visit "Qualitative Survey Analysis".
Using the quantitative workspace
When you select a quantitative question (closed-ended question) in the "Question Browser," the Survey Analysis workspace displays statistical information and visualizations for that variable. The workspace is divided into two main sections:
- The "Question Browser" (left panel)
Displays all survey questions. The currently selected quantitative question is highlighted in the "Question Browser" so you always know which question you are analyzing. For information about how to navigate it, check out this page. - Data view (main panel)
Shows the statistical data for the selected question. You can view the data as a table or as various chart types. The view updates dynamically based on your selected display options.
Analyzing quantitative questions (Closed-ended Responses)
To start analyzing a quantitative question, click on it in the "Question Browser." The workspace displays the response data in table format by default.
Viewing your data as a table
The table view displays the response distribution for the selected question. This view is similar to the "Statistics for Document Variables" table in MAXQDA.
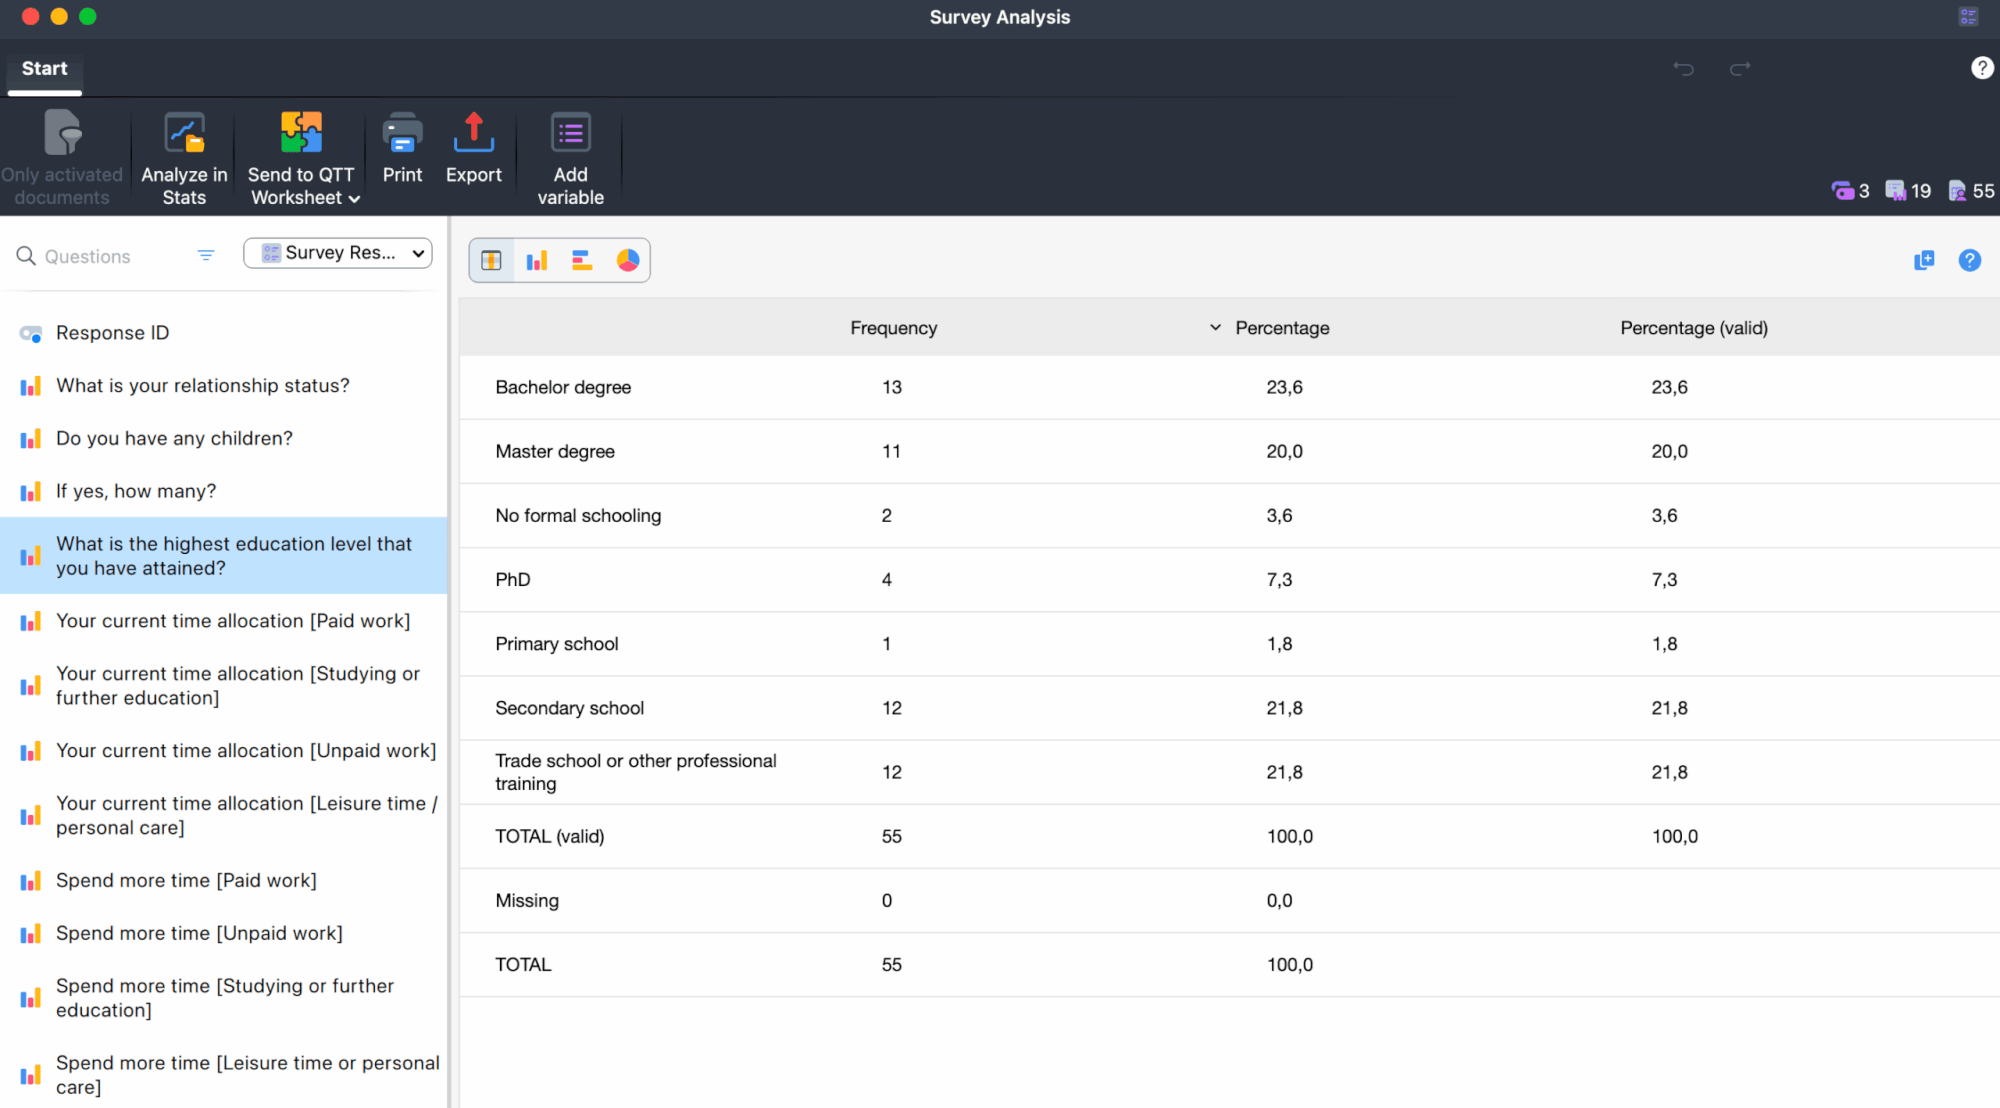
The table includes the following columns:
- Value labels – The response categories or values for the question
- Frequency – The number of respondents who selected each value
- Percentage – The proportion of respondents for each value
Working with the table
You can interact with the table data in several ways:
- Sort columns – Click on any column heading to sort the data in ascending order. Click again to sort in descending order. When you sort the table, any chart views are automatically updated to match the new order.
- Edit value labels – Double-click on any label in the first column to edit it. Label changes are immediately reflected in both the table and any chart views.
- Copy the table – Click the Copy button in the table toolbar to copy the entire table to your clipboard, making it easy to paste into other applications.
Like all MAXQDA tables, you can customize the display:
- Adjust column width and position by dragging with your cursor.
- Hide columns by right-clicking on a column heading and selecting hide options.
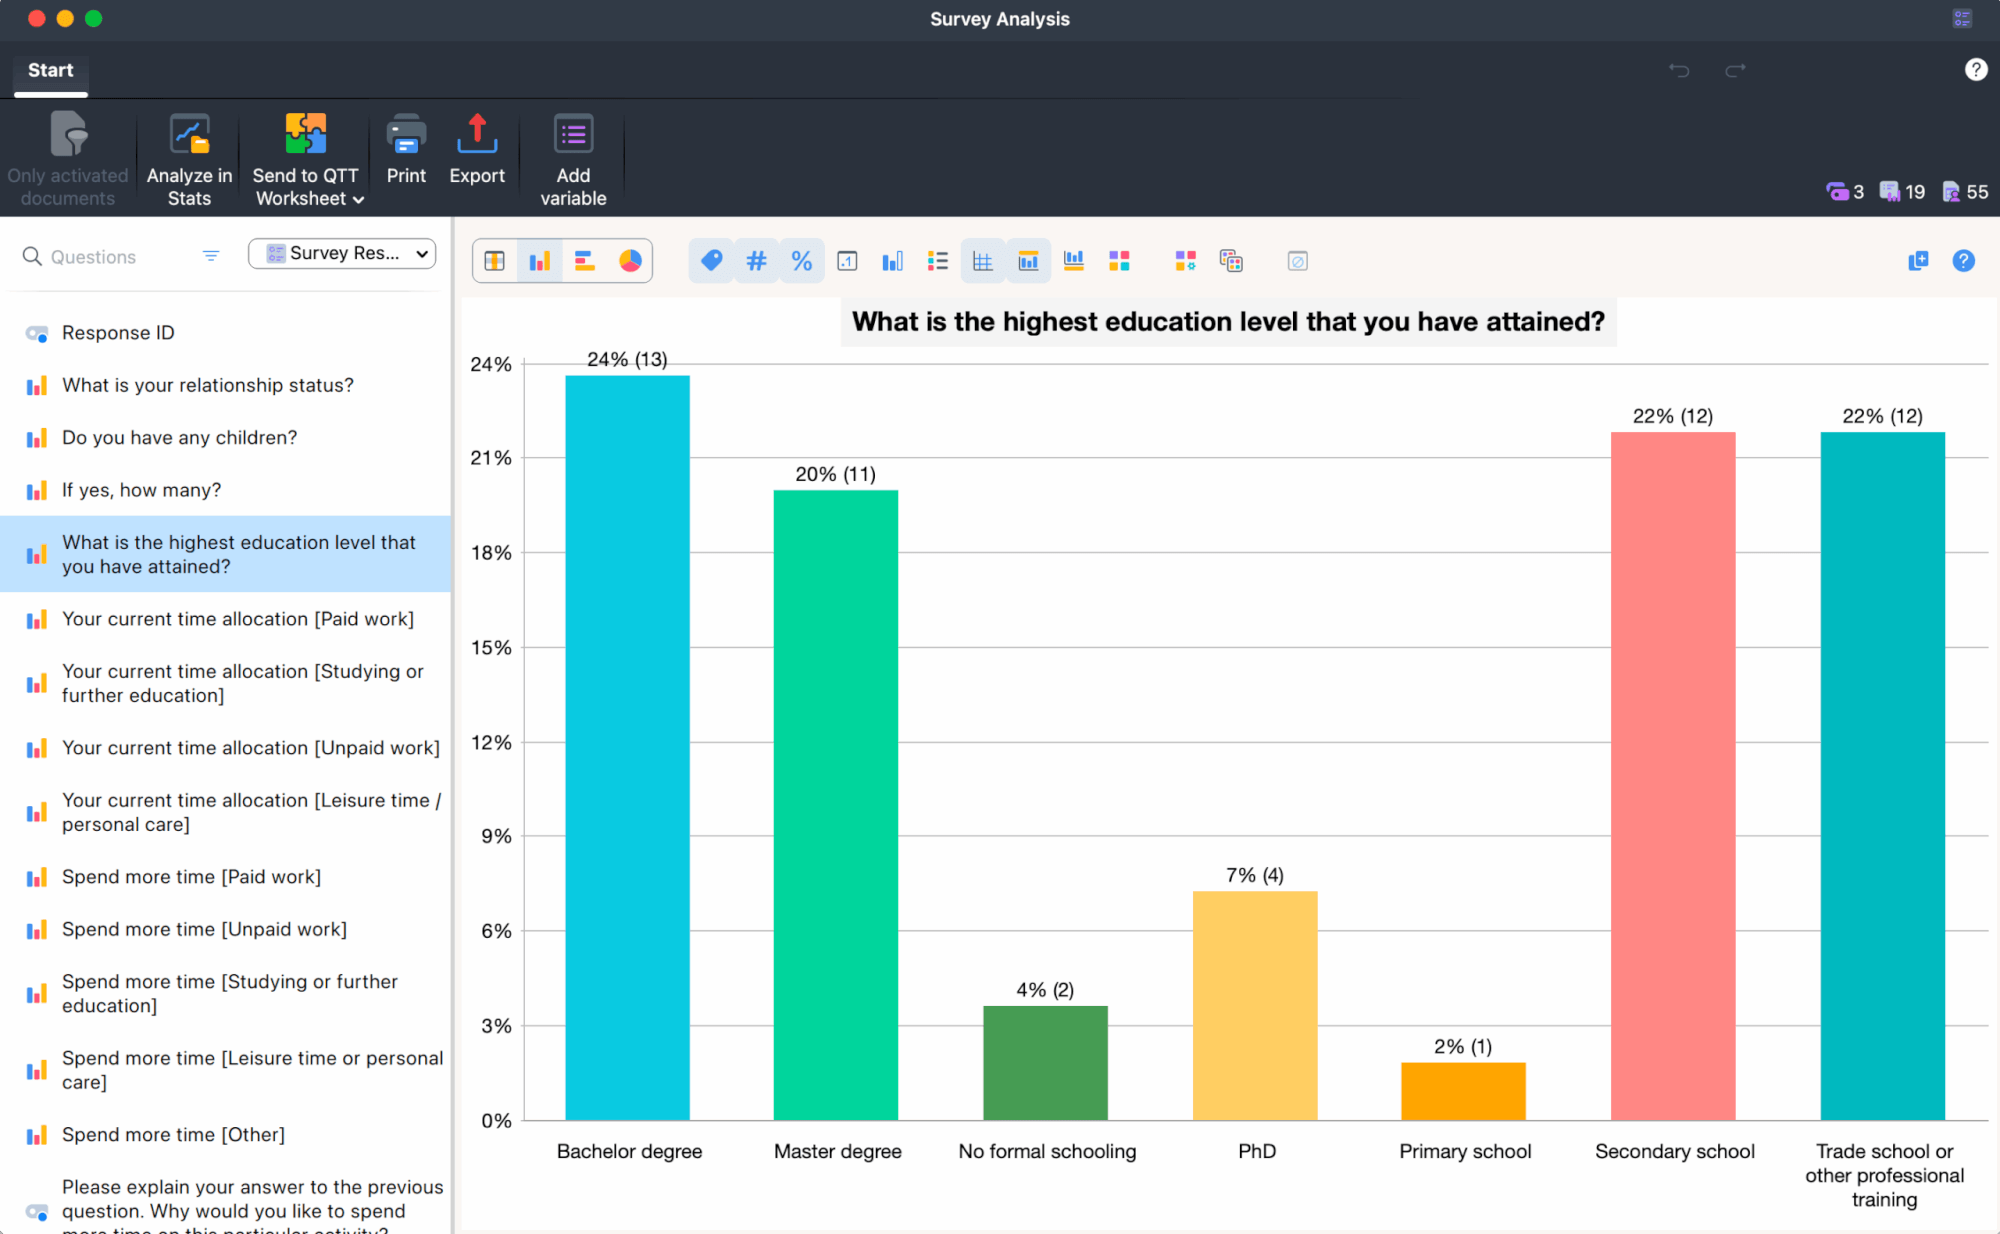
Viewing your data as charts
MAXQDA provides three chart types for visualizing quantitative survey data. You can quickly switch between different chart views using the view selection buttons in the toolbar.
Available chart types
Click any of the following buttons to switch to that chart type:
- Column Chart – Displays values as vertical bars, useful for comparing frequencies across categories
- Bar Chart – Displays values as horizontal bars, helpful when you have many categories or long labels
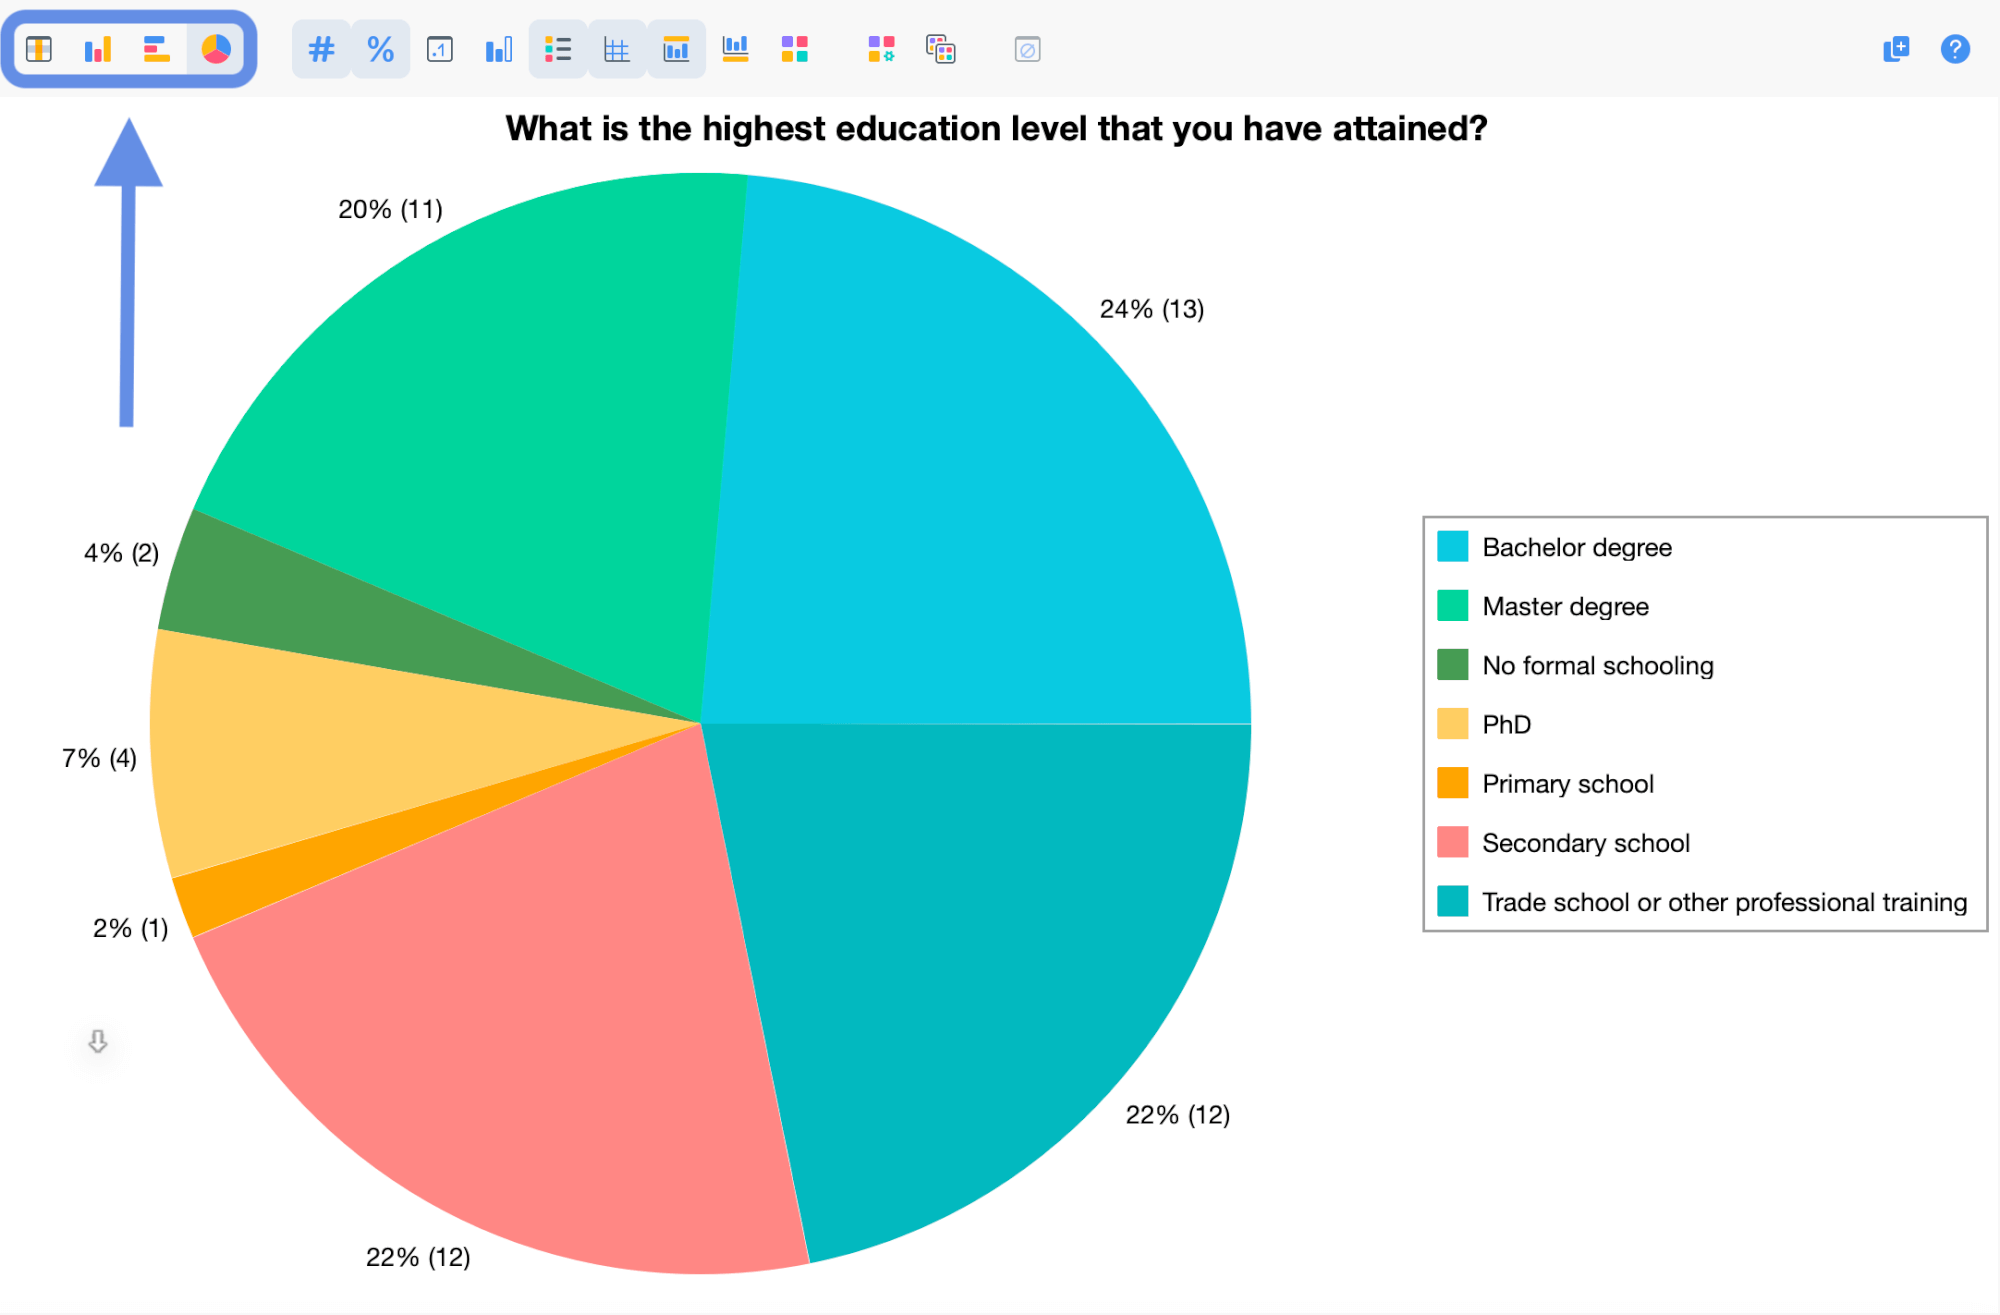
- Pie Chart – Shows the proportion of each value as slices of a circle, ideal for displaying parts of a whole
Each chart automatically updates to reflect any changes you make to value labels or data sorting in the table view.
Chart display options
When viewing charts, you have access to several display and statistical options in the chart toolbar. These options are the same as those available in MAXQDA's "Statistics for Document Variables" feature and allow you to customize how your data is presented.
Switching between table and chart views
Use the view selection buttons in the toolbar to switch between the table view and the three chart types. The toolbar shows four buttons:
- Table view – Shows the data in tabular format (default view)
- Column chart view – Switches to vertical bar chart
- Bar chart view – Switches to horizontal bar chart
- Pie chart view – Switches to pie chart
Your selection is remembered while the Survey Analysis workspace remains open, allowing you to return to your preferred view when switching between questions.
Adding variables to your survey
You can add existing document variables to your survey to include them in your analysis. This is useful when you want to analyze demographic information or other metadata alongside your survey questions.
To add variables to your survey:
- Click Add variable… in the workspace's main menu.
- In the dialog that appears, select one or more variables from the list. The dialog shows all document variables that are not system variables and not already part of your survey.
- Click OK to add the selected variables to the survey. They will appear at the bottom of the Question Browser.
Export options
You can export both the table and chart views. The available export formats depend on the view currently displayed.
Available actions in both views
- Send to QTT - Sends the currently displayed table or chart to MAXQDA's QTT workspace.
- Print - Opens the print dialog.
- Export - Opens a dialog to save the file.
Export file formats
| View | Available formats |
|---|---|
| Table | Choose from spreadsheet and text-based formats in the export dialog (e.g. XLSX, CSV, etc). |
| Chart | PNG (raster), SVG (vector), EMF (Windows vector). |
Analyzing quantitative data with MAXQDA Stats
For more advanced statistical analysis of your quantitative survey data, you can open MAXQDA Stats directly from the Survey Analysis workspace. To learn more about this feature and what data is available in Stats, see "Analyze Survey Data with MAXQDA Stats".