The Configuration Table is a Mixed Methods tool that shows you at a glance how frequently a set of codes appears in a document.
To create a new Configuration Table, go to Mixed Methods > Configuration Table.
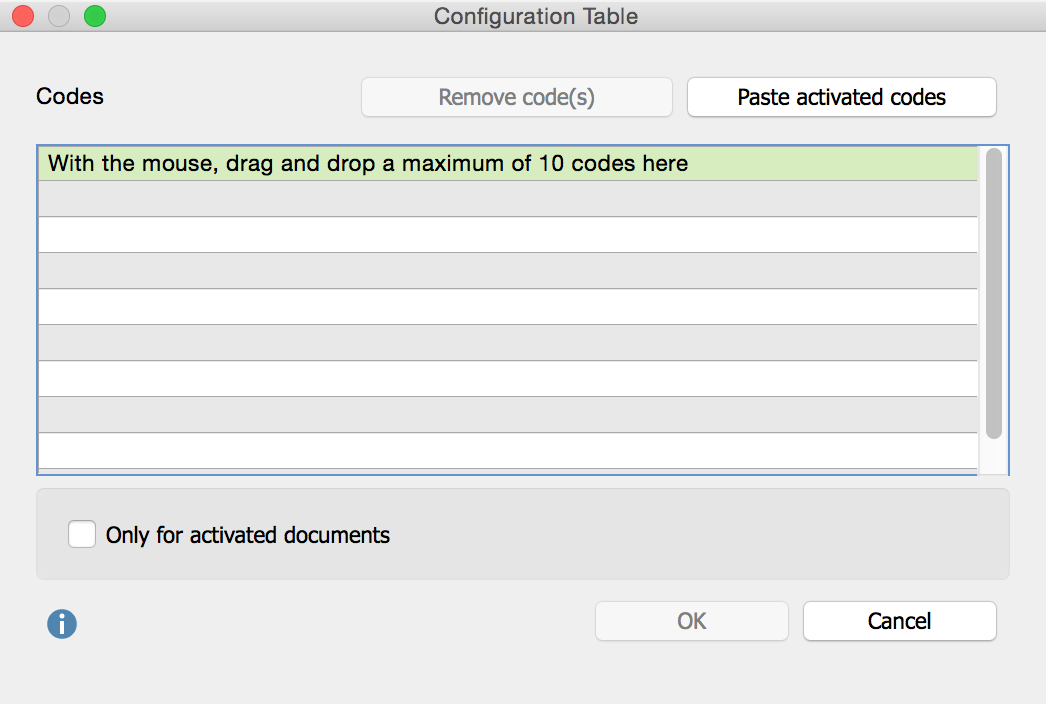
This will open a dialog window. You can pull up to 10 codes from the “Code System” into this window via Drag & Drop. You can also insert your activated codes in this window by clicking the button Paste activated codes. If you have activated more than ten codes only the first ten will be inserted in the Code System. You can delete one or more codes with the button Delete code(s).

You can restrict the evaluation to the documents you have activated with the option Only for activated documents.
Click OK to view the result of the evaluation. It is made up of two results tables: the Configuration Table and the Configuration Table – detail view.
1. Results Table: Configuration Table
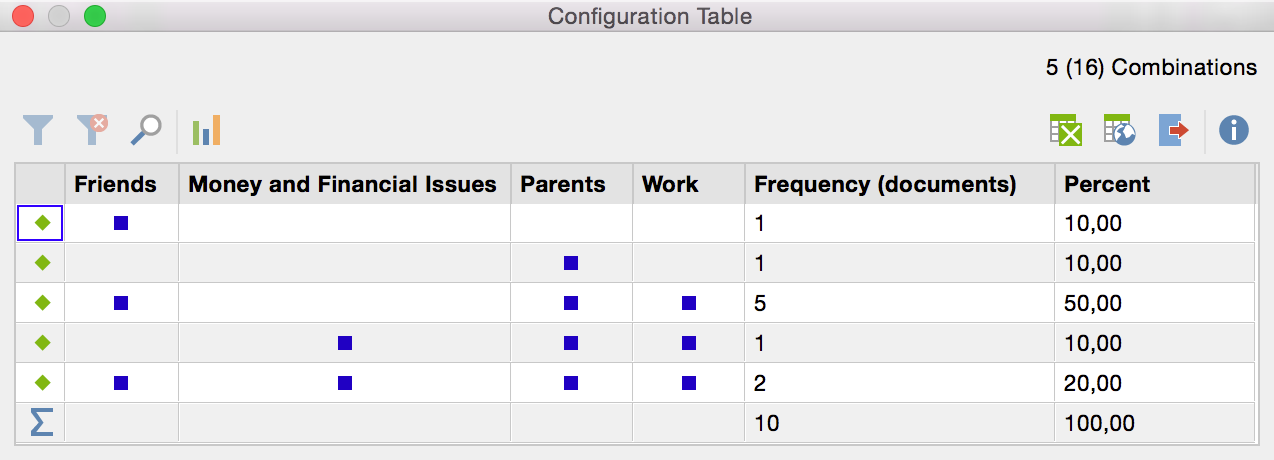
In this table the columns contain the codes you have chosen as well as two additional columns containing “Frequency” and “Percent.” Every row contains one possible combination of codes.
For example, a results table for the combination of three major global problems could look something like this:

Looking at this table, you can see that one document exists which contains the first code “Friends” as well as the code “Money and Financial Issues.” There are three documents with the code “Work”. There is also a document containing all four codes.
The column “Frequency” tells you how many of the evaluated documents contain a certain combination. The sum row also tells you how many documents were evaluated – in the example shown it was ten documents.
In the top right corner you see the number of combinations that actually exist in your documents and – in brackets – the number of all possible combinations. In the example above it says 5(16) which means there are five rows for the existing five combinations. And – because we evaluated four codes – mathematically, there are 24 = 16 possible combinations.
The table is automatically sorted by the frequency. You can also sort it by a different column by clicking a column header. You can also adjust the order of the columns via Drag & Drop.
If you click on the Statistic ![]() symbol, a frequency table in which all existing code combinations and their frequencies are listed. In the <no codes> row you can see the number of analyzed documents in which none of the selected codes occur.
symbol, a frequency table in which all existing code combinations and their frequencies are listed. In the <no codes> row you can see the number of analyzed documents in which none of the selected codes occur.
2. Results Table: Configuration Table – detail view
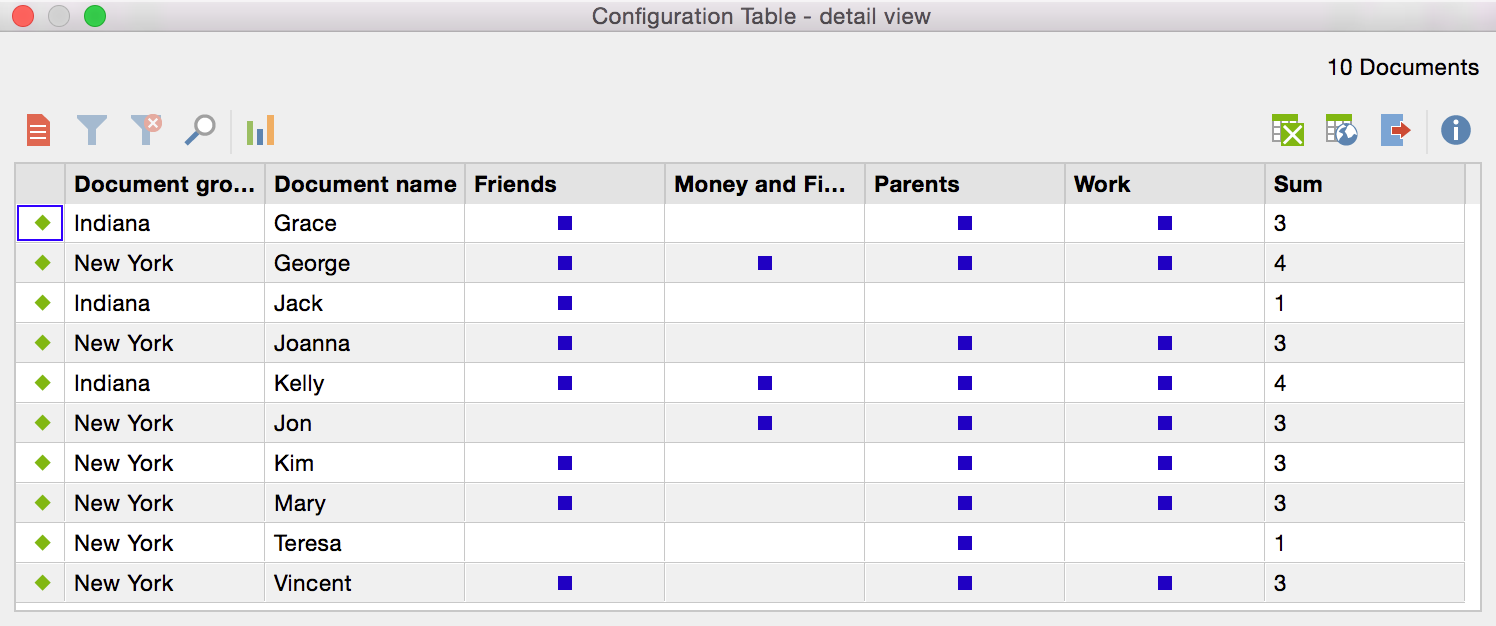
The second results table lists all evaluated documents and shows whether the selected codes appear in these documents or not. So this table corresponds to the (binarized) Code Matrix Browser, only that you can also sort it by columns.
The table has as many rows as documents were included in the analysis. The first two columns contain the document group and the name of the document. Next to these columns you see the columns for the selected codes. The column on the far right gives you the sum of the selected codes that appear in the respective document – regardless of how often those codes appears in the document.
The following screenshot shows an example of the detail view table:

The table is automatically sorted in order of the “Document System.” You can adjust the order by clicking the header of a column. You can also adjust the order of the columns via Drag & Drop.
