MAXQDA’s Code Matrix Browser is the ideal tool with which to illustrate and analyze the distribution of coded segments in different documents. This tool is in the form of a table, in which the documents make up the columns and the codes make up the rows. In the analysis of focus groups, often it is not the transcript as an individual document that is the central focus, but rather the analysis of the contributions in multiple documents, to be considered separately from each other.
The MAXQDA Code Matrix Browser therefore offers the opportunity to automatically perform exactly this analysis and visualize the distribution of codes per participant:
- Call up the Code Matrix Browser from the Visual Tools Menu.
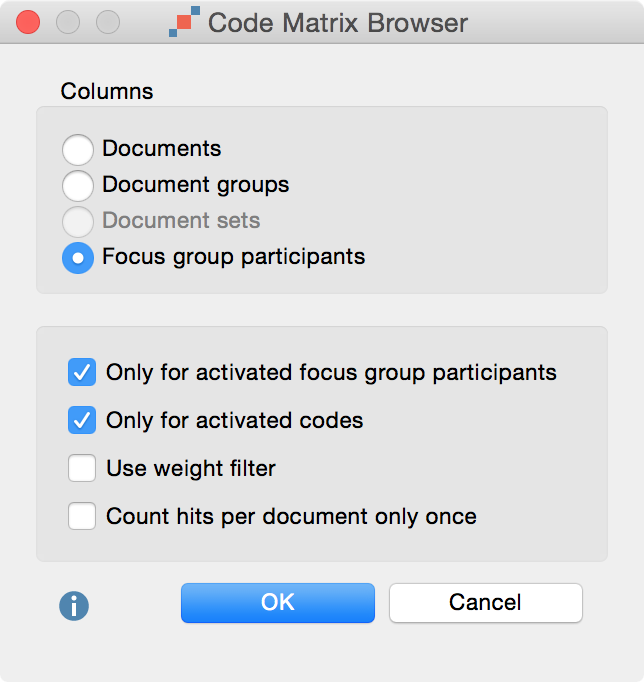
- In the window that appears, select the option Focus Group Participants. If you would like to visualize the codes of an individual participant (or to exclude the moderator from the visualization), you can activate these elements in advance, and additionally select the option Only for activated focus group participants.

When you click OK, MAXQDA will open the Code Matrix Browser, whose columns are made up of the participants.

The size of the squares provides information about how many coded segments from the four thematic codes are present in the contributions of each participant. The image above demonstrates the frequency of encodings on the four issues made by Lucas, Miles, Lisa, Casey, and Parker. The larger the square, the more encodings have been made with the code in question. It is evident from the image that Lucas a high amount of coding occurred regarding "Stress due to the financial crisis", whereas Parker made no contribution to this theme.
In the presentation of focus groups, The Code Matrix Browser operates in the same manner as usual: Double-clicking on a cell will display the corresponding coded segments in the “Retrieved Segments” window and clicking on the Display nodes as values ![]() presents the information as code frequencies rather than square. The functions of the other buttons in the Code Matrix Browser are described here >> LINK.
presents the information as code frequencies rather than square. The functions of the other buttons in the Code Matrix Browser are described here >> LINK.
The Segment Matrix for focus group participants
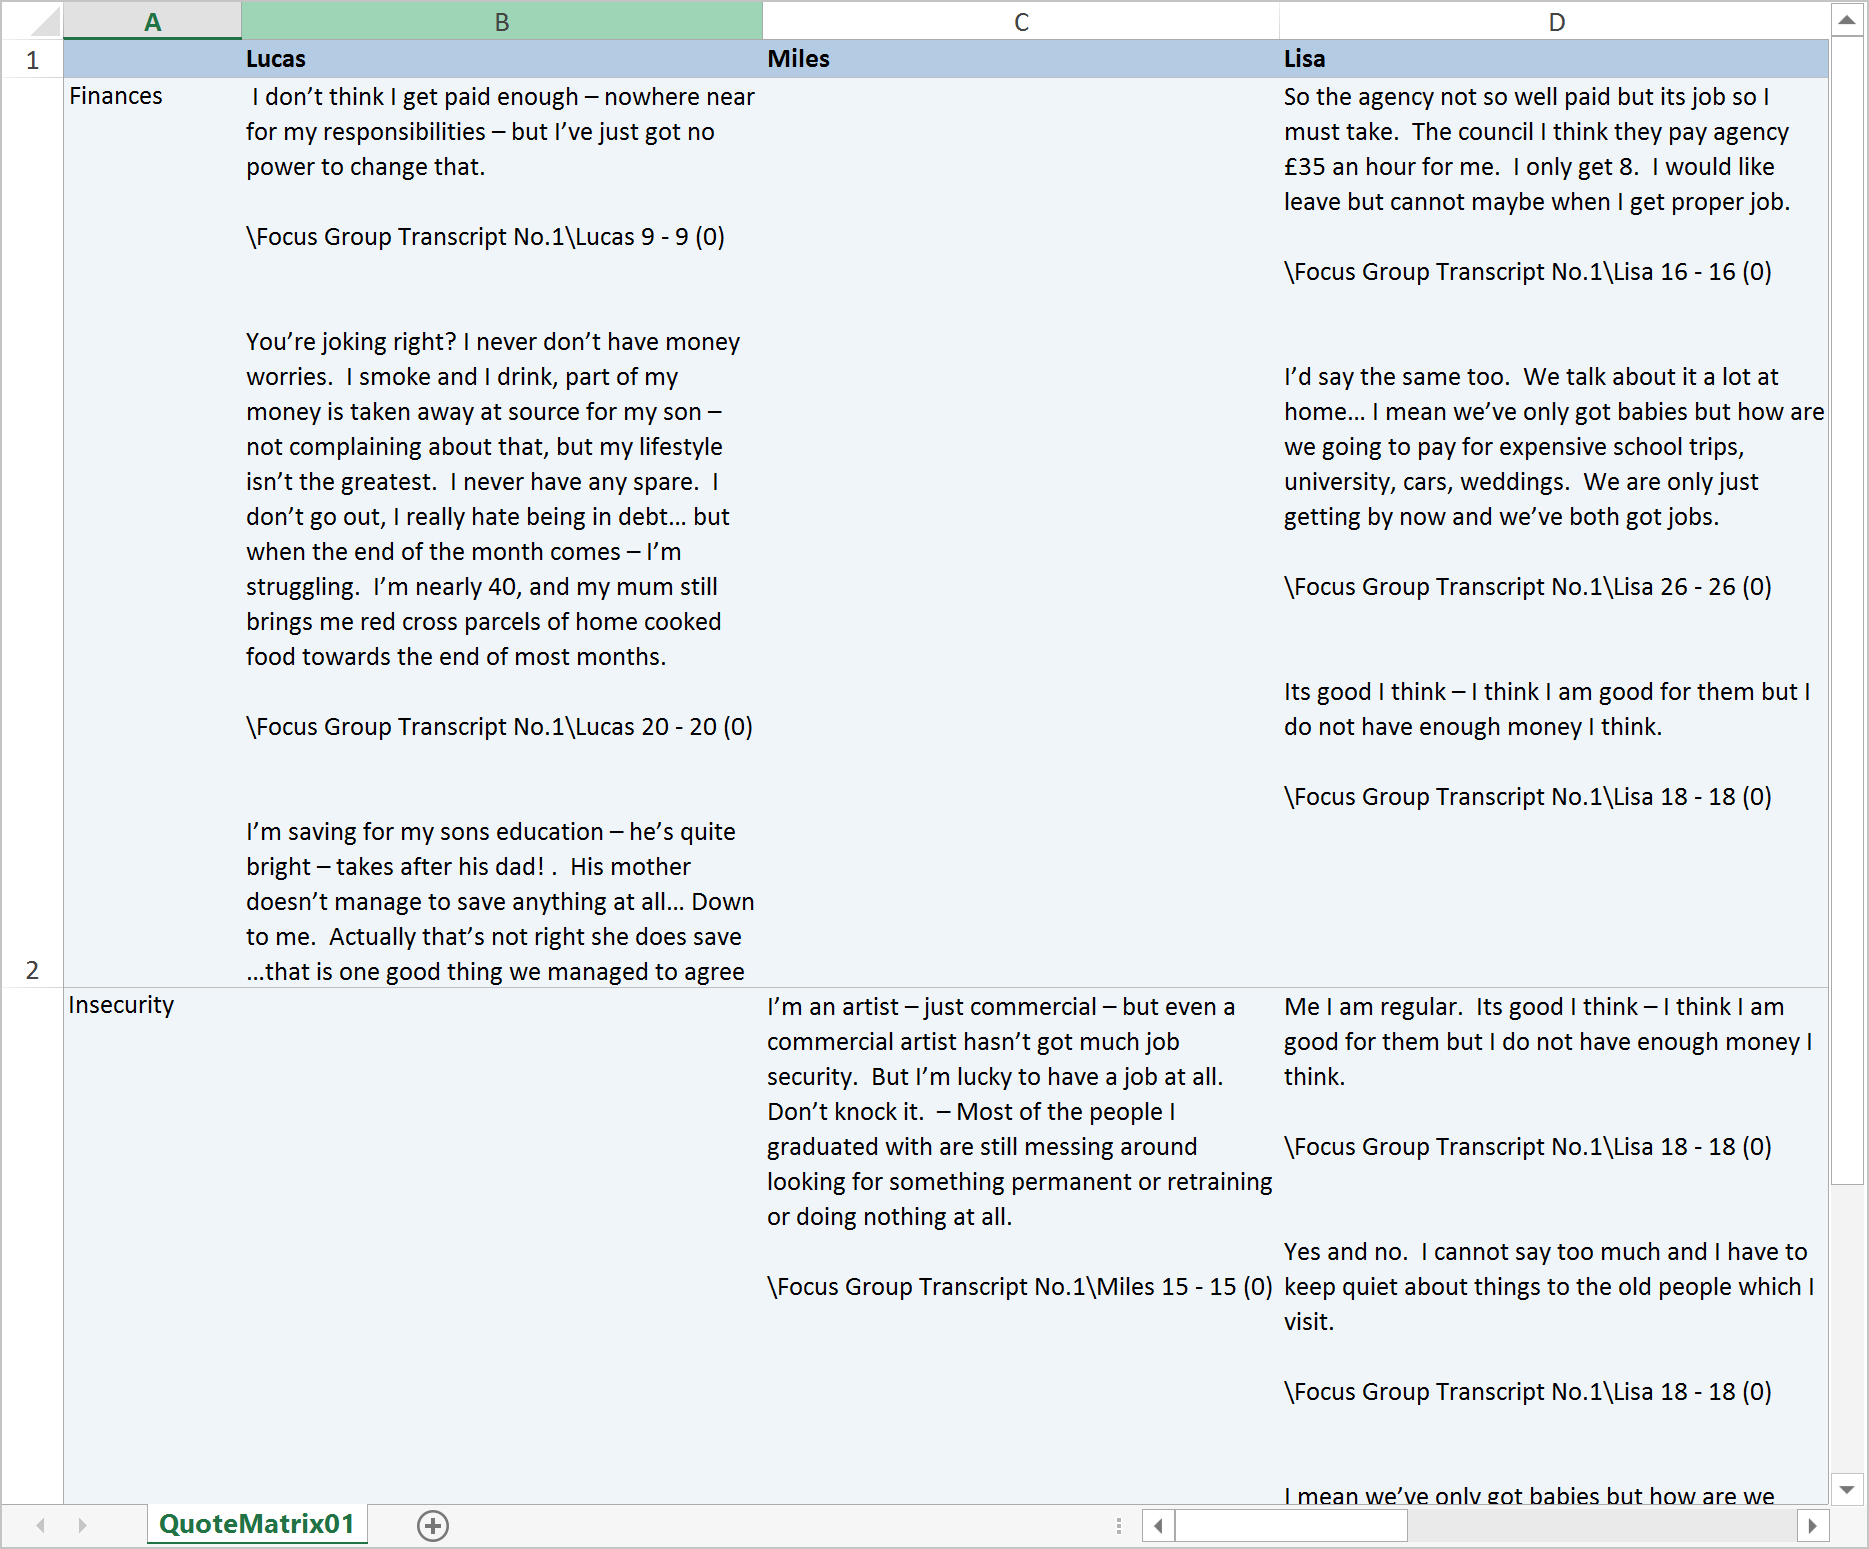
Using MAXQDA’s Quote Matrix, you can synoptically compile coded segments. This can be illustrated as follows: Behind every square in the image above is a certain number of coded text segments, which can be easily compiled by, for example, double-clicking on the square. A Quote Matrix contains not only the text segments that lie behind a square, but also compiles the text segments of all the squares together in a table.
To create a Quote Matrix, click the Quote Matrix ![]() button in the Code Matrix Browser toolbar. MAXQDA will open a window where you can select a location and an output format, which include: Excel, RTF, HTML, and TXT. The Excel format is suitable for tables with many columns; otherwise the RTF format, which can be opened with all standard word processing programs such as Word, is recommended.
button in the Code Matrix Browser toolbar. MAXQDA will open a window where you can select a location and an output format, which include: Excel, RTF, HTML, and TXT. The Excel format is suitable for tables with many columns; otherwise the RTF format, which can be opened with all standard word processing programs such as Word, is recommended.

An indication of origin appears below each segment: The contribution in the upper left is from a statement by Lucas from paragraph 11 of the transcript, and encoded with a weight of 0.
