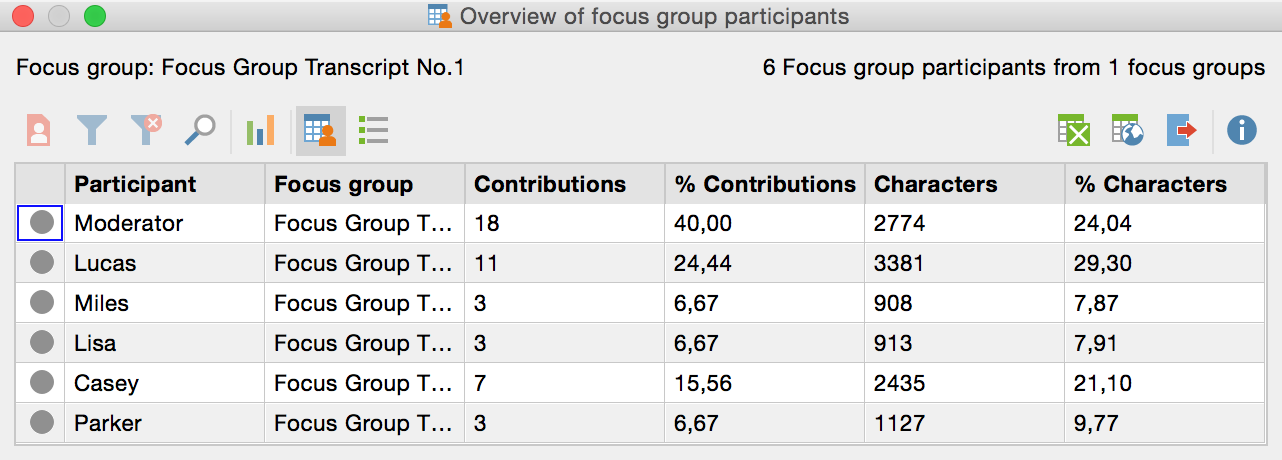
The "Overview of focus group participants" provides important information about the individual participants, such as the number and scope of their respective contributions, and also allows you to store additional information about each participant in the form of variables. To access the overview, right-click on a focus group in the "Document System" and choose Overview of focus group participants.
The following window will open:

The first two columns are used to identify the participants and their respective focus group transcript. The percentages of contributions and the characters always appear in the displayed table. If you have assigned a particular color to a participant, it will appear in the first column of the table.
In top of the window are several buttons, whose special functions in relation to the focus group analysis are explained here:
![]() Only activated focus group participants - Reduces rows to those of participants activated in the “Document System”. This is especially handy if you want to exclude Moderators from the overview: Activate only the other participants and click the button.
Only activated focus group participants - Reduces rows to those of participants activated in the “Document System”. This is especially handy if you want to exclude Moderators from the overview: Activate only the other participants and click the button.
![]() Statistics - Presents the values of all the columns displayed in a frequency table or chart, excluding the “participants” and “focus group” columns. More information on frequency tables and charts can be found here >> LINK.
Statistics - Presents the values of all the columns displayed in a frequency table or chart, excluding the “participants” and “focus group” columns. More information on frequency tables and charts can be found here >> LINK.
![]() Data Editor - Turns on the Variable View, in which the variable values are visible.
Data Editor - Turns on the Variable View, in which the variable values are visible.
![]() List of variables - Switches to Variable View, where you can define new variables and adjust and edit existing variables. More information on the use of variables in focus group analysis is provided in the next section.
List of variables - Switches to Variable View, where you can define new variables and adjust and edit existing variables. More information on the use of variables in focus group analysis is provided in the next section.
Editing Variables for Focus Group Participants
You can store background information for each participant in a focus group for selective analyses and comparisons; for example, comparing the statements of older and younger participants. First open the "Overview of focus group participants" from the context menu in the "Document System" (either at the top level for all focus groups in the project, or at the level of a single focus group).
As seen above, the default overview contains multiple columns of information that MAXQDA compiles for the participants. You can add more columns for information such as, for example, age, profession, or professional rank.
Creating new variables
Adding new variables is done in the same way as in other overviews of variables in MAXQDA:
- Click on the List of Variables button
 to switch to Variable View.
 - Next, click on the New Variable
 button.
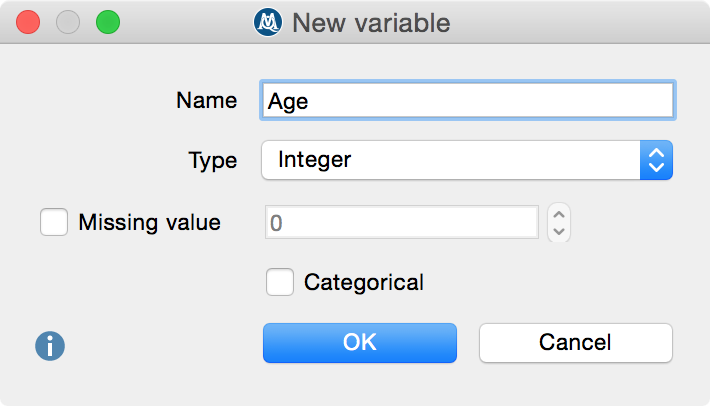
A new window will appear, in which you can define the name and type of the new variable.

After clicking OK, you will see that a line has been added with the newly added variable in Variable View.

Entering values for the participants
Click on the button ![]() Overview of focus group participants to return to the normal view. On the far right you will see a newly added column, in which you can enter values for each participant. The editable column can be easily recognized by its blue column heading, unlike the black headings of the columns automatically generated by MAXQDA.
Overview of focus group participants to return to the normal view. On the far right you will see a newly added column, in which you can enter values for each participant. The editable column can be easily recognized by its blue column heading, unlike the black headings of the columns automatically generated by MAXQDA.

The variable values for participants can be used:
- To activate only selected participants with specific values for further analysis or
- in a Crosstab for focus group to compare groups of participants.
