Tables in MAXQDA can be customized as in Excel or other similar spreadsheet programs. For the following example, we’ll use the table view of the document variables in MAXQDA:

The heading of each column has the name of each variable, although the standard MAXQDA system fields are written in a different font color:
- Document group – the name of the Document group in which the document is found
- Document name – the name of the document
- Creation date – the date on which the document was imported
- Author – the user that was logged in when the document was imported
- Number of coded segments – the number of coded segments in the document
- Number of memos – the number of memos in the document
Adjusting column width and position
The width of each column can be changed by clicking and dragging the border between the columns. Double-clicking on the column header border to the right of the column resizes the column to its optimal size, so that the contents of each row can be fully seen.

It is also very easy to change the order of the columns. You just need to click on a column header and drag it to the place you wish to have it.
By right-clicking on a column header, the context menu appears for that particular column. This includes various options, including the option to hide the column or search within the column. The Select field option opens a window where you can select which of the columns should be viewed in the standard view.
Sorting Tables
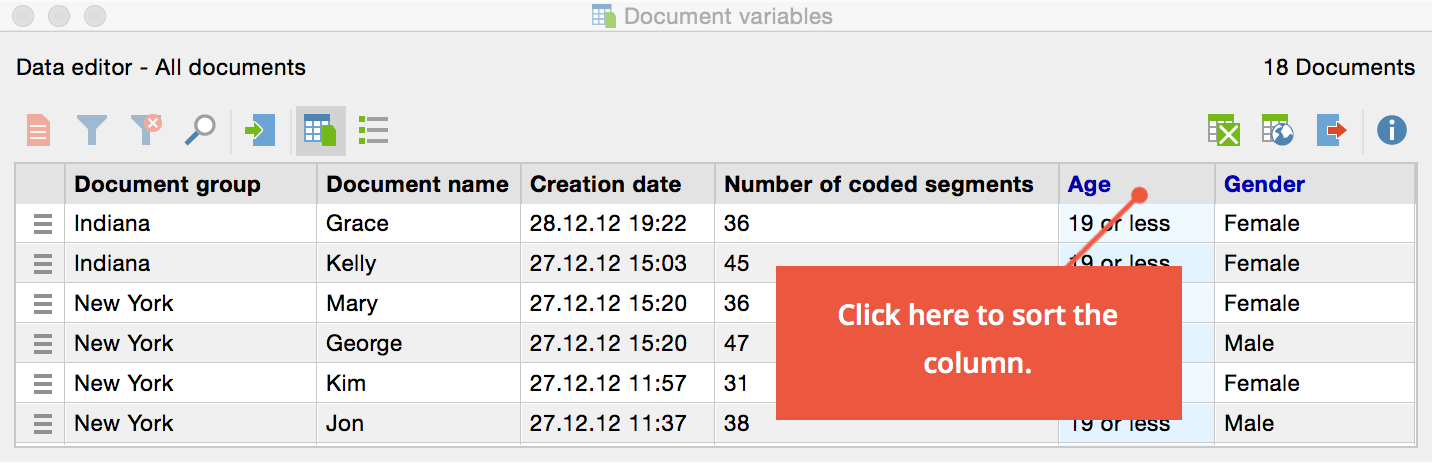
Tables can be sorted alphabetically or in reverse alphabetical order. Clicking once on the column header sorts it alphabetically; clicking a second time sorts it in reverse. A small triangle appears inside the column header of the column that is currently being used to sort the table and whether it is sorted alphabetically or in reverse alphabetical order.
In the editable cells of the table, you can enter or change a value by double-clicking on the cell and then typing the value.
Selecting Rows in the Table
The table contents can also be selected and copied into the Windows clipboard. The selection of one or multiple rows, or a section of the table, is done as follows: A single cell can be selected by simply clicking on it, and additional cells can be added to the selection by holding the Ctrl key (Windows) or Command key (Mac) and a section of the table can be selected by clicking the first and last rows to be included while holding down the Shift key. In MAXQDA, the selected sections of a table are highlighted in green.
You can also search for certain values within each column of tables in MAXQDA. You only need to right-click on the column in which you want to search and select Search. In string fields, the search will start with the initial character. If you wish to search for a certain word or phrase that does not have to appear at the beginning of the value, you can use the asterisk (*) at the beginning of your search.
Context Menus for Tables
All overviews in MAXQDA have context menus that can be called up by using the right mouse button. The number of options that appear in the context menu depends on the overview. It is usually possible to delete a selection (e.g. a coded segment or memo). In the “Overview of coded segments,” you also have the option to change the weight score of each segment. The most options are available in the document variables table.

Table overviews with detailed view
The "Overview of coded segments" differs from, for example, from the "Overview of variables" in that it is divided into two parts. The lower section is used just as in other tables. The upper section serves as a detailed view. Here, the coded segment, or text or image segment itself that is selected in the bottom section appears. The same applies to the “Overview of Memos”: Here the detailed view of the memo will appear.
