Function of this model
This model displays the intersections (or co-occurrences) of selected codes with other codes. It is also possible to make the model more complex by including subcodes.
Model display in the map
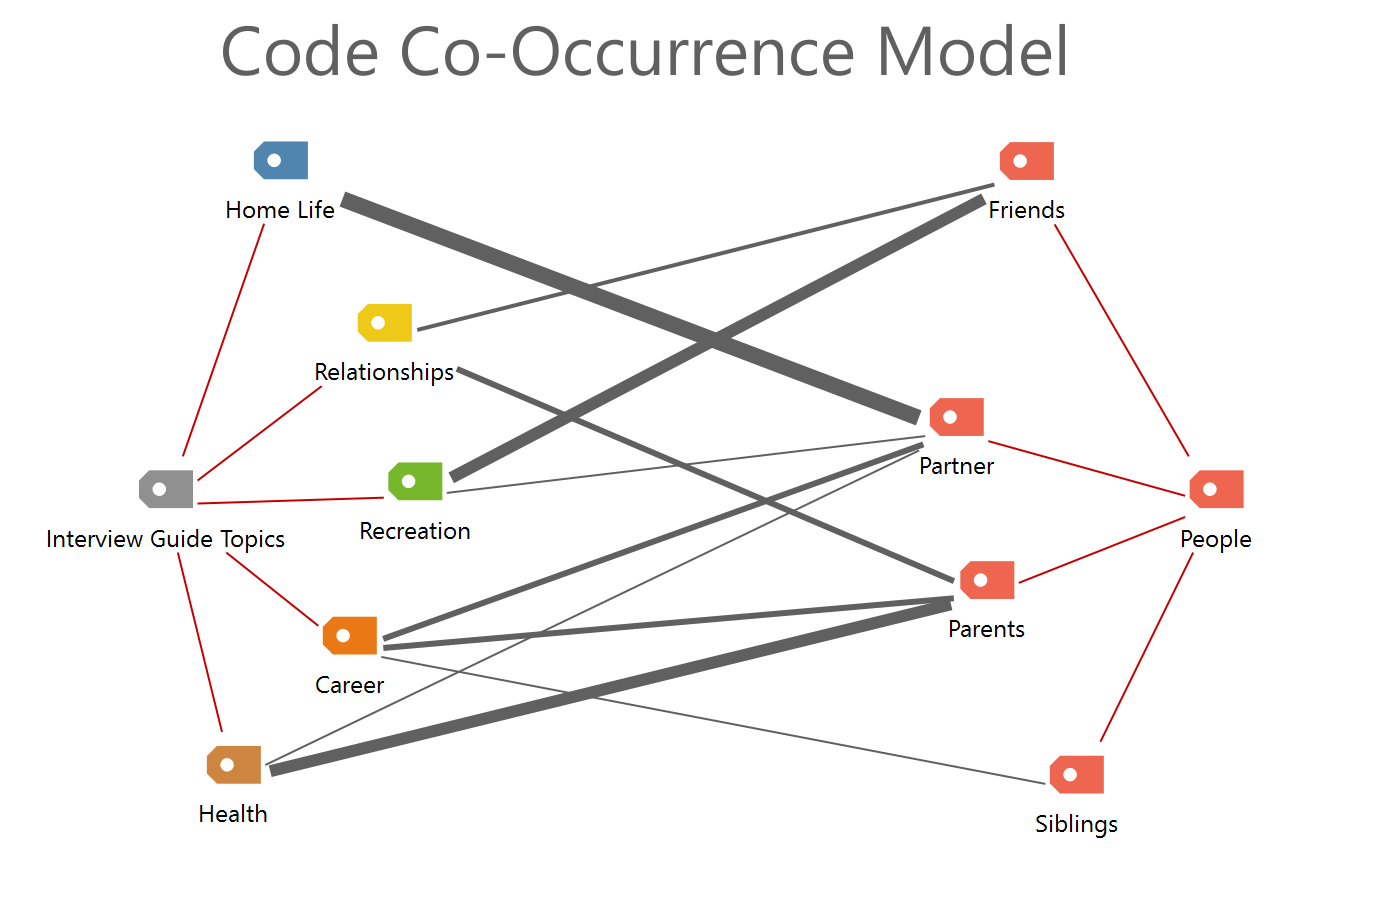
One or more codes are selected and dragged onto the MAXMaps work space. These codes are connected with a black line to the code(s) with which they intersect. The thickness of the lines indicates the frequency of the intersections. If the two codes intersect many times, the line connecting the two will be thicker. Codes are connected to their subcodes with red lines.

Model options in detail

Code/Subcode options
- You can now select which codes are to be included in the map.
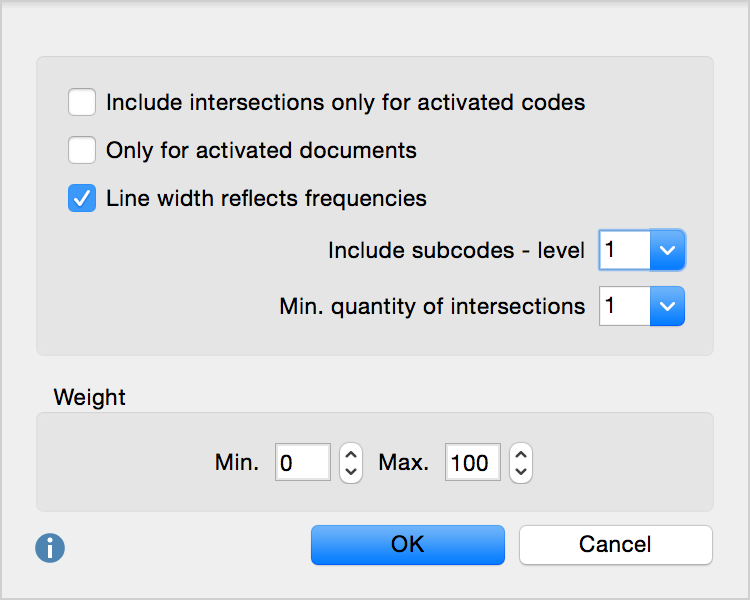
- The visualization can be limited to include only intersections with activated subcodes.
- You can select how many levels of subcodes are to be included (0 = none; 1 = only the first level; 2 = the first two levels).
- The minimum number of intersections can also be set. If this minimum number of intersections isn’t reached, the connections will not be included in the map.
Co-Occurrence options
- By selecting a certain required code weight, you can limit the displayed intersections according to its relevance. By setting the required weight to 80 to 100, for example, one would analyze only those codes, to which the researcher assigned such a high value.
